3345 East Shelbiana Rd · Pikeville, KY
Flood risk 6/10 · Moderate
- FEMA flood zone
- X (shaded)
- Chance of flooding over 30 yrs
- 0.58%
- Est. flood insurance / yr
- $473 – $860
Fire risk 6/10 · Moderate
- Est. fire insurance / yr
- $839 – $1,559
Heat risk 5/10 · Moderate
- Hot days now (above 101°F)
- 8 days/yr
- Hot days in 30 yrs
- 22 days/yr
Wind risk 2/10 · Minimal
- Chance of severe wind over 30 yrs
- 1.0%
Air-quality risk 1/10 · Minimal
- Unhealthy air days now
- 0 days/yr
- Unhealthy air days in 30 yrs
- 0 days/yr
Risk factors via First Street. Map © Google.
Why this score? — see what drove the C grade
The composite is a weighted blend of 9 inputs, each scored 0–100. Each bar is that input's sub-score; the figure is the points it added to the 100-point composite (weight × sub-score).
- Cash flow +14.4/30.0
- ARV discount +14.3/15.0
- Appreciation +7.6/10.0
- DSCR +4.4/10.0
- 1% rule +4.0/10.0
- Livability +3.6/5.0
- Condition / age +2.8/5.0
- Schools +2.6/10.0
- Rent growth +2.5/5.0
$149,900
🖨 Deal sheet (PDF) 📄 Offer letter ✓ Due diligence
Listing remarks MLS
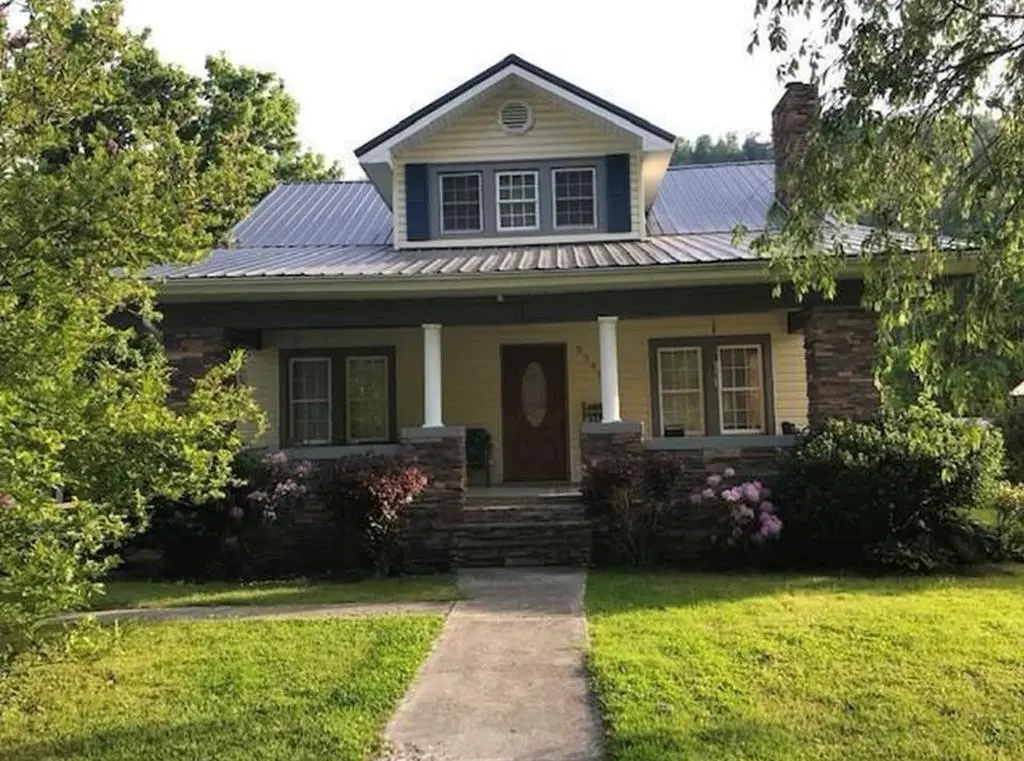
This nice home offers living room, kitchen, dining room, and first floor bedroom upstairs is three bedrooms and one full bath. Basement. Enjoy the nice covered front porch.
Key facts
- Covered front porch
- Kitchen
- Living room
Tags
Neighborhood map
What this means for you Summary
Snapshot
- This is a 4-bed/1.5-bath single-family listed at $150k. Condition is rated average.
Deal economics
- At list price, monthly cash flow is $30 ($359/yr) — positive.
- The deal already cash-flows at list — no discount required.
- To meet the 1% rule (rent ≥ 1% of price), the offer needs to be $135k (10.0% below list).
- Recommended offer: $135k (10.0% below list) — sets the bar for 1% rule.
- Cap rate 6.5% vs local median 2.7% in Pikeville — top-decile yield for the area; either an underpriced asset or a hidden risk that comps aren't pricing in. Stress-test before assuming the spread holds.
Location & tenants
- Location reads 71/100 on livability (#139 in KY) — a middle-class / working-renter tenant base. Strengths: cost of living A+, health & safety A+, crime B+; Watch: schools D, amenities F, commute F.
- Pike County (rural): math 24% / reading 40% proficiency, ranked #98 of 165 in KY (top 59%) — families likely to look elsewhere, expect single-tenant / working-renter base with shorter leases.
- Market conditions: 9 active listings in the ZIP; 4 units permitted in Pike County in 2024 (0 in 5+ unit buildings).
Forward outlook
- In year one you build about $9k of equity ($1k loan paydown + $8k appreciation (5.2% local appreciation)).
- Pike County population projected at -33% by 2050 — secular population decline; favor cash flow + early exit over multi-decade hold.
- At projected returns (5.2% appreciation + 3.0% rent growth), your $42k cash investment doubles in ~5 years — after that, you're playing with house money.
- By year 5, paydown + projected appreciation supports a ~$39k cash-out refi (75% LTV) — recoverable capital for the next deal without selling this one.
Negotiation context
- It's been on market 64 days — a 6% lower offer ($141k) is reasonable based on typical stale-listing flexibility.
- 3 sale attempts since 2y ago with the ask held roughly flat each time — persistent listings suggest the price (not the market) is what's stuck; bring a comps-based counter.
Risks & watch-outs
- Watch-outs: built in 1940 — expect roof / HVAC / electrical / plumbing capex.
- Climate carrying-cost: major flood risk; major wildfire risk; extreme-heat days projected 8→22/yr by 2055 (HVAC capex compounding) — expect insurance premiums to compound above CPI over the hold.
Questions for the listing agent
- It's been on market 64 days. Have you received any prior offers? Is the seller open to a 10% concession, seller financing, or rate buy-down credit?
- Built in 1940 — when were the roof, HVAC, electrical panel, plumbing, and water heater last replaced?
- Why hasn't it sold? Are there any deal-killer items the seller is aware of (foundation, flood, title, zoning, code violations)?
- Is there a deadline driving the sale (1031 exchange, divorce, estate, relocation)? That informs how much negotiation room exists.
- Schools are D-rated, which usually means shorter tenancies and higher turnover. Who's the typical renter profile here, and what's been the actual vacancy rate?
- What's the average days-on-market for RENTAL listings here right now (not sales)? A rising rental-DOM trend means longer vacancies and softer asking-rent achievability than the comps imply.
- What's the recent tenant-quality profile in this submarket — average credit score on applications, eviction rate, late-payment / NSF rate, and stable-employment percentage? A property-management company in the area should have these aggregated.
- How much new for-sale + rental construction is in the pipeline within 1–3 miles? Heavy new supply typically softens prices + rents 12–24 months out; constrained supply supports both.
Investment metrics
- 1% rule
- 0.90% ✗
- Cap rate
- 6.53%
- Cash-on-cash
- 0.86%
- DSCR
- 1.04
- GRM
- 9.3
CMA / ARV
- ARV (median comp)
- $176,642
- List price
- $149,900
- Delta
- -15.14%
- Verdict
- UNDERPRICED
- Comps
- 3 within 1.0 mi
Show comp detail 1 sale within ~0.75 mi
| Address | Dist | Beds/Ba | Sqft | Sold | Price | $/sf | Match |
|---|---|---|---|---|---|---|---|
| 3190 East Shelbiana Rd | 0.16mi | 5/1.5 (+1) | 1,898 (-3%) | 21mo | $158,000 | $83 | 65 |
Match score weights: distance 35% · size 25% · config 20% · recency 20%. Top-matched comps best support the ARV.
Projected returns pro-forma
5.2% appreciation · 3.0% rent growth · sell at horizon
- IRR
- 14.1%
- Equity multiple
- 1.91×
- Total profit
- $38,220
- Equity at exit
- $86,802
- IRR
- 14.8%
- Equity multiple
- 3.70×
- Total profit
- $113,163
- Equity at exit
- $151,366
Cash invested: $41,972 (down + closing). Projections, not guarantees.
Landlord ↔ Tenant lean methodology
- Overall (STATE)
- 83 Strongly Landlord-Friendly
- State Kentucky
- 83 Strongly Landlord-Friendly · R+16
- County
- — inherits STATE
- City
- — inherits STATE
ZIP-level market 41562
- Home prices YoY
- 4.4%
- Active inventory
- 9
- Price-to-rent
- 9.3×
Monthly cashflow live
- Estimated rent
- $1,349 medium interval (Pro) →
- Mortgage (P&I)
- −$786
- Tax est. 1.5%
- −$187 /mo · $2,248/yr
- Insurance
- −$62
- HOA
- −$0
- Vacancy / Maint / Mgmt
- −$283
- Net cashflow
- $30
Break-even live
Sensitivity live
| Price | -10% $134 | -5% $82 | +0% $30 | +5% $-22 | +10% $-74 |
|---|---|---|---|---|---|
| Rent | -10% $-77 | -5% $-23 | +0% $30 | +5% $83 | +10% $137 |
| Rate | -1.0pp $105 | -0.5pp $68 | base $30 | +0.5pp $-9 | +1.0pp $-48 |
UW: 25.0% down · 7.5% · 30yr · 1.5% tax · 5.0% vac · 8.0% maint · 8.0% mgmt
Financing live
Cash to close
- Down payment
- $37,475
- Closing costs
- $4,497
- Reserves months
- —
- Total cash needed
- —
Loan-product check · same deal, 3 products live
Conventional
25% down · 7.5% · 30yr
- Down + closing
- —
- Monthly P&I
- —
- Monthly cashflow
- —
- DSCR
- —
- Eligible?
- —
Personal DTI + credit; lowest rate.
DSCR
20% down · 8.5% · 30yr
- Down + closing
- —
- Monthly P&I
- —
- Monthly cashflow
- —
- DSCR
- —
- Eligible?
- —
No personal income docs; deal must DSCR.
Hard money
10% down · 12.0% · 12mo
- Down + closing
- —
- Monthly P&I
- —
- Monthly cashflow
- —
- DSCR
- —
- Eligible?
- —
Short-term bridge; refi at stabilization.
Listing history 9 events
-
2026-06-04statusdays on market $149,900 Pending 64 DOM
-
2026-06-02days on market $149,900 Active 63 DOM
-
2026-06-01days on market $149,900 Active 62 DOM
-
2026-05-31days on market $149,900 Active 61 DOM
-
2026-05-31days on market $149,900 Active 60 DOM
-
2026-03-31$149,900 Active 173-char remark
Show marketing remark (173 chars)
This nice home offers living room, kitchen, dining room, and first floor bedroom upstairs is three bedrooms and one full bath. Basement. Enjoy the nice covered front porch.
-
2025-12-18price $155,000
-
2025-09-22$169,900 Active
-
2024-09-09$199,900 Active
ⓘ Source: listings_history table (triggers on properties + properties_extension) + one-shot
backfill from property_details.listing_events for pre-trigger history.
Climate risk First Street
- Flood 6/10 Major FEMA zone X (shaded) · 58% chance over 30 yrs
- Wildfire 6/10 Major
- Heat 5/10 Major 8 d/yr ≥101°F today · 22 d/yr by 30 yrs out
- Wind 2/10 Low 100% chance of damaging wind over 30 yrs
- Air quality 1/10 Low 0 unhealthy d/yr today · 0 by 30 yrs out
Nearby sold comps map
Loading sold comps map…
Walkable amenities ~0.75 mi
Loading nearby amenities…
Taxation est. · year 1
- Rental income
- $16,190
- − Mortgage interest
- −$8,397
- − Property taxes
- −$2,248
- − Insurance
- −$750
- − Repairs & maintenance
- −$1,295
- − Management
- −$1,295
- − Depreciation
- −$4,361
- Taxable loss
- −$2,156
- Est. tax savings @ 24.0%
- +$517
- After-tax cash flow
- $876/yr
For passive investors: Depreciation is non-cash, so a rental often shows a tax loss while cash-flowing — sheltering income. Rental losses are passive: they offset passive income freely, and up to $25,000/yr can offset ordinary (W-2) income if you actively participate and your MAGI is under $100k (phasing out to $0 by $150k); unused losses carry forward. On sale, claimed depreciation is recaptured at up to 25%, and gains may owe capital-gains tax (a 1031 exchange can defer both). Figures are a year-1 estimate at your 24.0% rate — not tax advice; consult a CPA.
Condition & rehab AI · 12 photos
This home requires moderate repairs and maintenance to improve its condition and value. Upgrades to the kitchen and bathroom, along with fresh paint and landscaping, can significantly enhance its appeal.
Repairs flagged
- Moderate Kitchen cabinets — Dated appearance
- Minor Kitchen countertops — Need cleaning
- Minor Bathroom shower curtain — Needs replacement
- Moderate Front porch and steps — Weathered appearance
- Minor Interior walls/paint — Faded in some areas
Value-add opportunities
- Both Paint interior walls — Fresh paint enhances curb appeal and interior aesthetics
- Both Replace kitchen cabinets — Modern cabinets improve functionality and aesthetics
- Both Replace bathroom shower curtain — Fresh shower curtain enhances cleanliness and appearance
- Both Trim landscaping — Neat landscaping improves curb appeal and enhances property value
Renovation cost estimate screening
| Repair item | Severity | Est. cost |
|---|---|---|
| Kitchen cabinets · Dated appearance | Moderate | $3,000–15,000 |
| Kitchen countertops · Need cleaning | Minor | $500–3,000 |
| Bathroom shower curtain · Needs replacement | Minor | $500–3,000 |
| Front porch and steps · Weathered appearance | Moderate | $3,000–15,000 |
| Interior walls/paint · Faded in some areas | Minor | $500–3,000 |
| Total estimated repair cost · 5 items | $7,500–39,000 |
Value-add ROI direction
- Both Paint interior walls — Fresh paint enhances curb appeal and interior aesthetics ↑
- Both Replace kitchen cabinets — Modern cabinets improve functionality and aesthetics ↑
- Both Replace bathroom shower curtain — Fresh shower curtain enhances cleanliness and appearance ↑
- Both Trim landscaping — Neat landscaping improves curb appeal and enhances property value ↑
ⓘ Cost ranges are severity-bucket heuristics (US national rule-of-thumb). Get contractor quotes + a written scope before underwriting a rehab budget.
Schools (NCES district)
- District
- Pike County
- NCES district ID
- 2104800
- Math proficiency
- 24% ▼ -24.00%
- Reading proficiency
- 40% ▼ -20.00%
- Median HH income
- $32,601
- Composite
- 26.14/100
- National rank
- #7276
- State rank
- #98 of 165 in KY
Livability — Pikeville
- Score
- 71/100
- State rank
- #139
- US rank
- #6715
Category grades
Schools grade is shown separately in the Schools card above.
Census & demographics
- Population (ZIP)
- 1,779
Population outlook (Pike County) Hauer SSP2
- Today (2025)
- 55,108 people
- By 2030
- 51,235 · -7.0%
- By 2040
- 43,573 · -20.9%
- By 2050
- 36,797 · -33.2%
- By 2075
- 24,330 · -55.9%
- By 2100
- 15,611 · -71.7%
Race, ethnicity, and origin ACS 2023
- Neighborhood character
- Predominantly White (100%)
- Race & ethnicity
- White 100%
- Common ancestry
- Serbian 4%
Political lean MEDSL · Pike
- 2024 margin
- Solid R (+65.4) · D 16.8% · R 82.2%
- 2008→2024 swing
- -51.6pp toward R · 2008: -13.8pp · 2024: -65.4pp
- All cycles
- 2024: R+65.4 2020: R+60.7 2016: R+62.8 2012: R+50.5 2008: R+13.8
Not yet ingested
- Civics
- —
Market trends
- HPI YoY
- ▲ 5.20%
- Current HPI
- 122.8091
- Rent YoY
- —
- Metro
- —
- State GDP YoY
- ▲ 1.81%
- F500 in state
- 4
Industry mix (Fortune 500 HQ in KY)
| Industry | F500 HQs | Revenue |
|---|---|---|
| Healthcare | 1 | $118B |
|
||
| Food / Beverage | 1 | $7B |
|
||
Price history
-25.0% since first listed4 events — show timeline
- 2026-03-31 Listed $149,900 EKAR
- 2025-12-18 Price Changed $155,000 EKAR
- 2025-09-22 Listed $169,900 EKAR
- 2024-09-09 Listed $199,900 EKAR
Cash-flow waterfall
monthlySold comps — $/sqft
last 12 mo · ≤1 miLoading sold comps…