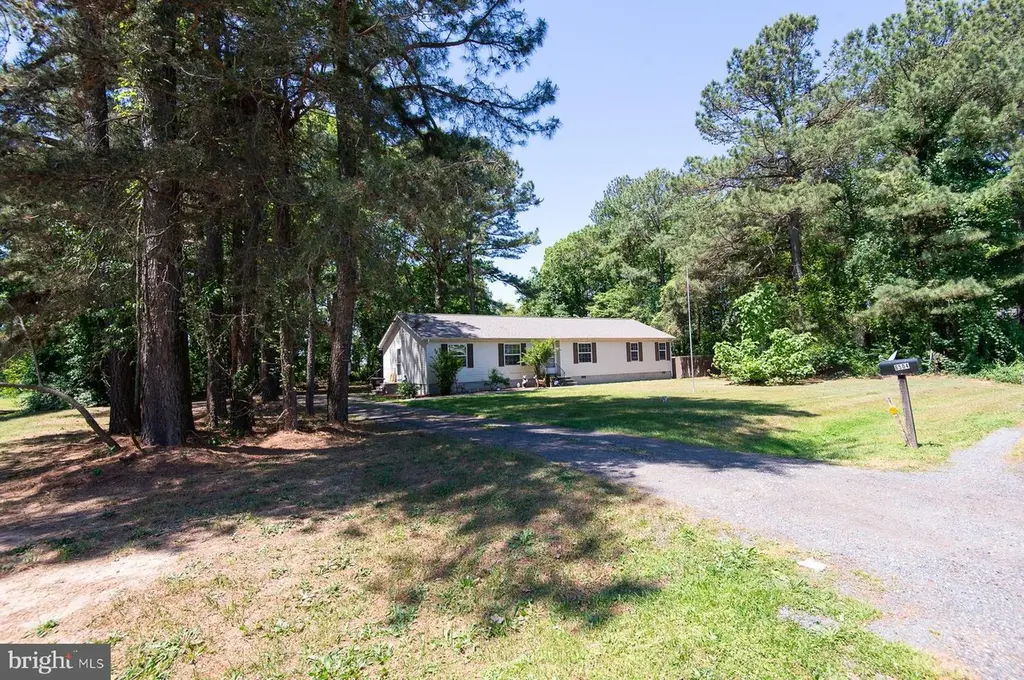
6504 Cabin Ridge Rd · Hurlock, MD
Flood risk 1/10 · Minimal
- FEMA flood zone
- X (unshaded)
- Chance of flooding over 30 yrs
- 0.0%
- Est. flood insurance / yr
- $507 – $1,088
Fire risk 1/10 · Minimal
- Est. fire insurance / yr
- $755 – $1,403
Heat risk 8/10 · Major
- Hot days now (above 105°F)
- 7 days/yr
- Hot days in 30 yrs
- 16 days/yr
Wind risk 6/10 · Moderate
- Chance of severe wind over 30 yrs
- 67.0%
Air-quality risk 3/10 · Minor
- Unhealthy air days now
- 2 days/yr
- Unhealthy air days in 30 yrs
- 3 days/yr
Risk factors via First Street. Map © Google.
Why this score? — see what drove the A- grade
The composite is a weighted blend of 9 inputs, each scored 0–100. Each bar is that input's sub-score; the figure is the points it added to the 100-point composite (weight × sub-score).
- Cash flow +28.8/30.0
- ARV discount +15.0/15.0
- DSCR +10.0/10.0
- Appreciation +10.0/10.0
- 1% rule +7.5/10.0
- Livability +3.1/5.0
- Rent growth +2.5/5.0
- Condition / age +2.5/5.0
- Schools +1.5/10.0
$199,900
🖨 Deal sheet 📄 Offer letter ✓ Due diligence
Listing remarks MLS
Rare find- doublewide homes allowed. Survey, Health Dept. Status report and Covenants and Restrictions on file. Survey reflects 42,456 +/- sf. Lot may be located in a Forest Protection Area.
Key facts
- Ideal location
- Spacious acreage
- Peaceful setting
Tags
Property features AI
Finance
- Other: Fee simple ownership
Exterior
- Parking: Driveway
- Utilities: Well water; Septic system; Electric hot water
- Home design: Manufactured home; Outside city limits
- Construction: Estimated year built; Above-grade finished living space (estimated 1,625)
- Exterior features: Personal pool; Other above-grade structures
Interior
- Kitchen: Kitchen
- Bedrooms: 3 bedrooms on main level (Master bedroom, Bedroom 2, Bedroom 1)
- Bathrooms: 2 full bathrooms on main level
- Heating & cooling: Forced air heating; Propane (leased) heating fuel; Central air conditioning (electric)
- Interior features: Estimated living area; Living room; Dining room; Foyer
Neighborhood map
What this means for you Summary
Snapshot
- This is a 3-bed/2.0-bath manufactured listed at $200k.
Deal economics
- At list price, monthly cash flow is $670 ($8k/yr) — positive.
- The deal already cash-flows at list — no discount required.
- Meets the 1% rule at list price ($2k rent vs $200k).
- Cap rate 10.3% vs local median 4.7% in Hurlock — top-decile yield for the area; either an underpriced asset or a hidden risk that comps aren't pricing in. Stress-test before assuming the spread holds.
Location & tenants
- Location reads 61/100 on livability (#332 in MD) — a middle-class / working-renter tenant base. Strengths: cost of living A+, housing A+, crime B+; Watch: employment D+, amenities F, commute F.
- Dorchester County Public Schools (rural): math 10% / reading 23% proficiency, ranked #23 of 24 in MD (top 96%) — low school quality limits family demand, transient renter base, plan for 1-2y turnover.
- Zoned schools: Warwick Elementary School (math 17% / reading 27%, grade F, #297 of 860 statewide, top 38%, 347 students, 100% FRL); North Dorchester Middle School (math 10% / reading 30%, grade F, #147 of 225 statewide, top 68%, 415 students, 100% FRL); North Dorchester High School (math 42% / reading 62%, grade D+, #100 of 222 statewide, top 47%, 572 students, 100% FRL) — zoned schools average 100% FRL vs 58% district-wide (42 pts higher); higher-poverty schools than district average — tighter screening recommended.
- Zoned-school proficiency averages 31% at this address vs 16% district-wide (+15 pts) — the actual schools serving this property are materially stronger than the Dorchester County Public Schools average implies; a family-tenant draw the district grade alone would hide.
- Market conditions: 34 active listings in the ZIP; 1 comparable units currently listed for rent nearby; 81 units permitted in Dorchester County in 2024 (0 in 5+ unit buildings).
Forward outlook
- In year one you build about $21k of equity ($1k loan paydown + $20k appreciation (10.0% local appreciation)).
- Dorchester County population projected to shrink 10% by 2050 — rents likely to lag national; underwrite the cash flow, not the appreciation.
- At projected returns (10.0% appreciation + 3.0% rent growth), your $56k cash investment doubles in ~2 years — after that, you're playing with house money.
- By year 2, paydown + projected appreciation supports a ~$34k cash-out refi (75% LTV) — recoverable capital for the next deal without selling this one.
Negotiation context
- Only 8 days on market — expect competitive offers; lowballing is unlikely to land.
- 5 sale attempts since 28y ago with the ask held roughly flat each time — persistent listings suggest the price (not the market) is what's stuck; bring a comps-based counter.
Risks & watch-outs
- Climate carrying-cost: major wind risk, 67% chance of damaging wind over 30y; extreme-heat days projected 7→16/yr by 2055 (HVAC capex compounding) — expect insurance premiums to compound above CPI over the hold.
Questions for the listing agent
- Is there a deadline driving the sale (1031 exchange, divorce, estate, relocation)? That informs how much negotiation room exists.
- Schools are F-rated, which usually means shorter tenancies and higher turnover. Who's the typical renter profile here, and what's been the actual vacancy rate?
- What's the average days-on-market for RENTAL listings here right now (not sales)? A rising rental-DOM trend means longer vacancies and softer asking-rent achievability than the comps imply.
- What's the recent tenant-quality profile in this submarket — average credit score on applications, eviction rate, late-payment / NSF rate, and stable-employment percentage? A property-management company in the area should have these aggregated.
- How much new for-sale + rental construction is in the pipeline within 1–3 miles? Heavy new supply typically softens prices + rents 12–24 months out; constrained supply supports both.
Investment metrics
- 1% rule
- 1.25% ✓
- Cap rate
- 10.32%
- Cash-on-cash
- 14.37%
- DSCR
- 1.64
- GRM
- 6.7
CMA / ARV
- ARV (median comp)
- $292,873
- List price
- $199,900
- Delta
- -31.75%
- Verdict
- UNDERPRICED
- Comps
- 17 within 1.0 mi
Projected returns pro-forma
10.0% appreciation · 3.0% rent growth · sell at horizon
- IRR
- 34.9%
- Equity multiple
- 3.71×
- Total profit
- $151,540
- Equity at exit
- $180,086
- IRR
- 30.0%
- Equity multiple
- 8.37×
- Total profit
- $412,680
- Equity at exit
- $388,362
Cash invested: $55,972 (down + closing). Projections, not guarantees.
Landlord ↔ Tenant lean methodology
- Overall (STATE)
- 27 Tenant-Leaning
- State Maryland
- 27 Tenant-Leaning · D+14
- County
- — inherits STATE
- City
- — inherits STATE
ZIP-level market 21643
- Home prices YoY
- 15.5%
- Active inventory
- 34
- Price-to-rent
- 6.7×
Monthly cashflow live
- Estimated rent
- $2,500 medium interval (Pro) →
- Mortgage (P&I)
- −$1,048
- Tax from tax record
- −$173 /mo · $2,080/yr
- Insurance
- −$83
- HOA
- −$0
- Vacancy / Maint / Mgmt
- −$525
- Net cashflow
- $670
Break-even live
UW: 25.0% down · 7.5% · 30yr · 1.5% tax · 5.0% vac · 8.0% maint · 8.0% mgmt
Financing live
Cash to close
- Down payment
- $49,975
- Closing costs
- $5,997
- Reserves months
- —
- Total cash needed
- —
Loan-product check · same deal, 3 products live
Conventional
25% down · 7.5% · 30yr
- Down + closing
- —
- Monthly P&I
- —
- Monthly cashflow
- —
- DSCR
- —
- Eligible?
- —
Personal DTI + credit; lowest rate.
DSCR
20% down · 8.5% · 30yr
- Down + closing
- —
- Monthly P&I
- —
- Monthly cashflow
- —
- DSCR
- —
- Eligible?
- —
No personal income docs; deal must DSCR.
Hard money
10% down · 12.0% · 12mo
- Down + closing
- —
- Monthly P&I
- —
- Monthly cashflow
- —
- DSCR
- —
- Eligible?
- —
Short-term bridge; refi at stabilization.
Rent comps 1 comps
| Address | Beds | Baths | Sqft | Rent | $/sqft | DOM | Units | Dist |
|---|---|---|---|---|---|---|---|---|
| 4319 Dolby Farm Rd Hurlock, MD | 4.0 | 2.0 | 1960 | $2,500 | $1.28 | 43d | 1 | 1.35mi |
Listing history 14 events
-
2026-06-02status $199,900 Pending 8 DOM
-
2026-05-11$199,900 Active 1556-char remark
-
2007-07-26soldstatus $205,500
-
2007-05-05historical
-
2006-10-11
-
2004-09-13soldstatus $42,000
-
2004-09-09soldstatus $42,000
Show marketing remark (190 chars)
Rare find- doublewide homes allowed. Survey, Health Dept. Status report and Covenants and Restrictions on file. Survey reflects 42,456 +/- sf. Lot may be located in a Forest Protection Area.
-
2004-08-19historical
Show marketing remark (190 chars)
Rare find- doublewide homes allowed. Survey, Health Dept. Status report and Covenants and Restrictions on file. Survey reflects 42,456 +/- sf. Lot may be located in a Forest Protection Area.
-
2004-08-10$40,000
Show marketing remark (190 chars)
Rare find- doublewide homes allowed. Survey, Health Dept. Status report and Covenants and Restrictions on file. Survey reflects 42,456 +/- sf. Lot may be located in a Forest Protection Area.
-
2002-03-08historical
-
2001-03-26
-
1999-02-06historical
-
1998-02-06
-
1994-08-24soldstatus $20,000
ⓘ Source: listings_history table (triggers on properties + properties_extension) + one-shot
backfill from property_details.listing_events for pre-trigger history.
Tax reassessment forecast MD · Partial reset (capped growth)
- Current annual tax
- $2,080 · $173/mo
- Projected year-2 tax
- $2,129 · $177/mo
- Expected delta
- +$50/yr (+$4/mo · 2.4%)
ⓘ Screening estimate from a state-policy table — verify with the county assessor before closing.
Climate risk First Street
- Flood 1/10 Low FEMA zone X (unshaded) · 0% chance over 30 yrs
- Wildfire 1/10 Low
- Heat 8/10 Severe 7 d/yr ≥105°F today · 16 d/yr by 30 yrs out
- Wind 6/10 Major 67% chance of damaging wind over 30 yrs
- Air quality 3/10 Moderate 2 unhealthy d/yr today · 3 by 30 yrs out
Nearby sold comps map
Loading sold comps map…
Walkable amenities ~0.75 mi
Loading nearby amenities…
Taxation est. · year 1
- Rental income
- $30,000
- − Mortgage interest
- −$11,198
- − Property taxes
- −$2,080
- − Insurance
- −$1,000
- − Repairs & maintenance
- −$2,400
- − Management
- −$2,400
- − Depreciation
- −$5,815
- Taxable income
- $5,108
- Est. tax owed @ 24.0%
- −$1,226
- After-tax cash flow
- $6,815/yr
For passive investors: Depreciation is non-cash, so a rental often shows a tax loss while cash-flowing — sheltering income. Rental losses are passive: they offset passive income freely, and up to $25,000/yr can offset ordinary (W-2) income if you actively participate and your MAGI is under $100k (phasing out to $0 by $150k); unused losses carry forward. On sale, claimed depreciation is recaptured at up to 25%, and gains may owe capital-gains tax (a 1031 exchange can defer both). Figures are a year-1 estimate at your 24.0% rate — not tax advice; consult a CPA.
Schools (NCES district)
- District
- Dorchester County Public Schools
- NCES district ID
- 2400300
- Math proficiency
- 10% ▼ -14.00%
- Reading proficiency
- 23% ▼ -12.00%
- Median HH income
- $46,767
- Composite
- 14.65/100
- National rank
- #9404
- State rank
- #23 of 24 in MD
Livability — Hurlock
- Score
- 61/100
- State rank
- #332
- US rank
- #17536
Category grades
Schools grade is shown separately in the Schools card above.
Census & demographics
- Population (ZIP)
- 5,176
Population outlook (Dorchester County) Hauer SSP2
- Today (2025)
- 31,699 people
- By 2030
- 31,054 · -2.0%
- By 2040
- 29,712 · -6.3%
- By 2050
- 28,618 · -9.7%
- By 2075
- 28,436 · -10.3%
- By 2100
- 28,937 · -8.7%
Race, ethnicity, and origin ACS 2023
- Neighborhood character
- Diverse neighborhood (Simpson 0.55)
- Race & ethnicity
- White 61% Black 28% Two or more races 5% Hispanic / Latino 4%
- Common ancestry
- Lithuanian 2% Italian 2% Romanian 1%
- Foreign-born
- 3% · Canada
- Languages at home
- 96% English-only · Spanish 3%
Political lean MEDSL · Dorchester
- 2024 margin
- R (+14.6) · D 41.6% · R 56.1% · Other 2.3%
- 2008→2024 swing
- -6.3pp toward R · 2008: -8.2pp · 2024: -14.6pp
- All cycles
- 2024: R+14.6 2020: R+11.9 2016: R+16.0 2012: R+6.6 2008: R+8.2
Not yet ingested
- Civics
- —
Market trends
- HPI YoY
- ▲ 52.36%
- Current HPI
- 390.419
- Rent YoY
- —
- Metro
- —
- State GDP YoY
- ▲ 2.97%
- F500 in state
- 12
Industry mix (Fortune 500 HQ in MD)
| Industry | F500 HQs | Revenue |
|---|---|---|
| Aerospace / Defense | 1 | $71B |
|
||
| Utilities | 1 | $25B |
|
||
| Hotels | 1 | $24B |
|
||
| Consumer Goods | 1 | $7B |
|
||
| Real Estate | 1 | $6B |
|
||
| Chemicals | 1 | $2B |
|
||
Price history
+899.5% since first listed15 events — show timeline
- 2026-06-02 Pending — BRIGHT MLS
- 2026-05-19 Contingent — BRIGHT MLS
- 2026-05-11 Listed $199,900 BRIGHT MLS
- 2007-07-26 Sold (Public Records) $205,500 Public Records
- 2007-05-05 Delisted — MRIS
- 2006-10-11 Listed — MRIS
- 2004-09-13 Sold (Public Records) $42,000 Public Records
- 2004-09-09 Sold (MLS) $42,000 MRIS
- 2004-08-19 Delisted — MRIS
- 2004-08-10 Listed $40,000 MRIS
- 2002-03-08 Delisted — MRIS
- 2001-03-26 Listed — MRIS
- 1999-02-06 Delisted — MRIS
- 1998-02-06 Listed — MRIS
- 1994-08-24 Sold (Public Records) $20,000 Public Records
Property tax history
+1.5%/yrLatest (2025): $2,080 · +12.7% YoY. Source: county tax records.
Cash-flow waterfall
monthlySold comps — $/sqft
last 12 mo · ≤1 miLoading sold comps…