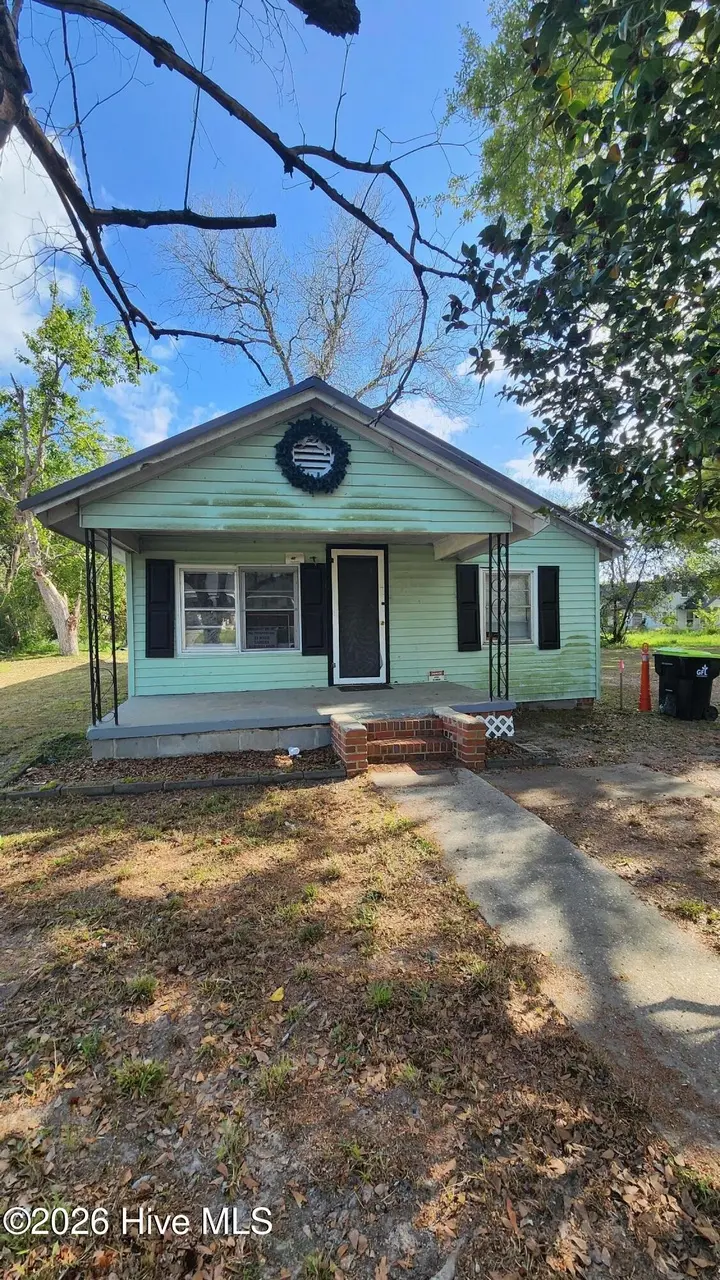
407 W Lewis St · Whiteville, NC
Flood risk No data
- FEMA flood zone
- —
- Chance of flooding over 30 yrs
- —
- Est. flood insurance / yr
- —
Fire risk No data
- Est. fire insurance / yr
- —
Heat risk No data
- Hot days now (above threshold)
- —
- Hot days in 30 yrs
- —
Wind risk No data
- Chance of severe wind over 30 yrs
- —
Air-quality risk No data
- Unhealthy air days now
- —
- Unhealthy air days in 30 yrs
- —
Risk factors via First Street. Map © Google.
Why this score? — see what drove the B- grade
The composite is a weighted blend of 9 inputs, each scored 0–100. Each bar is that input's sub-score; the figure is the points it added to the 100-point composite (weight × sub-score).
- Cash flow +30.0/30.0
- 1% rule +10.0/10.0
- DSCR +10.0/10.0
- ARV discount +7.5/15.0
- Schools +3.9/10.0
- Livability +3.2/5.0
- Rent growth +2.5/5.0
- Condition / age +2.5/5.0
- Appreciation +0.0/10.0
$55,000
🖨 Deal sheet (PDF) 📄 Offer letter ✓ Due diligence
Listing remarks
Investor special in Whiteville! This 3-bedroom, 1-bath home offers 864 square feet of potential and is ready for your next project. With solid bones and a functional layout, this property presents an excellent opportunity for renovation and value-add improvements. The home is in need of new flooring throughout, making it a great candidate for customization and upgrades to suit your investment strategy. Conveniently located near Central Middle School, this property provides easy access to local amenities, schools, and town conveniences. Whether you're looking to add to your rental portfolio or complete a fix-and-hold project, this property has strong income potential once improvements are co
Key facts
- 0.23 acre lot
- Built 1950
- Listed 74 days
Property features AI
Finance
- Other: Zoning: R6; Lot approximately 0.23 acres (50 x 200); Road frontage on city street and state road; Directions: From US 74 travel south on US 701 to Lewis Street. Turn right, the house is on the left.
- Financial info: Information not provided
- HOA & community: Not in a subdivision
Exterior
- Parking: No garage
- Security: Information not provided
- Utilities: Public sewer; Water connected; Sewer connected
- Home design: Single-family residence; One story
- Construction: Vinyl siding and frame construction; Block foundation; Built on one level
- Exterior features: Front porch; No fencing; Metal roof
Interior
- Kitchen: Information not provided
- Bedrooms: Information not provided
- Flooring: Information not provided
- Bathrooms: 1 full bathroom
- Heating & cooling: Wall/window unit cooling; No central heating
- Interior features: 6 total rooms; Has a view
- Laundry & utility: Information not provided
Neighborhood map
What this means for you Summary
Snapshot
- This is a 3-bed/2.0-bath single-family listed at $55k.
Deal economics
- At list price, monthly cash flow is $457 ($5k/yr) — positive.
- The deal already cash-flows at list — no discount required.
- Meets the 1% rule at list price ($1k rent vs $55k).
- Recommended offer: $52k (6.0% below list) — sets the bar for market timing.
- Cap rate 16.3% vs local median 4.2% in Whiteville — top-decile yield for the area; either an underpriced asset or a hidden risk that comps aren't pricing in. Stress-test before assuming the spread holds.
Location & tenants
- Location reads 64/100 on livability (#361 in NC) — a middle-class / working-renter tenant base. Strengths: cost of living A+, health & safety A+, housing B+; Watch: crime F, amenities F, commute F.
- Whiteville City Schools (town): math 49% / reading 46% proficiency, ranked #81 of 178 in NC (top 46%) — families likely to look elsewhere, expect single-tenant / working-renter base with shorter leases; 74% free/reduced lunch — lower-income household profile, screen leases tightly.
- Zoned schools: Whiteville Primary (501 students, 99% FRL); Central Middle (math 46% / reading 45%, grade D+, #154 of 475 statewide, top 33%, 462 students, 99% FRL); Whiteville High (math 57% / reading 57%, grade C, #248 of 535 statewide, top 48%, 662 students, 99% FRL) — zoned schools average 99% FRL vs 74% district-wide (25 pts higher); higher-poverty schools than district average — tighter screening recommended.
- Market conditions: 114 active listings in the ZIP; 1 comparable units currently listed for rent nearby; 24 units permitted in Columbus County in 2024 (0 in 5+ unit buildings).
Forward outlook
- Local home prices are declining (-3.0%/yr); year-one equity from $380 of loan paydown is wiped out by about $2k of value loss. Plan a longer hold.
- Columbus County population projected at -19% by 2050 — secular population decline; favor cash flow + early exit over multi-decade hold.
- At projected returns (-3.0% appreciation + 3.0% rent growth), your $15k cash investment doubles in ~4 years — after that, you're playing with house money.
Negotiation context
- It's been on market 74 days — a 6% lower offer ($52k) is reasonable based on typical stale-listing flexibility.
Risks & watch-outs
- Watch-outs: built in 1950 — expect roof / HVAC / electrical / plumbing capex.
Questions for the listing agent
- It's been on market 74 days. Have you received any prior offers? Is the seller open to a 6% concession, seller financing, or rate buy-down credit?
- Built in 1950 — when were the roof, HVAC, electrical panel, plumbing, and water heater last replaced?
- Why hasn't it sold? Are there any deal-killer items the seller is aware of (foundation, flood, title, zoning, code violations)?
- Is there a deadline driving the sale (1031 exchange, divorce, estate, relocation)? That informs how much negotiation room exists.
- Crime grade is F in this area — have there been break-ins, vandalism, or insurance claims at this property in the last 3 years? What carrier currently insures it and at what premium?
- What's the average days-on-market for RENTAL listings here right now (not sales)? A rising rental-DOM trend means longer vacancies and softer asking-rent achievability than the comps imply.
- What's the recent tenant-quality profile in this submarket — average credit score on applications, eviction rate, late-payment / NSF rate, and stable-employment percentage? A property-management company in the area should have these aggregated.
- How much new for-sale + rental construction is in the pipeline within 1–3 miles? Heavy new supply typically softens prices + rents 12–24 months out; constrained supply supports both.
Investment metrics
- 1% rule
- 1.82% ✓
- Cap rate
- 16.27%
- Cash-on-cash
- 35.63%
- DSCR
- 2.59
- GRM
- 4.6
CMA / ARV
- ARV (on-the-fly)
- $134,784
- Comps found
- 7
Show comp detail 7 sales within ~0.75 mi
| Address | Dist | Beds/Ba | Sqft | Sold | Price | $/sf | Match |
|---|---|---|---|---|---|---|---|
| 430 W W. Virgil St | 0.29mi | 3/1.0 | 937 (+8%) | 6mo | $45,000 | $48 | 63 |
| 107 W Williamson St | 0.39mi | 2/1.0 (-1) | 906 (+5%) | 19mo | $141,500 | $156 | 49 |
| 229 E Calhoun St | 0.68mi | 2/1.0 (-1) | 900 (+4%) | 12mo | $145,000 | $161 | 43 |
| 205 N Thompson St | 0.68mi | 2/1.0 (-1) | 900 (+4%) | 16mo | $65,000 | $72 | 40 |
| 223 E Columbus St | 0.67mi | 2/1.0 (-1) | 812 (-6%) | 16mo | $50,000 | $62 | 37 |
| 115 E Wyche St | 0.69mi | 3/1.0 | 966 (+12%) | 14mo | $180,000 | $186 | 33 |
| 222 E Calhoun St | 0.64mi | 2/1.0 (-1) | 924 (+7%) | 22mo | $157,000 | $170 | 31 |
Match score weights: distance 35% · size 25% · config 20% · recency 20%. Top-matched comps best support the ARV.
Projected returns pro-forma
-3.0% appreciation · 3.0% rent growth · sell at horizon
- IRR
- 31.3%
- Equity multiple
- 2.31×
- Total profit
- $20,194
- Equity at exit
- $8,201
- IRR
- 38.4%
- Equity multiple
- 4.57×
- Total profit
- $55,025
- Equity at exit
- $4,755
Cash invested: $15,400 (down + closing). Projections, not guarantees.
Landlord ↔ Tenant lean methodology
- Overall (STATE)
- 85 Strongly Landlord-Friendly
- State North Carolina
- 85 Strongly Landlord-Friendly · R+3
- County
- — inherits STATE
- City
- — inherits STATE
ZIP-level market 28472
- Home prices YoY
- -5.2%
- Active inventory
- 114
- Price-to-rent
- 4.6×
Monthly cashflow live
- Estimated rent
- $1,000 medium interval (Pro) →
- Mortgage (P&I)
- −$288
- Tax from tax record
- −$21 /mo · $257/yr
- Insurance
- −$23
- HOA
- −$0
- Vacancy / Maint / Mgmt
- −$210
- Net cashflow
- $457
Break-even live
Sensitivity live
| Price | -10% $488 | -5% $473 | +0% $457 | +5% $442 | +10% $426 |
|---|---|---|---|---|---|
| Rent | -10% $378 | -5% $418 | +0% $457 | +5% $497 | +10% $536 |
| Rate | -1.0pp $485 | -0.5pp $471 | base $457 | +0.5pp $443 | +1.0pp $428 |
UW: 25.0% down · 7.5% · 30yr · 1.5% tax · 5.0% vac · 8.0% maint · 8.0% mgmt
Financing live
Cash to close
- Down payment
- $13,750
- Closing costs
- $1,650
- Reserves months
- —
- Total cash needed
- —
Loan-product check · same deal, 3 products live
Conventional
25% down · 7.5% · 30yr
- Down + closing
- —
- Monthly P&I
- —
- Monthly cashflow
- —
- DSCR
- —
- Eligible?
- —
Personal DTI + credit; lowest rate.
DSCR
20% down · 8.5% · 30yr
- Down + closing
- —
- Monthly P&I
- —
- Monthly cashflow
- —
- DSCR
- —
- Eligible?
- —
No personal income docs; deal must DSCR.
Hard money
10% down · 12.0% · 12mo
- Down + closing
- —
- Monthly P&I
- —
- Monthly cashflow
- —
- DSCR
- —
- Eligible?
- —
Short-term bridge; refi at stabilization.
Rent comps 1 comps
| Address | Beds | Baths | Sqft | Rent | $/sqft | DOM | Units | Dist |
|---|---|---|---|---|---|---|---|---|
| 207 W Calhoun St Unit 1st Whiteville, NC | 2.0 | 1.0 | 640 | $1,000 | $1.56 | 14d | 1 | 0.23mi |
Listing history 16 events
-
2026-06-21days on market $55,000 Active 74 DOM
-
2026-06-18days on market $55,000 Active 72 DOM
-
2026-06-17days on market $55,000 Active 71 DOM
-
2026-06-16days on market $55,000 Active 70 DOM
-
2026-06-15days on market $55,000 Active 69 DOM
-
2026-06-13days on market $55,000 Active 67 DOM
-
2026-06-12days on market $55,000 Active 66 DOM
-
2026-06-09days on market $55,000 Active 63 DOM
-
2026-06-08days on market $55,000 Active 62 DOM
-
2026-06-07days on market $55,000 Active 61 DOM
-
2026-06-07days on market $55,000 Active 60 DOM
-
2026-06-04days on market $55,000 Active 57 DOM
-
2026-06-02days on market $55,000 Active 56 DOM
-
2026-06-01days on market $55,000 Active 55 DOM
-
2026-05-31days on market $55,000 Active 54 DOM
-
2026-04-07$55,000 Active
ⓘ Source: listings_history table (triggers on properties + properties_extension) + one-shot
backfill from property_details.listing_events for pre-trigger history.
Tax reassessment forecast NC · Resets to sale price
- Current annual tax
- $257 · $21/mo
- Projected year-2 tax
- $451 · $38/mo
- Expected delta
- +$194/yr (+$16/mo · 75.3%)
ⓘ Screening estimate from a state-policy table — verify with the county assessor before closing.
Nearby sold comps map
Loading sold comps map…
Walkable amenities ~0.75 mi
Loading nearby amenities…
Taxation est. · year 1
- Rental income
- $12,000
- − Mortgage interest
- −$3,081
- − Property taxes
- −$257
- − Insurance
- −$275
- − Repairs & maintenance
- −$960
- − Management
- −$960
- − Depreciation
- −$1,600
- Taxable income
- $4,867
- Est. tax owed @ 24.0%
- −$1,168
- After-tax cash flow
- $4,319/yr
For passive investors: Depreciation is non-cash, so a rental often shows a tax loss while cash-flowing — sheltering income. Rental losses are passive: they offset passive income freely, and up to $25,000/yr can offset ordinary (W-2) income if you actively participate and your MAGI is under $100k (phasing out to $0 by $150k); unused losses carry forward. On sale, claimed depreciation is recaptured at up to 25%, and gains may owe capital-gains tax (a 1031 exchange can defer both). Figures are a year-1 estimate at your 24.0% rate — not tax advice; consult a CPA.
Schools (NCES district)
- District
- Whiteville City Schools
- NCES district ID
- 3704920
- Math proficiency
- 49% ▲ 7.00%
- Reading proficiency
- 46% ▬ 0.00%
- Median HH income
- $34,751
- Composite
- 39.27/100
- National rank
- #3999
- State rank
- #81 of 178 in NC
Livability — Whiteville
- Score
- 64/100
- State rank
- #361
- US rank
- #14254
Category grades
Schools grade is shown separately in the Schools card above.
Census & demographics
- Census place
- Whiteville, NC
- Population (ZIP)
- 17,833
Population outlook (Columbus County) Hauer SSP2
- Today (2025)
- 54,250 people
- By 2030
- 52,378 · -3.5%
- By 2040
- 48,226 · -11.1%
- By 2050
- 44,103 · -18.7%
- By 2075
- 35,271 · -35.0%
- By 2100
- 26,909 · -50.4%
Race, ethnicity, and origin ACS 2023
- Neighborhood character
- Diverse neighborhood (Simpson 0.55)
- Race & ethnicity
- White 59% Black 32% Hispanic / Latino 4% Two or more races 3% Native American 2%
- Common ancestry
- Serbian 1% Slovak 1% Romanian 1%
- Foreign-born
- 3% · Canada
- Languages at home
- 94% English-only · Spanish 5%
Political lean MEDSL · Columbus
- 2024 margin
- Solid R (+33.9) · D 32.8% · R 66.7%
- 2008→2024 swing
- -26.0pp toward R · 2008: -7.9pp · 2024: -33.9pp
- All cycles
- 2024: R+33.9 2020: R+27.9 2016: R+22.1 2012: R+7.9 2008: R+7.9
Not yet ingested
- Civics
- —
Market trends
- HPI YoY
- ▼ -13.72%
- Current HPI
- 252.022
- Rent YoY
- —
- Metro
- —
- State GDP YoY
- ▲ 3.28%
- F500 in state
- 26
Industry mix (Fortune 500 HQ in NC)
| Industry | F500 HQs | Revenue |
|---|---|---|
| Financial Services | 2 | $213B |
|
||
| Retail | 2 | $95B |
|
||
| Industrial Conglomerate | 1 | $38B |
|
||
| Metals / Steel | 1 | $35B |
|
||
| Utilities | 1 | $30B |
|
||
| Industrial Machinery | 1 | $19B |
|
||
Price history
1 event — show timeline
- 2026-04-07 Listed $55,000 Hive MLS
Property tax history
-8.0%/yrLatest (2025): $257 · -1.0% YoY. Source: county tax records.
Cash-flow waterfall
monthlySold comps — $/sqft
last 12 mo · ≤1 miLoading sold comps…