1339 5th Ave N · Naples, FL
Flood risk 9/10 · Severe
- FEMA flood zone
- AE
- Chance of flooding over 30 yrs
- 0.99%
- Est. flood insurance / yr
- $1,737 – $8,500
Fire risk 1/10 · Minimal
- Est. fire insurance / yr
- $947 – $1,759
Heat risk 10/10 · Severe
- Hot days now (above 107°F)
- 7 days/yr
- Hot days in 30 yrs
- 27 days/yr
Wind risk 10/10 · Severe
- Chance of severe wind over 30 yrs
- 99.0%
Air-quality risk 2/10 · Minimal
- Unhealthy air days now
- 2 days/yr
- Unhealthy air days in 30 yrs
- 2 days/yr
Risk factors via First Street. Map © Google.
Why this score? — see what drove the B+ grade
The composite is a weighted blend of 9 inputs, each scored 0–100. Each bar is that input's sub-score; the figure is the points it added to the 100-point composite (weight × sub-score).
- Cash flow +30.0/30.0
- DSCR +10.0/10.0
- 1% rule +8.2/10.0
- ARV discount +7.5/15.0
- Appreciation +7.0/10.0
- Schools +5.0/10.0
- Rent growth +4.7/5.0
- Livability +4.0/5.0
- Condition / age +2.5/5.0
$569,900
🖨 Deal sheet 📄 Offer letter ✓ Due diligence
Listing remarks
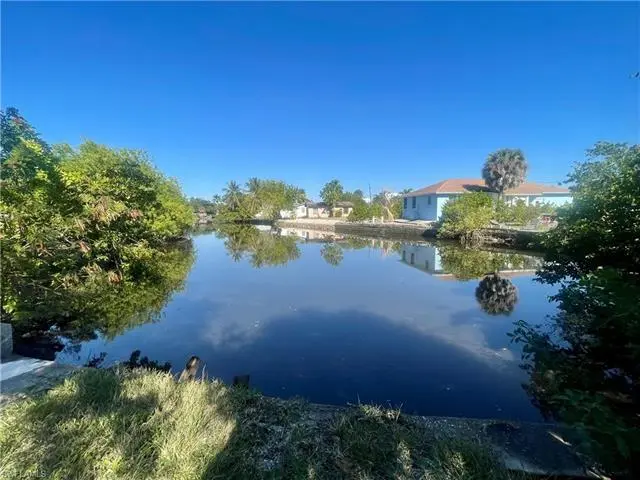
Waterfront!!! Highly Desirable Beginning of the Canal Location!!! Investment!!! Income Property!!! Downtown Naples!!! Potential two Apartments!!! New Roof!!! 4 bedrooms, 1 bathroom, split 3/1 and 1 bedroom with bathroom potential for separate Duplex Apartment attached, 1559 SqFt waterfront home perfectly located in River Park on a large canal waterfront that flows directly into the Gordon River. The Gordon River flows into Naples Bay, and from there out to the Gordon Pass. Travel approximately 7 miles downstream and you'll enter the Gulf. This home is brimming with charm and modern updates, ready to offer the quintessential Florida lifestyle. Step inside to find new flooring that enhances t
Key facts
- Canal
- Downtown naples
- Income property
Tags
Property features AI
Finance
- Other: Property type: Residential; Located in the River Park development; Lot is on a cul-de-sac / dead end; Canal waterfront with private boat dock and gulf access via bridges (canal width 121–150); Lot dimensions approximately 55 x 120 (total area reported)
- Financial info: Details not provided
- HOA & community: Community supports boating; HOA maintenance includes cable; Neighborhood amenities include sidewalks and streetlights
Exterior
- Parking: Details not provided
- Security: Details not provided
- Utilities: Central water; Central sewer; Cable available
- Home design: Single-family residence; 1 story / ranch; Rear exposure faces north
- Construction: Concrete block construction; Metal roof; Built in 1962
- Exterior features: Extra building on property; Stucco exterior; Double-hung windows; Storm protection (see remarks)
Interior
- Kitchen: Cooktop (electric); Range; Microwave; Dishwasher; Disposal; Refrigerator/Freezer; Ice maker (standalone); Freezer
- Bedrooms: 4 bedrooms
- Flooring: Vinyl flooring
- Bathrooms: 1 full bathroom; Master bath with separate tub and shower
- Heating & cooling: Central electric heating; Central electric cooling
- Interior features: High speed internet available; Eat-in kitchen; Split bedroom floor plan; See remarks for additional interior details
- Laundry & utility: Washer; Dryer
Neighborhood map
What this means for you Summary
Snapshot
- This is a 4-bed/1.0-bath single-family listed at $570k.
Deal economics
- At list price, monthly cash flow is $2k ($23k/yr) — positive.
- The deal already cash-flows at list — no discount required.
- Meets the 1% rule at list price ($8k rent vs $570k).
- Recommended offer: $502k (12.0% below list) — sets the bar for market timing.
Location & tenants
- Location reads 80/100 on livability (#126 in FL, #1,903 nationally) — a professional / high-income tenant draw. Strengths: crime A+, amenities A+, employment A+; Watch: commute D+, cost of living F.
- Collier (suburban): math 60% / reading 56% proficiency, ranked #16 of 73 in FL (top 22%) — acceptable for families but not a draw, mixed tenant base, ~2y average lease.
- Market conditions: Rents rising fast (+8.8%/yr); 614 active listings in the ZIP; 20 comparable units currently listed for rent nearby; rentals at typical pace (median 24d on market — plan ~3-4 weeks tenant-placement turnaround); high-income renter base; 3,520 units permitted in Collier County in 2024 (959 in 5+ unit buildings).
- At $7,512/mo this rent would consume 69% of the median local household income ($131k/yr) (locally 333% of renters already pay >50% of income on rent) — very limited rent-growth headroom before tenants either downsize or default.
Forward outlook
- In year one you build about $27k of equity ($4k loan paydown + $23k appreciation (4.1% local appreciation)).
- Collier County population projected at +30% by 2050 — long-run rental-demand tailwind backs the buy-and-hold thesis.
- At projected returns (4.1% appreciation + 8.0% rent growth), your $160k cash investment doubles in ~3 years — after that, you're playing with house money.
- By year 2, paydown + projected appreciation supports a ~$44k cash-out refi (75% LTV) — recoverable capital for the next deal without selling this one.
Negotiation context
- It's been on market 180 days — a 12% lower offer ($502k) is reasonable based on typical stale-listing flexibility.
Risks & watch-outs
- Watch-outs: flood insurance adds $427/mo.
- Climate carrying-cost: in FEMA flood zone AE (mandatory federal flood insurance); severe wind risk, 99% chance of damaging wind over 30y; extreme-heat days projected 7→27/yr by 2055 (HVAC capex compounding) — expect insurance premiums to compound above CPI over the hold.
Questions for the listing agent
- It's been on market 180 days. Have you received any prior offers? Is the seller open to a 12% concession, seller financing, or rate buy-down credit?
- Built in 1962 — when were the roof, HVAC, electrical panel, plumbing, and water heater last replaced?
- What's the actual annual flood-insurance premium (NFIP or private), and is the property in a SFHA with mandatory coverage?
- Why hasn't it sold? Are there any deal-killer items the seller is aware of (foundation, flood, title, zoning, code violations)?
- Is there a deadline driving the sale (1031 exchange, divorce, estate, relocation)? That informs how much negotiation room exists.
- Schools are B-rated — typically a magnet for longer-tenancy family renters. What's the average tenant stay here, and is there a school-zone premium baked into asking?
- What's the average days-on-market for RENTAL listings here right now (not sales)? A rising rental-DOM trend means longer vacancies and softer asking-rent achievability than the comps imply.
- What's the recent tenant-quality profile in this submarket — average credit score on applications, eviction rate, late-payment / NSF rate, and stable-employment percentage? A property-management company in the area should have these aggregated.
- How much new for-sale + rental construction is in the pipeline within 1–3 miles? Heavy new supply typically softens prices + rents 12–24 months out; constrained supply supports both.
Investment metrics
- 1% rule
- 1.32% ✓
- Cap rate
- 11.29%
- Cash-on-cash
- 17.84%
- DSCR
- 1.79
- GRM
- 6.3
CMA / ARV
No comps found within radius.
Projected returns pro-forma
4.08% appreciation · 8.0% rent growth · sell at horizon
- IRR
- 26.9%
- Equity multiple
- 2.67×
- Total profit
- $265,770
- Equity at exit
- $291,733
- IRR
- 29.1%
- Equity multiple
- 6.06×
- Total profit
- $807,345
- Equity at exit
- $479,389
Cash invested: $159,572 (down + closing). Projections, not guarantees.
Landlord ↔ Tenant lean methodology
- Overall (STATE)
- 87 Strongly Landlord-Friendly
- State Florida
- 87 Strongly Landlord-Friendly · R+3
- County
- — inherits STATE
- City
- — inherits STATE
ZIP-level market 34102
- Home prices YoY
- 1.3%
- Rents YoY
- 8.8%
- Active inventory
- 614
- Price-to-rent
- 6.3×
Monthly cashflow live
- Estimated rent
- $7,512 medium interval (Pro) →
- Mortgage (P&I)
- −$2,989
- Tax from tax record
- −$337 /mo · $4,039/yr
- Insurance
- −$237
- Flood insurance flood zone
- −$427 /mo · $5,118/yr
- HOA
- −$0
- Vacancy / Maint / Mgmt
- −$1,578
- Net cashflow
- $1,946
Break-even live
UW: 25.0% down · 7.5% · 30yr · 1.5% tax · 5.0% vac · 8.0% maint · 8.0% mgmt
Financing live
Cash to close
- Down payment
- $142,475
- Closing costs
- $17,097
- Reserves months
- —
- Total cash needed
- —
Loan-product check · same deal, 3 products live
Conventional
25% down · 7.5% · 30yr
- Down + closing
- —
- Monthly P&I
- —
- Monthly cashflow
- —
- DSCR
- —
- Eligible?
- —
Personal DTI + credit; lowest rate.
DSCR
20% down · 8.5% · 30yr
- Down + closing
- —
- Monthly P&I
- —
- Monthly cashflow
- —
- DSCR
- —
- Eligible?
- —
No personal income docs; deal must DSCR.
Hard money
10% down · 12.0% · 12mo
- Down + closing
- —
- Monthly P&I
- —
- Monthly cashflow
- —
- DSCR
- —
- Eligible?
- —
Short-term bridge; refi at stabilization.
Rent comps 20 comps
| Address | Beds | Baths | Sqft | Rent | $/sqft | DOM | Units | Dist |
|---|---|---|---|---|---|---|---|---|
| 714 11th St N Naples, FL | 3.0 | 2.0 | 1183 | $9,500 | $8.03 | 23d | 1 | 0.39mi |
| 982 13th St N Naples, FL | 3.0 | 2.5 | 1204 | $8,000 | $6.64 | 23d | 1 | 0.48mi |
| 1111 Central Ave Naples, FL | 2.0–3.0 | 2.0–3.5 | 1627 | $17,000 | $10.45 | 23d | 4 | 0.49mi |
| 905 13th St N Naples, FL | 3.0 | 2.0 | 1292 | $8,000 | $6.19 | 23d | 1 | 0.49mi |
| 981 8th Ter N Naples, FL | 3.0 | 2.0 | 1200 | $8,500 | $7.08 | 23d | 1 | 0.51mi |
| 850 Central Ave Naples, FL | 2.0–3.0 | 2.0–3.0 | 1530 | $18,000 | $11.76 | 14d | 4 | 0.66mi |
| 410 Bayfront Pl Naples, FL | 1.0–3.0 | 1.0–2.0 | 1242 | $9,750 | $7.85 | 23d | 6 | 0.69mi |
| 1236 13th Ave N Naples, FL | 3.0 | 2.0 | 1461 | $14,500 | $9.92 | 23d | 1 | 0.71mi |
| 766 Central Ave Naples, FL | 2.0–3.0 | 2.0 | 855 | $6,500 | $7.60 | 21d | 3 | 0.72mi |
| 766 Central Ave Naples, FL | 2.0–3.0 | 2.0 | 943 | $6,500 | $6.89 | 13d | 4 | 0.72mi |
| 450 Bayfront Pl Naples, FL | 1.0–3.0 | 1.0–2.5 | 1324 | $12,000 | $9.06 | 23d | 6 | 0.72mi |
| 1030 3rd Ave S Naples, FL | 2.0–3.0 | 2.0–3.5 | 2101 | $18,000 | $8.57 | 23d | 4 | 0.76mi |
| 469 3rd Ave N Naples, FL | 3.0 | 2.0 | 1400 | $6,900 | $4.93 | 23d | 1 | 0.86mi |
| 361 1st Ave N Naples, FL | 3.0 | 3.0 | 1500 | $16,000 | $10.67 | 23d | 1 | 0.98mi |
| 116 3rd St N Naples, FL | 3.0 | 2.5 | 1400 | $14,000 | $10.00 | 23d | 1 | 1.02mi |
| 2047 Harbor Ln Naples, FL | 3.0 | 2.0 | 1382 | $7,500 | $5.43 | 21d | 1 | 1.09mi |
| 1320 Embassy Ln Naples, FL | 3.0 | 2.0 | 1251 | $3,300 | $2.64 | 14d | 1 | 1.22mi |
| 1950 Mayfair St Naples, FL | 3.0 | 1.0–3.5 | 1514 | $11,999 | $7.92 | 14d | 109 | 1.25mi |
| 1120 Little Neck Ct Unit E40 Naples, FL | 3.0 | 2.0 | 1400 | $2,999 | $2.14 | 23d | 1 | 1.36mi |
| 1155 6th St S Naples, FL | 3.0 | 2.0 | 1384 | $16,000 | $11.56 | 23d | 1 | 1.47mi |
Listing history 15 events
-
2026-06-18days on market $569,900 Active 180 DOM
-
2026-06-17days on market $569,900 Active 179 DOM
-
2026-06-16days on market $569,900 Active 178 DOM
-
2026-06-15days on market $569,900 Active 177 DOM
-
2026-06-10days on market $569,900 Active 172 DOM
-
2026-06-09days on market $569,900 Active 171 DOM
-
2026-06-08days on market $569,900 Active 170 DOM
-
2026-06-07days on market $569,900 Active 169 DOM
-
2026-06-03days on market $569,900 Active 165 DOM
-
2026-06-02days on market $569,900 Active 164 DOM
-
2026-06-01days on market $569,900 Active 163 DOM
-
2026-05-31days on market $569,900 Active 162 DOM
-
2026-05-30days on market $569,900 Active 161 DOM
-
2026-05-22price $569,900
-
2025-12-20$585,000 Active
ⓘ Source: listings_history table (triggers on properties + properties_extension) + one-shot
backfill from property_details.listing_events for pre-trigger history.
Tax reassessment forecast FL · Resets to sale price
- Current annual tax
- $4,039 · $337/mo
- Projected year-2 tax
- $4,730 · $394/mo
- Expected delta
- +$692/yr (+$58/mo · 17.1%)
ⓘ Screening estimate from a state-policy table — verify with the county assessor before closing.
Climate risk First Street
- Flood 9/10 Extreme FEMA zone AE · 99% chance over 30 yrs
- Wildfire 1/10 Low
- Heat 10/10 Extreme 7 d/yr ≥107°F today · 27 d/yr by 30 yrs out
- Wind 10/10 Extreme 99% chance of damaging wind over 30 yrs
- Air quality 2/10 Low 2 unhealthy d/yr today · 2 by 30 yrs out
Nearby sold comps map
Loading sold comps map…
Walkable amenities ~0.75 mi
Loading nearby amenities…
Taxation est. · year 1
- Rental income
- $90,149
- − Mortgage interest
- −$31,923
- − Property taxes
- −$4,039
- − Insurance
- −$7,968
- − Repairs & maintenance
- −$7,212
- − Management
- −$7,212
- − Depreciation
- −$16,579
- Taxable income
- $15,216
- Est. tax owed @ 24.0%
- −$3,652
- After-tax cash flow
- $19,696/yr
For passive investors: Depreciation is non-cash, so a rental often shows a tax loss while cash-flowing — sheltering income. Rental losses are passive: they offset passive income freely, and up to $25,000/yr can offset ordinary (W-2) income if you actively participate and your MAGI is under $100k (phasing out to $0 by $150k); unused losses carry forward. On sale, claimed depreciation is recaptured at up to 25%, and gains may owe capital-gains tax (a 1031 exchange can defer both). Figures are a year-1 estimate at your 24.0% rate — not tax advice; consult a CPA.
Schools (NCES district)
- District
- Collier
- NCES district ID
- 1200330
- Math proficiency
- 60% ▼ -4.00%
- Reading proficiency
- 56% ▼ -2.00%
- Median HH income
- $58,275
- Composite
- 50.23/100
- National rank
- #1892
- State rank
- #16 of 73 in FL
Livability — Naples
- Score
- 80/100
- State rank
- #126
- US rank
- #1903
Category grades
Schools grade is shown separately in the Schools card above.
Census & demographics
- Census place
- Naples, FL
- County
- Collier County · 396,295 people
- City population
- 344,941
- Metro
- Naples-Marco Island, FL
- Population (ZIP)
- 11,179
- Household income
- $130,929
- Rent vs Own
- Severe rent burden
- 333.0
Population outlook (Collier County) Hauer SSP2
- Today (2025)
- 420,858 people
- By 2030
- 450,054 · +6.9%
- By 2040
- 502,232 · +19.3%
- By 2050
- 544,932 · +29.5%
- By 2075
- 627,203 · +49.0%
- By 2100
- 659,015 · +56.6%
Race, ethnicity, and origin ACS 2023
- Neighborhood character
- Predominantly White (79%)
- Race & ethnicity
- White 79% Hispanic / Latino 9% Two or more races 8% Black 8% Asian 1%
- Hispanic origin (detail)
- Cuban 6%
- Common ancestry
- Hispanic 4% Lithuanian 4% Romanian 4%
- Foreign-born
- 17% · Canada, China
- Languages at home
- 87% English-only · Spanish 7% French/Haitian/Cajun 4% German/W. Germanic 1%
Political lean MEDSL · Collier
- 2024 margin
- Solid R (+33.1) · D 33.1% · R 66.2%
- 2008→2024 swing
- -10.6pp toward R · 2008: -22.5pp · 2024: -33.1pp
- All cycles
- 2024: R+33.1 2020: R+24.7 2016: R+26.0 2012: R+30.1 2008: R+22.5
Not yet ingested
- Civics
- —
Market trends
- HPI YoY
- ▲ 4.08%
- Current HPI
- 328.2755
- Rent YoY
- ▲ 8.75%
- Metro
- Naples-Marco Island, FL
- State GDP YoY
- ▲ 3.28%
- F500 in state
- 36
Industry mix (Fortune 500 HQ in FL)
| Industry | F500 HQs | Revenue |
|---|---|---|
| Industrial Technology | 2 | $29B |
|
||
| Insurance | 2 | $17B |
|
||
| Retail | 1 | $60B |
|
||
| Technology Distribution | 1 | $58B |
|
||
| Homebuilding | 1 | $35B |
|
||
| Technology Manufacturing | 1 | $35B |
|
||
Price history
-2.6% since first listed2 events — show timeline
- 2026-05-22 Price Changed $569,900 NAPLESMLS
- 2025-12-20 Listed $585,000 NAPLESMLS
Property tax history
+29.4%/yrLatest (2025): $4,039 · +29.5% YoY. Source: county tax records.
Cash-flow waterfall
monthlySold comps — $/sqft
last 12 mo · ≤1 miLoading sold comps…