1611 Co Rd 50 · Plainview, TX
Flood risk 1/10 · Minimal
- FEMA flood zone
- X
- Chance of flooding over 30 yrs
- 0.0%
- Est. flood insurance / yr
- $435 – $905
Fire risk 2/10 · Minimal
- Est. fire insurance / yr
- $1,222 – $2,270
Heat risk 5/10 · Moderate
- Hot days now (above threshold)
- 7 days/yr
- Hot days in 30 yrs
- 21 days/yr
Wind risk No data
- Chance of severe wind over 30 yrs
- —
Air-quality risk No data
- Unhealthy air days now
- —
- Unhealthy air days in 30 yrs
- —
Risk factors via First Street. Map © Google.
Why this score? — see what drove the B- grade
The composite is a weighted blend of 9 inputs, each scored 0–100. Each bar is that input's sub-score; the figure is the points it added to the 100-point composite (weight × sub-score).
- Cash flow +30.0/30.0
- 1% rule +10.0/10.0
- DSCR +10.0/10.0
- ARV discount +7.5/15.0
- Livability +3.5/5.0
- Schools +3.3/10.0
- Rent growth +2.5/5.0
- Condition / age +2.2/5.0
- Appreciation +0.0/10.0
$75,000
🖨 Deal sheet 📄 Offer letter ✓ Due diligence
Listing remarks MLS
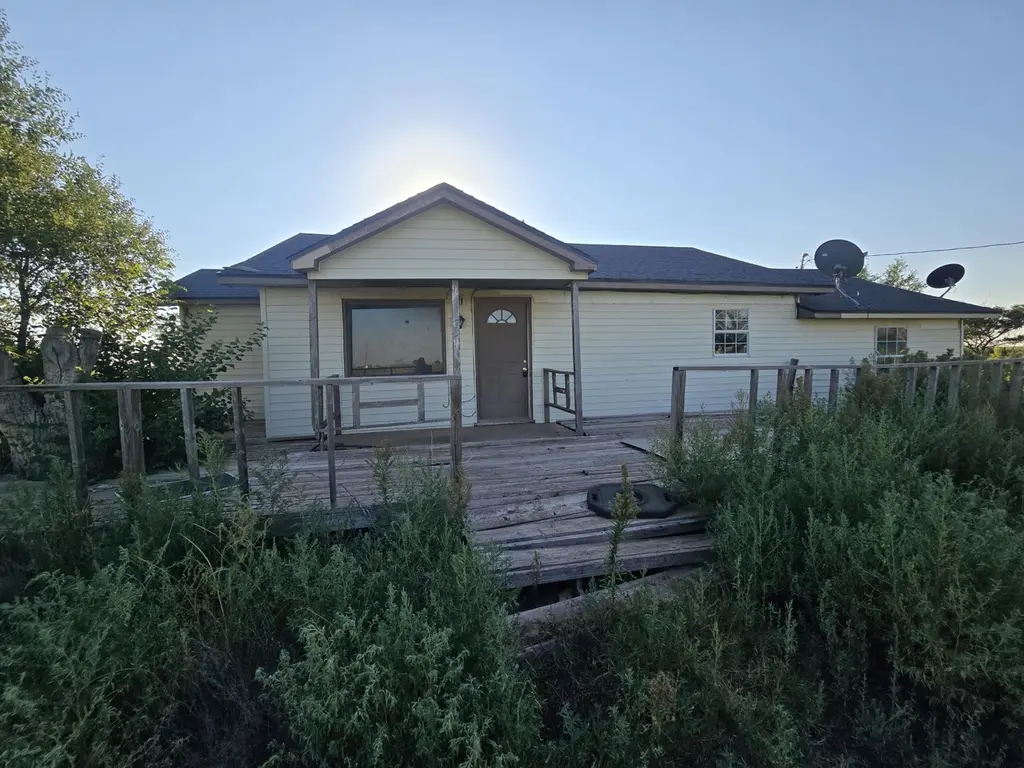
Investment opportunity with land. If you have the vision this 3 bed 2 bath home with basement is a fantastic option. Can be sold as part of a package deal or individually.
Key facts
- Basement
- 1.5 acre lot
- Listed 266 days
Tags
Neighborhood map
What this means for you Summary
Snapshot
- This is a 3-bed/2.0-bath single-family listed at $75k. Condition is rated fair.
Deal economics
- At list price, monthly cash flow is $463 ($6k/yr) — positive.
- The deal already cash-flows at list — no discount required.
- Meets the 1% rule at list price ($1k rent vs $75k).
- Recommended offer: $66k (12.0% below list) — sets the bar for market timing.
Location & tenants
- Location reads 69/100 on livability (#393 in TX) — a middle-class / working-renter tenant base. Strengths: cost of living A+, housing A+; Watch: schools C-, crime C-, health & safety C-.
- Plainview ISD (town): math 41% / reading 37% proficiency, ranked #445 of 826 in TX (top 54%) — families likely to look elsewhere, expect single-tenant / working-renter base with shorter leases; 69% free/reduced lunch — lower-income household profile, screen leases tightly.
- Market conditions: 150 active listings in the ZIP; 13 units permitted in Hale County in 2024 (0 in 5+ unit buildings).
- This rent runs 31% of the median local income ($47k/yr) — at the standard rent-burdened threshold; future hikes will face affordability resistance.
Forward outlook
- Local home prices are declining (-3.0%/yr); year-one equity from $519 of loan paydown is wiped out by about $2k of value loss. Plan a longer hold.
- Hale County population projected at -27% by 2050 — secular population decline; favor cash flow + early exit over multi-decade hold.
- At projected returns (-3.0% appreciation + 3.0% rent growth), your $21k cash investment doubles in ~5 years — after that, you're playing with house money.
Negotiation context
- It's been on market 267 days — a 12% lower offer ($66k) is reasonable based on typical stale-listing flexibility.
Risks & watch-outs
- Climate carrying-cost: extreme-heat days projected 7→21/yr by 2055 (HVAC capex compounding) — expect insurance premiums to compound above CPI over the hold.
Questions for the listing agent
- It's been on market 267 days. Have you received any prior offers? Is the seller open to a 12% concession, seller financing, or rate buy-down credit?
- Have any recent inspections been done? Can we get a copy of the seller's disclosures and any deferred-maintenance estimates?
- Why hasn't it sold? Are there any deal-killer items the seller is aware of (foundation, flood, title, zoning, code violations)?
- Is there a deadline driving the sale (1031 exchange, divorce, estate, relocation)? That informs how much negotiation room exists.
- What's the average days-on-market for RENTAL listings here right now (not sales)? A rising rental-DOM trend means longer vacancies and softer asking-rent achievability than the comps imply.
- What's the recent tenant-quality profile in this submarket — average credit score on applications, eviction rate, late-payment / NSF rate, and stable-employment percentage? A property-management company in the area should have these aggregated.
- How much new for-sale + rental construction is in the pipeline within 1–3 miles? Heavy new supply typically softens prices + rents 12–24 months out; constrained supply supports both.
Investment metrics
- 1% rule
- 1.63% ✓
- Cap rate
- 13.70%
- Cash-on-cash
- 26.47%
- DSCR
- 2.18
- GRM
- 5.1
CMA / ARV
No comps found within radius.
Projected returns pro-forma
-3.0% appreciation · 3.0% rent growth · sell at horizon
- IRR
- 20.3%
- Equity multiple
- 1.83×
- Total profit
- $17,360
- Equity at exit
- $11,183
- IRR
- 28.5%
- Equity multiple
- 3.53×
- Total profit
- $53,146
- Equity at exit
- $6,485
Cash invested: $21,000 (down + closing). Projections, not guarantees.
Landlord ↔ Tenant lean methodology
- Overall (STATE)
- 87 Strongly Landlord-Friendly
- State Texas
- 87 Strongly Landlord-Friendly · R+5
- County
- — inherits STATE
- City
- — inherits STATE
ZIP-level market 79072
- Active inventory
- 150
- Price-to-rent
- 5.1×
Monthly cashflow live
- Estimated rent
- $1,224 medium interval (Pro) →
- Mortgage (P&I)
- −$393
- Tax from tax record
- −$79 /mo · $946/yr
- Insurance
- −$31
- HOA
- −$0
- Vacancy / Maint / Mgmt
- −$257
- Net cashflow
- $463
Break-even live
UW: 25.0% down · 7.5% · 30yr · 1.5% tax · 5.0% vac · 8.0% maint · 8.0% mgmt
Financing live
Cash to close
- Down payment
- $18,750
- Closing costs
- $2,250
- Reserves months
- —
- Total cash needed
- —
Loan-product check · same deal, 3 products live
Conventional
25% down · 7.5% · 30yr
- Down + closing
- —
- Monthly P&I
- —
- Monthly cashflow
- —
- DSCR
- —
- Eligible?
- —
Personal DTI + credit; lowest rate.
DSCR
20% down · 8.5% · 30yr
- Down + closing
- —
- Monthly P&I
- —
- Monthly cashflow
- —
- DSCR
- —
- Eligible?
- —
No personal income docs; deal must DSCR.
Hard money
10% down · 12.0% · 12mo
- Down + closing
- —
- Monthly P&I
- —
- Monthly cashflow
- —
- DSCR
- —
- Eligible?
- —
Short-term bridge; refi at stabilization.
Listing history 5 events
-
2026-06-02days on market $75,000 Active 267 DOM
-
2026-06-01days on market $75,000 Active 266 DOM
-
2026-05-31days on market $75,000 Active 265 DOM
-
2026-05-30days on market $75,000 Active 264 DOM
-
2025-09-08$75,000 Active 171-char remark
Show marketing remark (171 chars)
Investment opportunity with land. If you have the vision this 3 bed 2 bath home with basement is a fantastic option. Can be sold as part of a package deal or individually.
ⓘ Source: listings_history table (triggers on properties + properties_extension) + one-shot
backfill from property_details.listing_events for pre-trigger history.
Tax reassessment forecast TX · Resets to sale price
- Current annual tax
- $946 · $79/mo
- Projected year-2 tax
- $1,372 · $114/mo
- Expected delta
- +$426/yr (+$36/mo · 45.0%)
ⓘ Screening estimate from a state-policy table — verify with the county assessor before closing.
Climate risk First Street
- Flood 1/10 Low FEMA zone X · 0% chance over 30 yrs
- Wildfire 2/10 Low
- Heat 5/10 Major
Nearby sold comps map
Loading sold comps map…
Walkable amenities ~0.75 mi
Loading nearby amenities…
Taxation est. · year 1
- Rental income
- $14,683
- − Mortgage interest
- −$4,201
- − Property taxes
- −$946
- − Insurance
- −$375
- − Repairs & maintenance
- −$1,175
- − Management
- −$1,175
- − Depreciation
- −$2,182
- Taxable income
- $4,630
- Est. tax owed @ 24.0%
- −$1,111
- After-tax cash flow
- $4,448/yr
For passive investors: Depreciation is non-cash, so a rental often shows a tax loss while cash-flowing — sheltering income. Rental losses are passive: they offset passive income freely, and up to $25,000/yr can offset ordinary (W-2) income if you actively participate and your MAGI is under $100k (phasing out to $0 by $150k); unused losses carry forward. On sale, claimed depreciation is recaptured at up to 25%, and gains may owe capital-gains tax (a 1031 exchange can defer both). Figures are a year-1 estimate at your 24.0% rate — not tax advice; consult a CPA.
Condition & rehab AI · 12 photos
This home requires significant updates and repairs to improve its condition and marketability. The most immediate needs are in the kitchen, bathroom, and exterior, which would significantly increase its value.
Repairs flagged
- Major Kitchen cabinets — The cabinets appear unfinished and need to be completed.
- Major Bathroom fixtures — Outdated fixtures need to be replaced.
- Major Exterior siding — The siding is weathered and needs repainting or replacement.
- Major Landscaping — The landscaping is overgrown and needs trimming and planting.
- Major Hardwood floors — The floors show signs of wear and need refinishing or replacement.
- Major Interior walls/paint — The walls are bare and need painting or wallpapering.
- Major Kitchen countertops — The countertops are bare and need to be installed or replaced.
- Major Bathroom shower/tub combo — The shower/tub combo is small and outdated and needs to be replaced or expanded.
Value-add opportunities
- Both Painting and updating the interior walls and cabinets — This would improve the home's appearance and make it more marketable.
- Both Upgrading the kitchen countertops and appliances — This would make the kitchen more functional and attractive.
- Both Replacing the outdated bathroom fixtures and shower/tub combo — This would improve the bathroom's functionality and appearance.
- Both Landscaping and trimming the overgrown vegetation — This would improve the home's curb appeal and make it more inviting.
- Both Repainting the exterior siding — This would improve the home's appearance and make it more marketable.
- Both Refraining the hardwood floors — This would improve the home's appearance and make it more marketable.
- Both Upgrading the HVAC system — This would improve the home's comfort and energy efficiency, making it more marketable.
Renovation cost estimate screening
| Repair item | Severity | Est. cost |
|---|---|---|
| Kitchen cabinets · The cabinets appear unfinished and need to be completed. | Major | $15,000–50,000 |
| Bathroom fixtures · Outdated fixtures need to be replaced. | Major | $15,000–50,000 |
| Exterior siding · The siding is weathered and needs repainting or replacement. | Major | $15,000–50,000 |
| Landscaping · The landscaping is overgrown and needs trimming and planting. | Major | $15,000–50,000 |
| Hardwood floors · The floors show signs of wear and need refinishing or replacement. | Major | $15,000–50,000 |
| Interior walls/paint · The walls are bare and need painting or wallpapering. | Major | $15,000–50,000 |
| Kitchen countertops · The countertops are bare and need to be installed or replaced. | Major | $15,000–50,000 |
| Bathroom shower/tub combo · The shower/tub combo is small and outdated and needs to be replaced or expanded. | Major | $15,000–50,000 |
| Total estimated repair cost · 8 items | $120,000–400,000 |
Value-add ROI direction
- Both Painting and updating the interior walls and cabinets — This would improve the home's appearance and make it more marketable. ↑
- Both Upgrading the kitchen countertops and appliances — This would make the kitchen more functional and attractive. ↑
- Both Replacing the outdated bathroom fixtures and shower/tub combo — This would improve the bathroom's functionality and appearance. ↑
- Both Landscaping and trimming the overgrown vegetation — This would improve the home's curb appeal and make it more inviting. ↑
- Both Repainting the exterior siding — This would improve the home's appearance and make it more marketable. ↑
- Both Refraining the hardwood floors — This would improve the home's appearance and make it more marketable. ↑
- Both Upgrading the HVAC system — This would improve the home's comfort and energy efficiency, making it more marketable. ↑
ⓘ Cost ranges are severity-bucket heuristics (US national rule-of-thumb). Get contractor quotes + a written scope before underwriting a rehab budget.
Schools (NCES district)
- District
- Plainview ISD
- NCES district ID
- 4835070
- Math proficiency
- 41% ▼ -3.00%
- Reading proficiency
- 37% ▲ 1.00%
- Median HH income
- $41,146
- Composite
- 32.85/100
- National rank
- #5615
- State rank
- #445 of 826 in TX
Livability — Plainview
- Score
- 69/100
- State rank
- #393
- US rank
- #8233
Category grades
Schools grade is shown separately in the Schools card above.
Census & demographics
- County
- Hale County · 25,389 people
- City population
- 25,389
- Metro
- Plainview, TX
- Population (ZIP)
- 25,389
- Household income
- $47,255
- Rent vs Own
- Severe rent burden
- 1015.0
Population outlook (Hale County) Hauer SSP2
- Today (2025)
- 30,851 people
- By 2030
- 29,158 · -5.5%
- By 2040
- 25,681 · -16.8%
- By 2050
- 22,420 · -27.3%
- By 2075
- 15,857 · -48.6%
- By 2100
- 10,500 · -66.0%
Race, ethnicity, and origin ACS 2023
- Neighborhood character
- Majority Hispanic (63%)
- Race & ethnicity
- Hispanic / Latino 63% White 29% Two or more races 19% Black 4% Native American 2%
- Hispanic origin (detail)
- Mexican 52%
- Common ancestry
- Italian 1% Russian 1% Lithuanian 1%
- Foreign-born
- 11% · Canada, Jamaica
- Languages at home
- 63% English-only · Spanish 36%
Political lean MEDSL · Hale
- 2024 margin
- Solid R (+58.0) · D 20.5% · R 78.5%
- 2008→2024 swing
- -13.1pp toward R · 2008: -44.9pp · 2024: -58.0pp
- All cycles
- 2024: R+58.0 2020: R+51.1 2016: R+48.4 2012: R+47.8 2008: R+44.9
Not yet ingested
- Civics
- —
Market trends
- HPI YoY
- ▼ -120.38%
- Current HPI
- 127.9276
- Rent YoY
- —
- Metro
- Plainview, TX
- State GDP YoY
- ▲ 3.95%
- F500 in state
- 110
Industry mix (Fortune 500 HQ in TX)
| Industry | F500 HQs | Revenue |
|---|---|---|
| Energy | 16 | $1,198B |
|
||
| Technology | 5 | $198B |
|
||
| Engineering / Construction | 4 | $72B |
|
||
| Energy Services | 3 | $60B |
|
||
| Utilities | 3 | $41B |
|
||
| Healthcare | 2 | $330B |
|
||
Price history
1 event — show timeline
- 2025-09-08 Listed $75,000 LARMLS
Property tax history
-3.1%/yrLatest (2025): $946 · -3.1% YoY. Source: county tax records.
Cash-flow waterfall
monthlySold comps — $/sqft
last 12 mo · ≤1 miLoading sold comps…