14556 E Tehachapi Blvd · Tehachapi, CA
Flood risk 1/10 · Minimal
- FEMA flood zone
- X (unshaded)
- Chance of flooding over 30 yrs
- 0.0%
- Est. flood insurance / yr
- $507 – $1,088
Fire risk 7/10 · Major
- Est. fire insurance / yr
- $659 – $1,223
Heat risk 5/10 · Moderate
- Hot days now (above 91°F)
- 7 days/yr
- Hot days in 30 yrs
- 20 days/yr
Wind risk 1/10 · Minimal
- Chance of severe wind over 30 yrs
- —
Air-quality risk 8/10 · Major
- Unhealthy air days now
- 17 days/yr
- Unhealthy air days in 30 yrs
- 21 days/yr
Risk factors via First Street. Map © Google.
Why this score? — see what drove the B- grade
The composite is a weighted blend of 9 inputs, each scored 0–100. Each bar is that input's sub-score; the figure is the points it added to the 100-point composite (weight × sub-score).
- Cash flow +30.0/30.0
- 1% rule +10.0/10.0
- DSCR +10.0/10.0
- ARV discount +7.5/15.0
- Schools +3.0/10.0
- Livability +2.6/5.0
- Rent growth +2.5/5.0
- Condition / age +2.5/5.0
- Appreciation +0.0/10.0
$149,900
🖨 Deal sheet 📄 Offer letter ✓ Due diligence
Listing remarks MLS
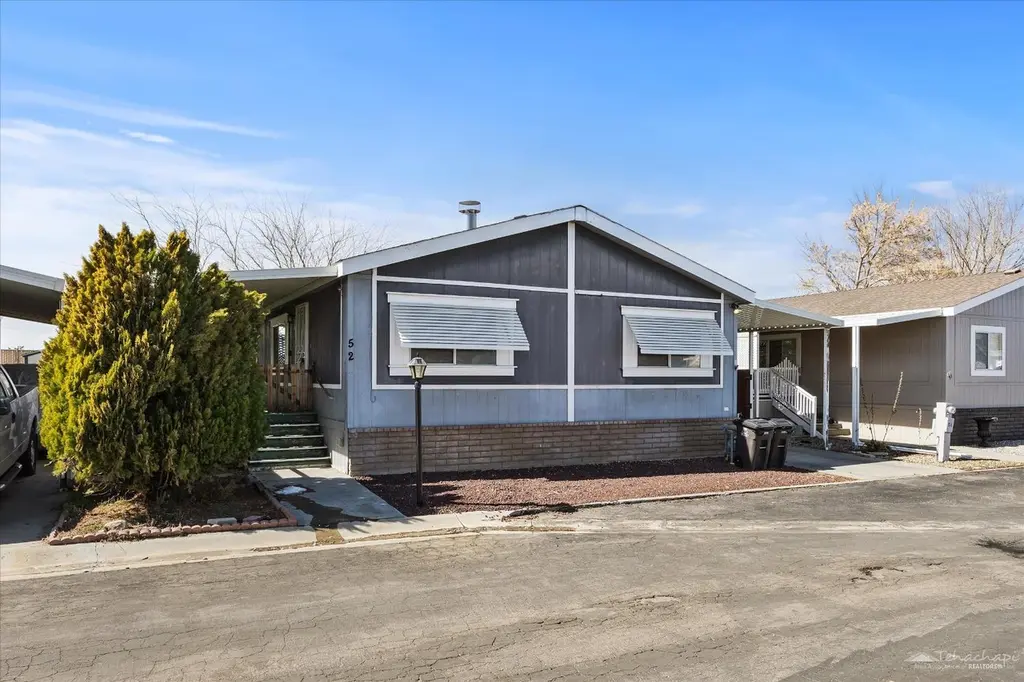
Living in the heart of Tehachapi! A 3 bedroom, 2 full bath split wing floor plan mobile home in the Tehachapi Willow Springs Mobile Home Park. Large living room with a fireplace, galley style kitchen that is open to the living room, vaulted ceiling, washer and dry off of the kitchen, master bedroom has a lot of natural light and the master bath is on-suit. The 2 additional bedrooms are both a good size and there is an attached carport. A small backyard that is fully fenced. There's also a pool that is available to all residents of the mobile park which makes summers that much more enjoyable. Close to town and the freeways. Close to town and the freeways, come see this wonderful home.
Key facts
- 4000 acre lot
- 3 garage spots
- Built 1989
Tags
Neighborhood map
What this means for you Summary
Snapshot
- This is a 3-bed/2.0-bath land listed at $150k.
Deal economics
- At list price, monthly cash flow is $744 ($9k/yr) — positive.
- The deal already cash-flows at list — no discount required.
- Meets the 1% rule at list price ($2k rent vs $150k).
- Recommended offer: $148k (1.5% below list) — sets the bar for market timing.
- Cap rate 12.2% vs local median 3.4% in Tehachapi — top-decile yield for the area; either an underpriced asset or a hidden risk that comps aren't pricing in. Stress-test before assuming the spread holds.
Location & tenants
- Location reads 51/100 on livability (#1,093 in CA) — a working-class tenant base; expect higher turnover. Strengths: housing A; Watch: employment D+, schools F, crime F.
- Tehachapi Unified (town): math 26% / reading 40% proficiency, ranked #285 of 517 in CA (top 55%) — families likely to look elsewhere, expect single-tenant / working-renter base with shorter leases.
- Market conditions: Rents flat; 654 active listings in the ZIP; solid renter incomes; 3,244 units permitted in Kern County in 2024 (73 in 5+ unit buildings).
- This rent runs 31% of the median local income ($87k/yr) — at the standard rent-burdened threshold; future hikes will face affordability resistance.
Forward outlook
- Local home prices are declining (-3.0%/yr); year-one equity from $1k of loan paydown is wiped out by about $4k of value loss. Plan a longer hold.
- Kern County population projected at +17% by 2050 — long-run rental-demand tailwind backs the buy-and-hold thesis.
- At projected returns (-3.0% appreciation + 0.1% rent growth), your $42k cash investment doubles in ~8 years — after that, you're playing with house money.
Negotiation context
- It's been on market 19 days — a 2% lower offer ($148k) is reasonable based on typical stale-listing flexibility.
- 47 sale attempts since 19y ago; this cycle's ask is 92% above the opening price — seller raised mid-cycle; expect resistance to lowballs.
- Current owner paid $75k; list at $150k implies a 100% gain — meaningful room to come down on a strong offer.
Risks & watch-outs
- Climate carrying-cost: major wildfire risk; extreme-heat days projected 7→20/yr by 2055 (HVAC capex compounding) — expect insurance premiums to compound above CPI over the hold.
Questions for the listing agent
- Is there a deadline driving the sale (1031 exchange, divorce, estate, relocation)? That informs how much negotiation room exists.
- Schools are F-rated, which usually means shorter tenancies and higher turnover. Who's the typical renter profile here, and what's been the actual vacancy rate?
- Crime grade is F in this area — have there been break-ins, vandalism, or insurance claims at this property in the last 3 years? What carrier currently insures it and at what premium?
- What's the average days-on-market for RENTAL listings here right now (not sales)? A rising rental-DOM trend means longer vacancies and softer asking-rent achievability than the comps imply.
- What's the recent tenant-quality profile in this submarket — average credit score on applications, eviction rate, late-payment / NSF rate, and stable-employment percentage? A property-management company in the area should have these aggregated.
- How much new for-sale + rental construction is in the pipeline within 1–3 miles? Heavy new supply typically softens prices + rents 12–24 months out; constrained supply supports both.
Investment metrics
- 1% rule
- 1.50% ✓
- Cap rate
- 12.25%
- Cash-on-cash
- 21.27%
- DSCR
- 1.95
- GRM
- 5.5
CMA / ARV
No comps found within radius.
Projected returns pro-forma
-3.0% appreciation · 0.05% rent growth · sell at horizon
- IRR
- 10.4%
- Equity multiple
- 1.40×
- Total profit
- $16,621
- Equity at exit
- $22,351
- IRR
- 16.9%
- Equity multiple
- 2.20×
- Total profit
- $50,485
- Equity at exit
- $12,961
Cash invested: $41,972 (down + closing). Projections, not guarantees.
Landlord ↔ Tenant lean methodology
- Overall (STATE)
- 18 Strongly Tenant-Friendly
- State California
- 18 Strongly Tenant-Friendly · D+13
- County
- — inherits STATE
- City
- — inherits STATE
ZIP-level market 93561
- Home prices YoY
- -23.9%
- Rents YoY
- 0.1%
- Active inventory
- 654
- Price-to-rent
- 5.5×
Monthly cashflow live
- Estimated rent
- $2,253 medium interval (Pro) →
- Mortgage (P&I)
- −$786
- Tax est. 1.5%
- −$187 /mo · $2,248/yr
- Insurance
- −$62
- HOA
- −$0
- Vacancy / Maint / Mgmt
- −$473
- Net cashflow
- $744
Break-even live
UW: 25.0% down · 7.5% · 30yr · 1.5% tax · 5.0% vac · 8.0% maint · 8.0% mgmt
Financing live
Cash to close
- Down payment
- $37,475
- Closing costs
- $4,497
- Reserves months
- —
- Total cash needed
- —
Loan-product check · same deal, 3 products live
Conventional
25% down · 7.5% · 30yr
- Down + closing
- —
- Monthly P&I
- —
- Monthly cashflow
- —
- DSCR
- —
- Eligible?
- —
Personal DTI + credit; lowest rate.
DSCR
20% down · 8.5% · 30yr
- Down + closing
- —
- Monthly P&I
- —
- Monthly cashflow
- —
- DSCR
- —
- Eligible?
- —
No personal income docs; deal must DSCR.
Hard money
10% down · 12.0% · 12mo
- Down + closing
- —
- Monthly P&I
- —
- Monthly cashflow
- —
- DSCR
- —
- Eligible?
- —
Short-term bridge; refi at stabilization.
Listing history 50 events
-
2022-10-07soldstatus $75,000 692-char remark
Show marketing remark (692 chars)
Living in the heart of Tehachapi! A 3 bedroom, 2 full bath split wing floor plan mobile home in the Tehachapi Willow Springs Mobile Home Park. Large living room with a fireplace, galley style kitchen that is open to the living room, vaulted ceiling, washer and dry off of the kitchen, master bedroom has a lot of natural light and the master bath is on-suit. The 2 additional bedrooms are both a good size and there is an attached carport. A small backyard that is fully fenced. There's also a pool that is available to all residents of the mobile park which makes summers that much more enjoyable. Close to town and the freeways. Close to town and the freeways, come see this wonderful home.
-
2022-08-25$78,000 692-char remark
Show marketing remark (692 chars)
Living in the heart of Tehachapi! A 3 bedroom, 2 full bath split wing floor plan mobile home in the Tehachapi Willow Springs Mobile Home Park. Large living room with a fireplace, galley style kitchen that is open to the living room, vaulted ceiling, washer and dry off of the kitchen, master bedroom has a lot of natural light and the master bath is on-suit. The 2 additional bedrooms are both a good size and there is an attached carport. A small backyard that is fully fenced. There's also a pool that is available to all residents of the mobile park which makes summers that much more enjoyable. Close to town and the freeways. Close to town and the freeways, come see this wonderful home.
-
2022-08-13price $75,000
-
2022-08-05soldstatus $95,000
-
2022-08-04$110,000
-
2022-06-08$89,900
-
2022-04-27soldstatus $98,000
-
2022-03-17soldstatus $125,000
-
2022-01-08$98,000
-
2022-01-07soldstatus $90,000
-
2021-10-27soldstatus $75,000
-
2021-10-27soldstatus $72,100
-
2021-10-22$99,950
-
2021-09-25$70,000
-
2021-09-10$125,000
-
2021-08-17$75,000
-
2021-07-23soldstatus $42,000
-
2021-06-14soldstatus $75,000
-
2021-05-19soldstatus $107,000
-
2021-05-18soldstatus $90,000
-
2021-04-30$79,000
-
2021-04-01$107,000
-
2021-03-30$90,000
-
2021-03-02soldstatus $87,000
-
2021-02-08soldstatus $60,000
-
2021-01-31$87,000
-
2021-01-29soldstatus $85,000
-
2021-01-11soldstatus $40,000
-
2020-12-27$70,000
-
2020-12-09$41,500
-
2020-09-30$50,000
-
2020-09-08$84,900
-
2020-08-17soldstatus $69,000
-
2020-07-08$75,000
-
2020-06-19soldstatus $46,000
-
2020-05-15$54,900
-
2019-12-06soldstatus $42,000
-
2019-10-30$49,000
-
2019-07-09soldstatus $67,000
-
2019-06-26soldstatus $55,000
-
2019-04-18$55,000
-
2019-04-02soldstatus $32,500
-
2019-03-28$68,000
-
2019-02-27soldstatus $63,000
-
2019-02-19$40,000
-
2018-11-22$69,000
-
2018-08-07soldstatus $65,000
-
2018-07-16soldstatus $62,500
-
2018-07-03$65,000
-
2018-06-28soldstatus $24,000
ⓘ Source: listings_history table (triggers on properties + properties_extension) + one-shot
backfill from property_details.listing_events for pre-trigger history.
Climate risk First Street
- Flood 1/10 Low FEMA zone X (unshaded) · 0% chance over 30 yrs
- Wildfire 7/10 Severe
- Heat 5/10 Major 7 d/yr ≥91°F today · 20 d/yr by 30 yrs out
- Wind 1/10 Low
- Air quality 8/10 Severe 17 unhealthy d/yr today · 21 by 30 yrs out
Nearby sold comps map
Loading sold comps map…
Walkable amenities ~0.75 mi
Loading nearby amenities…
Taxation est. · year 1
- Rental income
- $27,034
- − Mortgage interest
- −$8,397
- − Property taxes
- −$2,248
- − Insurance
- −$750
- − Repairs & maintenance
- −$2,163
- − Management
- −$2,163
- − Depreciation
- −$4,361
- Taxable income
- $6,953
- Est. tax owed @ 24.0%
- −$1,669
- After-tax cash flow
- $7,257/yr
For passive investors: Depreciation is non-cash, so a rental often shows a tax loss while cash-flowing — sheltering income. Rental losses are passive: they offset passive income freely, and up to $25,000/yr can offset ordinary (W-2) income if you actively participate and your MAGI is under $100k (phasing out to $0 by $150k); unused losses carry forward. On sale, claimed depreciation is recaptured at up to 25%, and gains may owe capital-gains tax (a 1031 exchange can defer both). Figures are a year-1 estimate at your 24.0% rate — not tax advice; consult a CPA.
Schools (NCES district)
- District
- Tehachapi Unified
- NCES district ID
- 0638880
- Math proficiency
- 26% ▼ -5.00%
- Reading proficiency
- 40% ▼ -6.00%
- Median HH income
- $59,230
- Composite
- 29.52/100
- National rank
- #6497
- State rank
- #285 of 517 in CA
Livability — Tehachapi
- Score
- 51/100
- State rank
- #1093
- US rank
- #25419
Category grades
Schools grade is shown separately in the Schools card above.
Census & demographics
- County
- Kern County · 710,371 people
- City population
- 31,175
- Metro
- Bakersfield, CA
- Population (ZIP)
- 31,175
- Household income
- $87,357
- Rent vs Own
- Severe rent burden
- 568.0
Population outlook (Kern County) Hauer SSP2
- Today (2025)
- 947,286 people
- By 2030
- 978,984 · +3.3%
- By 2040
- 1,045,018 · +10.3%
- By 2050
- 1,105,232 · +16.7%
- By 2075
- 1,229,538 · +29.8%
- By 2100
- 1,238,059 · +30.7%
Race, ethnicity, and origin ACS 2023
- Neighborhood character
- Predominantly White (68%)
- Race & ethnicity
- White 68% Hispanic / Latino 24% Two or more races 9% Asian 2% Native American 1%
- Hispanic origin (detail)
- Mexican 21%
- Common ancestry
- Italian 6% Lithuanian 3% Slovak 3%
- Foreign-born
- 10% · Canada, China
- Languages at home
- 83% English-only · Spanish 13% Chinese 1% Other Indo-European 1%
Political lean MEDSL · Kern
- 2024 margin
- Strong R (+21.1) · D 38.2% · R 59.3% · Other 2.5%
- 2008→2024 swing
- -3.3pp toward R · 2008: -17.8pp · 2024: -21.1pp
- All cycles
- 2024: R+21.1 2020: R+10.2 2016: R+15.0 2012: R+20.9 2008: R+17.8
Not yet ingested
- Civics
- —
Market trends
- HPI YoY
- ▼ -116.70%
- Current HPI
- 371.6546
- Rent YoY
- ▬ 0.05%
- Metro
- Bakersfield, CA
- State GDP YoY
- ▲ 3.21%
- F500 in state
- 116
Industry mix (Fortune 500 HQ in CA)
| Industry | F500 HQs | Revenue |
|---|---|---|
| Technology | 27 | $1,492B |
|
||
| Financial Services | 3 | $174B |
|
||
| Retail | 3 | $44B |
|
||
| Insurance | 3 | $26B |
|
||
| Media / Entertainment | 2 | $115B |
|
||
| Pharmaceuticals / Biotech | 2 | $62B |
|
||
Price history
-96.0% since first listed98 events — show timeline
- 2022-10-07 Sold (MLS) $75,000 TAAR
- 2022-08-25 Listed $78,000 TAAR
- 2022-08-13 Price Changed $75,000 GEMLS
- 2022-08-05 Sold (MLS) $95,000 TAAR
- 2022-08-04 Listed $110,000 TAAR
- 2022-06-08 Listed $89,900 TAAR
- 2022-04-27 Sold (MLS) $98,000 TAAR
- 2022-03-17 Sold (MLS) $125,000 TAAR
- 2022-01-08 Listed $98,000 TAAR
- 2022-01-07 Sold (MLS) $90,000 TAAR
- 2021-10-27 Sold (MLS) $72,100 TAAR
- 2021-10-27 Sold (MLS) $75,000 TAAR
- 2021-10-22 Listed $99,950 TAAR
- 2021-09-25 Listed $70,000 TAAR
- 2021-09-10 Listed $125,000 TAAR
- 2021-08-17 Listed $75,000 TAAR
- 2021-07-23 Sold (MLS) $42,000 TAAR
- 2021-06-14 Sold (MLS) $75,000 TAAR
- 2021-05-19 Sold (MLS) $107,000 TAAR
- 2021-05-18 Sold (MLS) $90,000 TAAR
- 2021-04-30 Listed $79,000 TAAR
- 2021-04-01 Listed $107,000 TAAR
- 2021-03-30 Listed $90,000 TAAR
- 2021-03-02 Sold (MLS) $87,000 TAAR
- 2021-02-08 Sold (MLS) $60,000 TAAR
- 2021-01-31 Listed $87,000 TAAR
- 2021-01-29 Sold (MLS) $85,000 TAAR
- 2021-01-11 Sold (MLS) $40,000 TAAR
- 2020-12-27 Listed $70,000 TAAR
- 2020-12-09 Listed $41,500 TAAR
- 2020-09-30 Listed $50,000 TAAR
- 2020-09-08 Listed $84,900 TAAR
- 2020-08-17 Sold (MLS) $69,000 TAAR
- 2020-07-08 Listed $75,000 TAAR
- 2020-06-19 Sold (MLS) $46,000 TAAR
- 2020-05-15 Listed $54,900 TAAR
- 2019-12-06 Sold (MLS) $42,000 TAAR
- 2019-10-30 Listed $49,000 TAAR
- 2019-07-09 Sold (MLS) $67,000 TAAR
- 2019-06-26 Sold (MLS) $55,000 TAAR
- 2019-04-18 Listed $55,000 TAAR
- 2019-04-02 Sold (MLS) $32,500 TAAR
- 2019-03-28 Listed $68,000 TAAR
- 2019-02-27 Sold (MLS) $63,000 TAAR
- 2019-02-19 Listed $40,000 TAAR
- 2018-11-22 Listed $69,000 TAAR
- 2018-08-07 Sold (MLS) $65,000 TAAR
- 2018-07-16 Sold (MLS) $62,500 TAAR
- 2018-07-03 Listed $65,000 TAAR
- 2018-06-28 Sold (MLS) $24,000 TAAR
- 2018-05-25 Listed $62,500 TAAR
- 2017-11-20 Sold (MLS) $87,000 TAAR
- 2017-11-19 Sold (MLS) $30,000 TAAR
- 2017-11-09 Sold (MLS) $33,500 TAAR
- 2017-10-27 Listed $27,500 TAAR
- 2017-09-12 Sold (MLS) $50,000 TAAR
- 2017-08-31 Listed $90,000 TAAR
- 2017-08-30 Listed $35,000 TAAR
- 2017-07-29 Listed $57,950 TAAR
- 2017-06-05 Sold (MLS) $33,000 TAAR
- 2017-02-05 Listed $37,500 TAAR
- 2016-12-12 Listed $37,500 TAAR
- 2016-12-08 Sold (MLS) $56,000 TAAR
- 2016-11-18 Sold (MLS) $42,000 TAAR
- 2016-10-31 Sold (MLS) $35,000 TAAR
- 2016-09-29 Listed $59,000 TAAR
- 2016-09-26 Sold (MLS) $55,000 TAAR
- 2016-09-21 Listed $39,900 TAAR
- 2016-08-29 Listed $45,000 TAAR
- 2016-08-01 Sold (MLS) $43,000 TAAR
- 2016-07-25 Sold (MLS) $43,000 TAAR
- 2016-07-01 Sold (MLS) $46,250 TAAR
- 2016-06-22 Listed $65,000 TAAR
- 2016-06-16 Listed $46,500 TAAR
- 2016-06-15 Sold (MLS) $32,000 TAAR
- 2016-06-14 Listed $43,000 TAAR
- 2016-05-24 Listed $47,500 TAAR
- 2016-05-11 Sold (Public Records) $1,035,000 Public Records
- 2016-04-19 Sold (MLS) $21,000 TAAR
- 2016-04-04 Listed $34,990 TAAR
- 2016-03-15 Listed $25,000 TAAR
- 2016-01-25 Sold (MLS) $33,500 TAAR
- 2015-12-09 Listed $40,000 TAAR
- 2015-09-15 Sold (MLS) $30,000 TAAR
- 2015-05-18 Listed $35,000 TAAR
- 2015-04-07 Sold (MLS) $40,768 TAAR
- 2015-03-27 Listing Removed — AVMLS
- 2015-03-27 Listing Removed — AVMLS
- 2015-02-25 Listed $45,000 TAAR
- 2014-11-06 Sold (MLS) $32,500 TAAR
- 2014-10-01 Listed $29,495 TAAR
- 2014-08-01 Sold (MLS) $33,000 TAAR
- 2014-06-27 Sold (MLS) $19,000 TAAR
- 2014-05-16 Listed $35,000 TAAR
- 2014-04-26 Listed $22,000 TAAR
- 2007-01-31 Listed $88,484 AVMLS
- 2006-08-31 Sold (Public Records) $4,610,000 Public Records
- 2004-02-20 Sold (Public Records) $1,890,000 Public Records
Property tax history
+2.1%/yrLatest (2025): $109,415 · +1.1% YoY. Source: county tax records.
Cash-flow waterfall
monthlySold comps — $/sqft
last 12 mo · ≤1 miLoading sold comps…