 🔨 Auction
1235 Twp Rd 353 · Polk, OH
Flood risk 1/10 · Minimal
- FEMA flood zone
- X (unshaded)
- Chance of flooding over 30 yrs
- 0.0%
- Est. flood insurance / yr
- $507 – $1,088
Fire risk 1/10 · Minimal
- Est. fire insurance / yr
- $713 – $1,323
Heat risk 2/10 · Minimal
- Hot days now (above 98°F)
- 6 days/yr
- Hot days in 30 yrs
- 14 days/yr
Wind risk 2/10 · Minimal
- Chance of severe wind over 30 yrs
- —
Air-quality risk 2/10 · Minimal
- Unhealthy air days now
- 0 days/yr
- Unhealthy air days in 30 yrs
- 1 days/yr
Risk factors via First Street. Map © Google.
Why this score? — see what drove the C- grade
The composite is a weighted blend of 9 inputs, each scored 0–100. Each bar is that input's sub-score; the figure is the points it added to the 100-point composite (weight × sub-score).
- Cash flow +15.0/30.0
- Appreciation +7.6/10.0
- ARV discount +7.5/15.0
- Schools +5.8/10.0
- 1% rule +5.0/10.0
- DSCR +5.0/10.0
- Livability +3.0/5.0
- Rent growth +2.5/5.0
- Condition / age +2.5/5.0
$1
🖨 Deal sheet (PDF) 📄 Offer letter ✓ Due diligence
Listing remarks
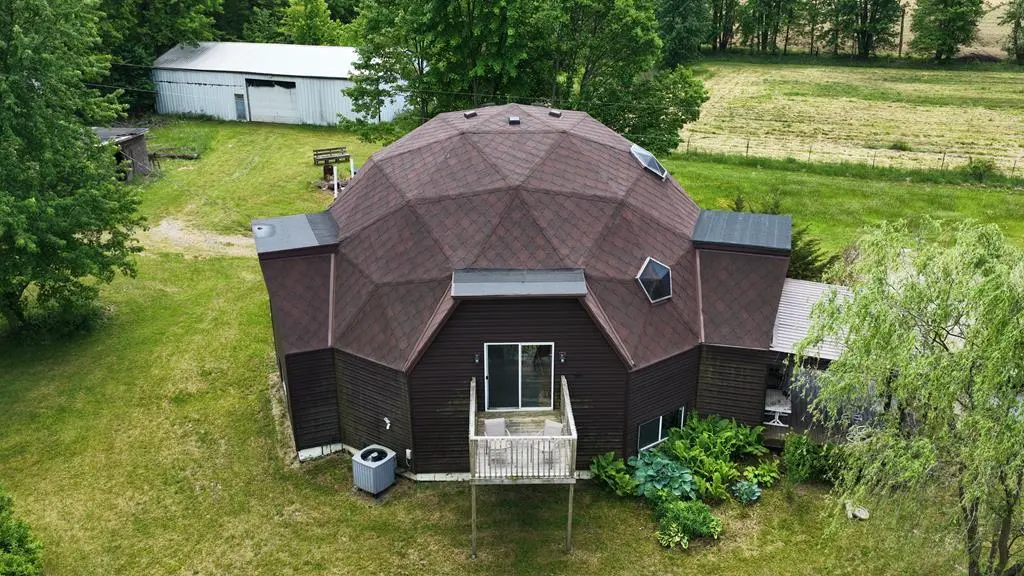
Going up for auction! A Hidden Gem with Potential!! Tucked away from the road, this rare geodesic dome home offers privacy, recreation, and endless possibilities! This property features nearly 19 acres of scenic countryside, including approximately 10+ wooded acres with untouched timber, creating an ideal setting for hunting, hiking, or recreation. Complementing the property is a large outbuilding, 35x70, equipped with electricity and a section featuring a concrete floor and separate entrance. The distinctive geodesic dome home is full of character and potential! The current layout includes 2 bedrooms, one full bathroom, laundry room, and inviting kitchen that overlooks the lower level, and
Key facts
- 10 wooded acres
- Nearly 19 acres
- Large outbuilding
Tags
Property features AI
Exterior
- Utilities: Private well water; Private sewer; Cable available
- Home design: Single family residence; 2 stories
- Construction: Vinyl siding; Shingle roof
- Exterior features: Deck; Wooded lot
Interior
- Kitchen: Disposal; Oven; Range; Refrigerator; Eat-in kitchen
- Bathrooms: 1 full bathroom; 1 half bathroom; 1 main-level bathroom
- Heating & cooling: Forced air heating; Natural gas heating; Heat pump; Central heating; Has heating
- Interior features: Cathedral ceilings; Eat-in kitchen; Fireplace (other type); Full basement, partially finished
- Laundry & utility: Washer; Dryer; Water softener (owned); Electric water heater
Neighborhood map
What this means for you Summary
Snapshot
- This is a 3-bed/2.5-bath single-family listed at $1.
Deal economics
- At list price, monthly cash flow is $988 ($12k/yr) — positive.
- The deal already cash-flows at list — no discount required.
- Meets the 1% rule at list price ($1k rent vs $1).
Location & tenants
- Location reads 59/100 on livability (#1,032 in OH) — a working-class tenant base; expect higher turnover. Strengths: cost of living A+, housing A+; Watch: crime C-, employment C-, schools F.
- Ashland City (town): math 70% / reading 69% proficiency, ranked #165 of 656 in OH (top 25%) — acceptable for families but not a draw, mixed tenant base, ~2y average lease.
- Market conditions: 7 active listings in the ZIP; 61 units permitted in Ashland County in 2024 (0 in 5+ unit buildings).
Forward outlook
- Ashland County population projected at -13% by 2050 — secular population decline; favor cash flow + early exit over multi-decade hold.
- At projected returns (5.2% appreciation + 3.0% rent growth), your $0 cash investment doubles in ~1 year — after that, you're playing with house money.
Negotiation context
- It's been on market 18 days — a 2% lower offer ($0) is reasonable based on typical stale-listing flexibility.
Questions for the listing agent
- Is there a deadline driving the sale (1031 exchange, divorce, estate, relocation)? That informs how much negotiation room exists.
- Schools are F-rated, which usually means shorter tenancies and higher turnover. Who's the typical renter profile here, and what's been the actual vacancy rate?
- What's the average days-on-market for RENTAL listings here right now (not sales)? A rising rental-DOM trend means longer vacancies and softer asking-rent achievability than the comps imply.
- What's the recent tenant-quality profile in this submarket — average credit score on applications, eviction rate, late-payment / NSF rate, and stable-employment percentage? A property-management company in the area should have these aggregated.
- How much new for-sale + rental construction is in the pipeline within 1–3 miles? Heavy new supply typically softens prices + rents 12–24 months out; constrained supply supports both.
Investment metrics
- 1% rule
- 125091.00% ✓
- Cap rate
- 1185860.68%
- Cash-on-cash
- 4235194.24%
- DSCR
- 188443.31
- GRM
- 0.0
CMA / ARV
No comps found within radius.
Projected returns pro-forma
5.18% appreciation · 3.0% rent growth · sell at horizon
- IRR
- —
- Equity multiple
- 224854.07×
- Total profit
- $62,959
- Equity at exit
- $1
- IRR
- —
- Equity multiple
- 485521.14×
- Total profit
- $135,946
- Equity at exit
- $1
Cash invested: $0 (down + closing). Projections, not guarantees.
Landlord ↔ Tenant lean methodology
- Overall (STATE)
- 73 Landlord-Friendly
- State Ohio
- 73 Landlord-Friendly · R+6
- County
- — inherits STATE
- City
- — inherits STATE
ZIP-level market 44866
- Home prices YoY
- 2.4%
- Active inventory
- 7
Monthly cashflow live
- Estimated rent
- $1,251 medium interval (Pro) →
- Mortgage (P&I)
- −$0
- Tax est. 1.5%
- −$0 /mo · $0/yr
- Insurance
- −$0
- HOA
- −$0
- Vacancy / Maint / Mgmt
- −$263
- Net cashflow
- $988
Break-even live
Sensitivity live
| Price | -10% $988 | -5% $988 | +0% $988 | +5% $988 | +10% $988 |
|---|---|---|---|---|---|
| Rent | -10% $889 | -5% $939 | +0% $988 | +5% $1,038 | +10% $1,087 |
| Rate | -1.0pp $988 | -0.5pp $988 | base $988 | +0.5pp $988 | +1.0pp $988 |
UW: 25.0% down · 7.5% · 30yr · 1.5% tax · 5.0% vac · 8.0% maint · 8.0% mgmt
Financing live
Cash to close
- Down payment
- $0
- Closing costs
- $0
- Reserves months
- —
- Total cash needed
- —
Loan-product check · same deal, 3 products live
Conventional
25% down · 7.5% · 30yr
- Down + closing
- —
- Monthly P&I
- —
- Monthly cashflow
- —
- DSCR
- —
- Eligible?
- —
Personal DTI + credit; lowest rate.
DSCR
20% down · 8.5% · 30yr
- Down + closing
- —
- Monthly P&I
- —
- Monthly cashflow
- —
- DSCR
- —
- Eligible?
- —
No personal income docs; deal must DSCR.
Hard money
10% down · 12.0% · 12mo
- Down + closing
- —
- Monthly P&I
- —
- Monthly cashflow
- —
- DSCR
- —
- Eligible?
- —
Short-term bridge; refi at stabilization.
Listing history 12 events
-
2026-06-19days on market $1 Active 18 DOM
-
2026-06-18days on market $1 Active 17 DOM
-
2026-06-17days on market $1 Active 16 DOM
-
2026-06-16days on market $1 Active 15 DOM
-
2026-06-15days on market $1 Active 14 DOM
-
2026-06-14days on market $1 Active 12 DOM
-
2026-06-12days on market $1 Active 11 DOM
-
2026-06-09days on market $1 Active 8 DOM
-
2026-06-08days on market $1 Active 7 DOM
-
2026-06-07days on market $1 Active 6 DOM
-
2026-06-02remarks 699-char remark
-
2026-06-02$1 Active 1 DOM
ⓘ Source: listings_history table (triggers on properties + properties_extension) + one-shot
backfill from property_details.listing_events for pre-trigger history.
Climate risk First Street
- Flood 1/10 Low FEMA zone X (unshaded) · 0% chance over 30 yrs
- Wildfire 1/10 Low
- Heat 2/10 Low 6 d/yr ≥98°F today · 14 d/yr by 30 yrs out
- Wind 2/10 Low
- Air quality 2/10 Low 0 unhealthy d/yr today · 1 by 30 yrs out
Nearby sold comps map
Loading sold comps map…
Walkable amenities ~0.75 mi
Loading nearby amenities…
Taxation est. · year 1
- Rental income
- $15,011
- − Mortgage interest
- −$0
- − Property taxes
- −$0
- − Insurance
- −$0
- − Repairs & maintenance
- −$1,201
- − Management
- −$1,201
- − Depreciation
- −$0
- Taxable income
- $12,609
- Est. tax owed @ 24.0%
- −$3,026
- After-tax cash flow
- $8,832/yr
For passive investors: Depreciation is non-cash, so a rental often shows a tax loss while cash-flowing — sheltering income. Rental losses are passive: they offset passive income freely, and up to $25,000/yr can offset ordinary (W-2) income if you actively participate and your MAGI is under $100k (phasing out to $0 by $150k); unused losses carry forward. On sale, claimed depreciation is recaptured at up to 25%, and gains may owe capital-gains tax (a 1031 exchange can defer both). Figures are a year-1 estimate at your 24.0% rate — not tax advice; consult a CPA.
Schools (NCES district)
- District
- Ashland City
- NCES district ID
- 3904350
- Math proficiency
- 70% ▼ -2.00%
- Reading proficiency
- 69% ▼ -4.00%
- Median HH income
- $43,164
- Composite
- 58.31/100
- National rank
- #1015
- State rank
- #165 of 656 in OH
Livability — Polk
- Score
- 59/100
- State rank
- #1032
- US rank
- #20487
Category grades
Schools grade is shown separately in the Schools card above.
Census & demographics
- County
- Ashland · 50,679 people
- Population (ZIP)
- 2,454
- Household income
- $63,125
- Rent vs Own
Population outlook (Ashland County) Hauer SSP2
- Today (2025)
- 52,732 people
- By 2030
- 51,728 · -1.9%
- By 2040
- 48,956 · -7.2%
- By 2050
- 46,070 · -12.6%
- By 2075
- 38,945 · -26.1%
- By 2100
- 30,883 · -41.4%
Race, ethnicity, and origin ACS 2023
- Neighborhood character
- Predominantly White (98%)
- Race & ethnicity
- White 98%
- Common ancestry
- Polish 5% Subsaharan African 3% Slovak 3%
- Foreign-born
- 0%
- Languages at home
- 89% English-only · German/W. Germanic 9% Spanish 1% Russian/Polish/Slavic 1%
Political lean MEDSL · Ashland
- 2024 margin
- Solid R (+50.0) · D 24.5% · R 74.5%
- 2008→2024 swing
- -26.7pp toward R · 2008: -23.3pp · 2024: -50.0pp
- All cycles
- 2024: R+50.0 2020: R+48.7 2016: R+47.8 2012: R+30.0 2008: R+23.3
Not yet ingested
- Civics
- —
Market trends
- HPI YoY
- ▲ 5.18%
- Current HPI
- 218.4241
- Rent YoY
- —
- Metro
- —
- State GDP YoY
- ▲ 1.98%
- F500 in state
- 48
Industry mix (Fortune 500 HQ in OH)
| Industry | F500 HQs | Revenue |
|---|---|---|
| Insurance | 3 | $145B |
|
||
| Industrial Machinery | 3 | $49B |
|
||
| Financial Services | 3 | $24B |
|
||
| Consumer Goods | 2 | $93B |
|
||
| Aerospace / Defense | 2 | $47B |
|
||
| Utilities | 2 | $33B |
|
||
Price history
2 events — show timeline
- 2026-06-02 Listed $1 ABOR
- 2017-07-11 Sold (Public Records) $179,900 Public Records
Property tax history
+1.9%/yrLatest (2025): $3,121 · +0.0% YoY. Source: county tax records.
Cash-flow waterfall
monthlySold comps — $/sqft
last 12 mo · ≤1 miLoading sold comps…