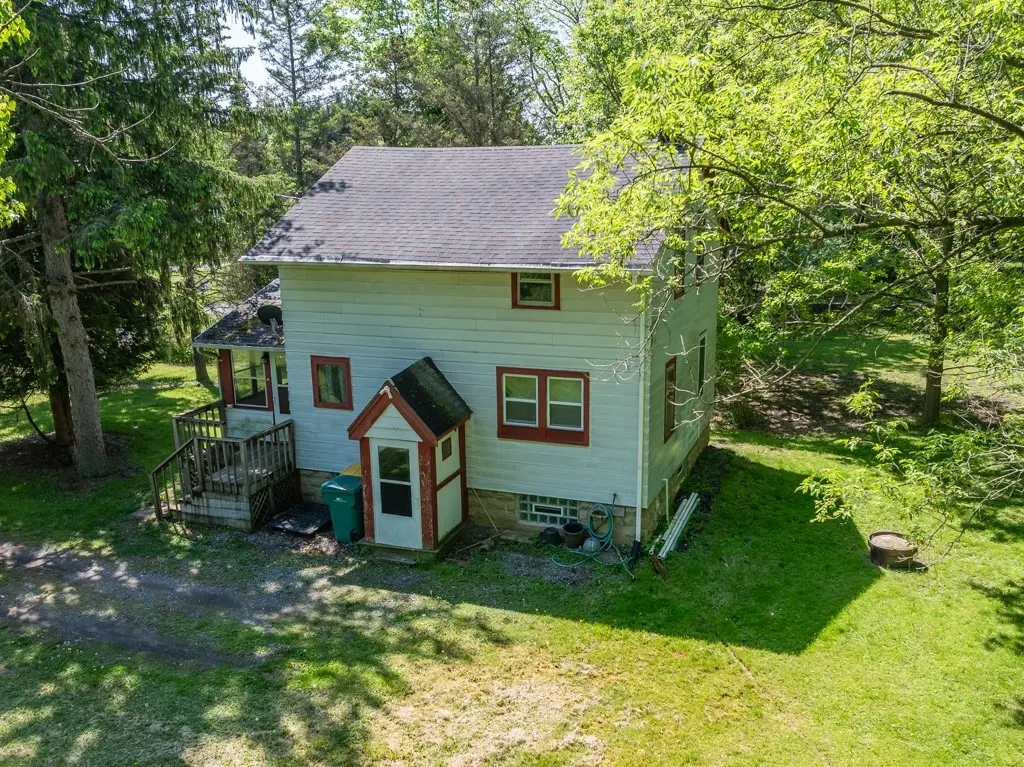
77 Fairview Rd · Scottsville, NY
Flood risk 1/10 · Minimal
- FEMA flood zone
- X (unshaded)
- Chance of flooding over 30 yrs
- 0.0%
- Est. flood insurance / yr
- $473 – $860
Fire risk 2/10 · Minimal
- Est. fire insurance / yr
- $691 – $1,283
Heat risk 2/10 · Minimal
- Hot days now (above 95°F)
- 7 days/yr
- Hot days in 30 yrs
- 14 days/yr
Wind risk 1/10 · Minimal
- Chance of severe wind over 30 yrs
- —
Air-quality risk 2/10 · Minimal
- Unhealthy air days now
- 1 days/yr
- Unhealthy air days in 30 yrs
- 1 days/yr
Risk factors via First Street. Map © Google.
Why this score? — see what drove the D+ grade
The composite is a weighted blend of 9 inputs, each scored 0–100. Each bar is that input's sub-score; the figure is the points it added to the 100-point composite (weight × sub-score).
- Cash flow +19.5/30.0
- DSCR +6.2/10.0
- 1% rule +5.9/10.0
- Schools +4.5/10.0
- Livability +3.6/5.0
- ARV discount +3.3/15.0
- Rent growth +2.5/5.0
- Condition / age +2.5/5.0
- Appreciation +0.0/10.0
$195,000
🖨 Deal sheet 📄 Offer letter ✓ Due diligence
Listing remarks
Charming village home located on a quiet dead-end street featuring 3 bedrooms and 1 full bath. Enjoy peaceful surroundings with low traffic while still being close to local shops, schools, and amenities. Perfect for comfortable family living or a cozy starter home. Delayed negotiations until June 3rd at 4 pm.
Key facts
- 1.9 acre lot
- Built 1915
- Listed 19 days
Property features AI
Exterior
- Parking: No garage
- Utilities: Cable available; High-speed internet available; Public water connected; Septic tank; Circuit breaker electrical
- Home design: Two-story home; Existing (not new construction)
- Construction: Aluminum siding; Copper and PEX plumbing; Stone foundation
- Exterior features: Porch; Gravel driveway; Rectangular, wooded residential lot; City street frontage
Interior
- Kitchen: Gas oven; Gas range; Refrigerator
- Bedrooms: Three bedrooms (all located on the second floor)
- Flooring: Carpet; Laminate; Luxury vinyl; Varies
- Bathrooms: 1 full bathroom
- Heating & cooling: Gas forced-air heating
- Interior features: Ceiling fan(s); Country kitchen; Enclosed porch
- Laundry & utility: Washer and dryer (laundry located in the basement); Electric water heater
Neighborhood map
What this means for you Summary
Snapshot
- This is a 3-bed/1.0-bath single-family listed at $195k.
Deal economics
- At list price, monthly cash flow is $220 ($3k/yr) — positive.
- The deal already cash-flows at list — no discount required.
- Meets the 1% rule at list price ($2k rent vs $195k).
- Recommended offer: $192k (1.5% below list) — sets the bar for market timing.
- Cap rate 7.6% vs local median 3.8% in Scottsville — top-decile yield for the area; either an underpriced asset or a hidden risk that comps aren't pricing in. Stress-test before assuming the spread holds.
Location & tenants
- Location reads 71/100 on livability (#409 in NY) — a middle-class / working-renter tenant base. Strengths: housing A+, crime A-, cost of living B+; Watch: schools C-, amenities F, commute F.
- Wheatland-Chili Central School District (suburban): math 46% / reading 57% proficiency, ranked #341 of 590 in NY (top 58%) — acceptable for families but not a draw, mixed tenant base, ~2y average lease.
- Market conditions: 20 active listings in the ZIP; 1 comparable units currently listed for rent nearby; solid renter incomes; 1,169 units permitted in Monroe County in 2024 (591 in 5+ unit buildings).
Forward outlook
- Local home prices are declining (-3.0%/yr); year-one equity from $1k of loan paydown is wiped out by about $6k of value loss. Plan a longer hold.
- Monroe County population projected to shrink 6% by 2050 — rents likely to lag national; underwrite the cash flow, not the appreciation.
Negotiation context
- It's been on market 19 days — a 2% lower offer ($192k) is reasonable based on typical stale-listing flexibility.
- 3 sale attempts since 8y ago with the ask held roughly flat each time — persistent listings suggest the price (not the market) is what's stuck; bring a comps-based counter.
- Current owner paid $100k; list at $195k implies a 95% gain — meaningful room to come down on a strong offer.
Risks & watch-outs
- Watch-outs: built in 1915 — expect roof / HVAC / electrical / plumbing capex.
Questions for the listing agent
- Built in 1915 — when were the roof, HVAC, electrical panel, plumbing, and water heater last replaced?
- Is there a deadline driving the sale (1031 exchange, divorce, estate, relocation)? That informs how much negotiation room exists.
- The area grade is low — what's the realistic commute time and amenity access for the typical tenant pool here? Any planned neighborhood developments (good or bad) we should know about?
- What's the average days-on-market for RENTAL listings here right now (not sales)? A rising rental-DOM trend means longer vacancies and softer asking-rent achievability than the comps imply.
- What's the recent tenant-quality profile in this submarket — average credit score on applications, eviction rate, late-payment / NSF rate, and stable-employment percentage? A property-management company in the area should have these aggregated.
- How much new for-sale + rental construction is in the pipeline within 1–3 miles? Heavy new supply typically softens prices + rents 12–24 months out; constrained supply supports both.
Investment metrics
- 1% rule
- 1.09% ✓
- Cap rate
- 7.65%
- Cash-on-cash
- 4.84%
- DSCR
- 1.22
- GRM
- 7.7
CMA / ARV
- ARV (on-the-fly)
- $178,464
- Comps found
- 5
Show comp detail 5 sales within ~0.75 mi
| Address | Dist | Beds/Ba | Sqft | Sold | Price | $/sf | Match |
|---|---|---|---|---|---|---|---|
| 4 Birchwood Dr | 0.66mi | 3/1.0 | 1,052 (-0%) | 0mo | $178,200 | $169 | 68 |
| 42 E Cavalier Rd | 0.43mi | 3/1.5 | 1,008 (-4%) | 4mo | $220,000 | $218 | 67 |
| 792 North Rd | 0.20mi | 2/1.0 (-1) | 1,124 (+6%) | 16mo | $195,000 | $173 | 62 |
| 67 W Cavalier Rd | 0.37mi | 3/1.0 | 1,008 (-4%) | 21mo | $152,500 | $151 | 58 |
| 548 North Rd | 0.46mi | 3/1.0 | 1,196 (+13%) | 16mo | $172,300 | $144 | 43 |
Match score weights: distance 35% · size 25% · config 20% · recency 20%. Top-matched comps best support the ARV.
Projected returns pro-forma
-3.0% appreciation · 3.0% rent growth · sell at horizon
- IRR
- -8.7%
- Equity multiple
- 0.68×
- Total profit
- $-17,476
- Equity at exit
- $29,075
- IRR
- 0.8%
- Equity multiple
- 1.06×
- Total profit
- $3,240
- Equity at exit
- $16,860
Cash invested: $54,600 (down + closing). Projections, not guarantees.
Landlord ↔ Tenant lean methodology
- Overall (STATE)
- 15 Strongly Tenant-Friendly
- State New York
- 15 Strongly Tenant-Friendly · D+10
- County
- — inherits STATE
- City
- — inherits STATE
ZIP-level market 14546
- Home prices YoY
- -10.0%
- Active inventory
- 20
- Price-to-rent
- 7.7×
Monthly cashflow live
- Estimated rent
- $2,120 medium interval (Pro) →
- Mortgage (P&I)
- −$1,023
- Tax from tax record
- −$351 /mo · $4,211/yr
- Insurance
- −$81
- HOA
- −$0
- Vacancy / Maint / Mgmt
- −$445
- Net cashflow
- $220
Break-even live
UW: 25.0% down · 7.5% · 30yr · 1.5% tax · 5.0% vac · 8.0% maint · 8.0% mgmt
Financing live
Cash to close
- Down payment
- $48,750
- Closing costs
- $5,850
- Reserves months
- —
- Total cash needed
- —
Loan-product check · same deal, 3 products live
Conventional
25% down · 7.5% · 30yr
- Down + closing
- —
- Monthly P&I
- —
- Monthly cashflow
- —
- DSCR
- —
- Eligible?
- —
Personal DTI + credit; lowest rate.
DSCR
20% down · 8.5% · 30yr
- Down + closing
- —
- Monthly P&I
- —
- Monthly cashflow
- —
- DSCR
- —
- Eligible?
- —
No personal income docs; deal must DSCR.
Hard money
10% down · 12.0% · 12mo
- Down + closing
- —
- Monthly P&I
- —
- Monthly cashflow
- —
- DSCR
- —
- Eligible?
- —
Short-term bridge; refi at stabilization.
Rent comps 1 comps
| Address | Beds | Baths | Sqft | Rent | $/sqft | DOM | Units | Dist |
|---|---|---|---|---|---|---|---|---|
| 300 Robert Quigley Dr Scottsville, NY | 1.0–3.0 | 1.0–1.5 | 1075 | $2,275 | $2.12 | 2d | 10 | 0.57mi |
Listing history 18 events
-
2026-06-16statusdays on market $195,000 Pending 19 DOM
-
2026-06-15statusdays on market $195,000 Active Under Contract 18 DOM
-
2026-06-13days on market $195,000 Active 16 DOM
-
2026-06-10days on market $195,000 Active 13 DOM
-
2026-06-09days on market $195,000 Active 12 DOM
-
2026-06-09days on market $195,000 Active 11 DOM
-
2026-06-07days on market $195,000 Active 10 DOM
-
2026-06-03days on market $195,000 Active 6 DOM
-
2026-06-03days on market $195,000 Active 5 DOM
-
2026-06-01days on market $195,000 Active 4 DOM
-
2026-05-31days on market $195,000 Active 3 DOM
-
2026-05-28$195,000 Active
-
2021-09-24historical
-
2021-09-17$124,900 Active
-
2019-01-23soldstatus $100,000
-
2018-12-07historical
-
2018-11-06price $107,900
-
2018-09-07$112,900 Active
ⓘ Source: listings_history table (triggers on properties + properties_extension) + one-shot
backfill from property_details.listing_events for pre-trigger history.
Tax reassessment forecast NY · Partial reset (capped growth)
- Current annual tax
- $4,211 · $351/mo
- Projected year-2 tax
- $4,211 · $351/mo
- Expected delta
- $0/yr ($0/mo · 0.0%)
ⓘ Screening estimate from a state-policy table — verify with the county assessor before closing.
Climate risk First Street
- Flood 1/10 Low FEMA zone X (unshaded) · 0% chance over 30 yrs
- Wildfire 2/10 Low
- Heat 2/10 Low 7 d/yr ≥95°F today · 14 d/yr by 30 yrs out
- Wind 1/10 Low
- Air quality 2/10 Low 1 unhealthy d/yr today · 1 by 30 yrs out
Nearby sold comps map
Loading sold comps map…
Walkable amenities ~0.75 mi
Loading nearby amenities…
Taxation est. · year 1
- Rental income
- $25,443
- − Mortgage interest
- −$10,923
- − Property taxes
- −$4,211
- − Insurance
- −$975
- − Repairs & maintenance
- −$2,035
- − Management
- −$2,035
- − Depreciation
- −$5,673
- Taxable loss
- −$410
- Est. tax savings @ 24.0%
- +$98
- After-tax cash flow
- $2,741/yr
For passive investors: Depreciation is non-cash, so a rental often shows a tax loss while cash-flowing — sheltering income. Rental losses are passive: they offset passive income freely, and up to $25,000/yr can offset ordinary (W-2) income if you actively participate and your MAGI is under $100k (phasing out to $0 by $150k); unused losses carry forward. On sale, claimed depreciation is recaptured at up to 25%, and gains may owe capital-gains tax (a 1031 exchange can defer both). Figures are a year-1 estimate at your 24.0% rate — not tax advice; consult a CPA.
Schools (NCES district)
- District
- Wheatland-Chili Central School District
- NCES district ID
- 3631170
- Math proficiency
- 46% ▲ 8.00%
- Reading proficiency
- 57% ▲ 15.00%
- Median HH income
- $57,303
- Composite
- 44.69/100
- National rank
- #2758
- State rank
- #341 of 590 in NY
Livability — Scottsville
- Score
- 71/100
- State rank
- #409
- US rank
- #7059
Category grades
Schools grade is shown separately in the Schools card above.
Census & demographics
- County
- Monroe County · 674,131 people
- City population
- 4,450
- Metro
- Rochester, NY
- Population (ZIP)
- 4,450
- Household income
- $95,046
- Rent vs Own
- Severe rent burden
- 55.0
Population outlook (Monroe County) Hauer SSP2
- Today (2025)
- 759,460 people
- By 2030
- 757,154 · -0.3%
- By 2040
- 740,644 · -2.5%
- By 2050
- 714,443 · -5.9%
- By 2075
- 645,883 · -15.0%
- By 2100
- 547,084 · -28.0%
Race, ethnicity, and origin ACS 2023
- Neighborhood character
- Predominantly White (92%)
- Race & ethnicity
- White 92% Two or more races 4% Black 3% Hispanic / Latino 2%
- Common ancestry
- Romanian 5% Lithuanian 5% Iranian 4%
- Foreign-born
- 2% · Canada
- Languages at home
- 98% English-only · French/Haitian/Cajun 1% Spanish 1%
Political lean MEDSL · Monroe
- 2024 margin
- D (+19.1) · D 59.5% · R 40.5%
- 2008→2024 swing
- +1.4pp toward D · 2008: 17.7pp · 2024: 19.1pp
- All cycles
- 2024: D+19.1 2020: D+21.0 2016: D+14.1 2012: D+17.4 2008: D+17.7
Not yet ingested
- Civics
- —
Market trends
- HPI YoY
- ▼ -28.95%
- Current HPI
- 260.4192
- Rent YoY
- —
- Metro
- Rochester, NY
- State GDP YoY
- ▲ 2.60%
- F500 in state
- 92
Industry mix (Fortune 500 HQ in NY)
| Industry | F500 HQs | Revenue |
|---|---|---|
| Financial Services | 10 | $950B |
|
||
| Consumer Goods | 9 | $162B |
|
||
| Insurance | 4 | $225B |
|
||
| Telecommunications | 2 | $144B |
|
||
| Pharmaceuticals | 2 | $112B |
|
||
| Media / Entertainment | 2 | $69B |
|
||
Price history
+72.7% since first listed7 events — show timeline
- 2026-05-28 Listed $195,000 UNYREIS
- 2021-09-24 Listing Removed — UNYREIS
- 2021-09-17 Listed $124,900 UNYREIS
- 2019-01-23 Sold (Public Records) $100,000 Public Records
- 2018-12-07 Listing Removed — UNYREIS
- 2018-11-06 Price Changed $107,900 UNYREIS
- 2018-09-07 Listed $112,900 UNYREIS
Property tax history
+8.3%/yrLatest (2025): $4,211 · +1.3% YoY. Source: county tax records.
Cash-flow waterfall
monthlySold comps — $/sqft
last 12 mo · ≤1 miLoading sold comps…