3101 E Este Rd · Terlingua, TX
Flood risk 1/10 · Minimal
- FEMA flood zone
- —
- Chance of flooding over 30 yrs
- 0.0%
- Est. flood insurance / yr
- —
Fire risk 1/10 · Minimal
- Est. fire insurance / yr
- $1,222 – $2,270
Heat risk 6/10 · Moderate
- Hot days now (above 100°F)
- 7 days/yr
- Hot days in 30 yrs
- 23 days/yr
Wind risk 1/10 · Minimal
- Chance of severe wind over 30 yrs
- —
Air-quality risk 1/10 · Minimal
- Unhealthy air days now
- 0 days/yr
- Unhealthy air days in 30 yrs
- 0 days/yr
Risk factors via First Street. Map © Google.
Why this score? — see what drove the C grade
The composite is a weighted blend of 9 inputs, each scored 0–100. Each bar is that input's sub-score; the figure is the points it added to the 100-point composite (weight × sub-score).
- Cash flow +20.4/30.0
- ARV discount +7.5/15.0
- DSCR +6.5/10.0
- 1% rule +5.6/10.0
- Appreciation +5.0/10.0
- Schools +4.0/10.0
- Livability +3.2/5.0
- Rent growth +2.5/5.0
- Condition / age +2.2/5.0
$91,600
🖨 Deal sheet (PDF) 📄 Offer letter ✓ Due diligence
Listing remarks MLS
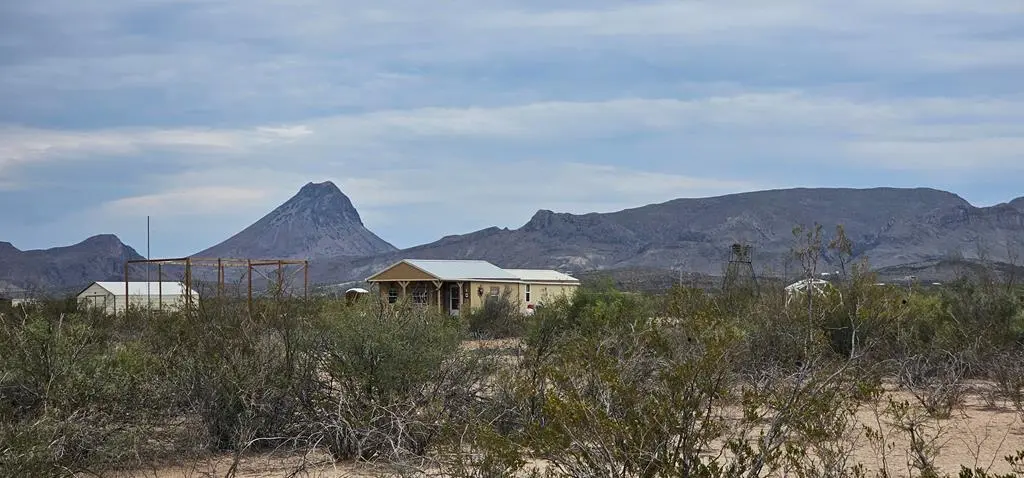
Check this out! Terlingua Ranch Getaway, Investment Property, Hunting Cabin, or All the above! This 1 bedrm, 1 bathrm, Off Grid Fully Equipped, Furnished & Move in Ready! Easy Access roads, Surrounding Mountain Views, Epic Sunsets & Endless Dark Skies! This property is located just 25miles North of Big Bend National Park, & only 12 miles from the Lodge, Cafe & Sparkling Pool. 1 mile off the paved road, corner lot w/ circle drive, Large Storage Shed, Garden Area, & More! Call Skye for showings.
Key facts
- Garden area
- Large storage shed
- 5 acre lot
Tags
Neighborhood map
What this means for you Summary
Snapshot
- This is a 1-bed/1.0-bath single-family listed at $92k. Condition is rated fair.
Deal economics
- At list price, monthly cash flow is $118 ($1k/yr) — positive.
- The deal already cash-flows at list — no discount required.
- Meets the 1% rule at list price ($975 rent vs $92k).
- Recommended offer: $81k (12.0% below list) — sets the bar for market timing.
Location & tenants
- Location reads 63/100 on livability (#875 in TX) — a middle-class / working-renter tenant base. Strengths: cost of living A+, housing A-; Watch: health & safety C-, crime F, amenities F.
- Alpine ISD (town): math 43% / reading 53% proficiency, ranked #235 of 826 in TX (top 28%) — families likely to look elsewhere, expect single-tenant / working-renter base with shorter leases.
- Zoned schools: Alpine El (math 27% / reading 37%, grade F, #2,268 of 4,322 statewide, top 55%, 377 students, 47% FRL); Alpine Middle (math 38% / reading 55%, grade D+, #443 of 1,662 statewide, top 28%, 269 students, 58% FRL); Alpine H S (math 77% / reading 62%, grade B, #119 of 1,632 statewide, top 9%, 308 students, 54% FRL).
- Market conditions: 312 active listings in the ZIP; 7 units permitted in Brewster County in 2024 (0 in 5+ unit buildings).
Forward outlook
- In year one you build about $3k of equity ($633 loan paydown + $3k appreciation (3.0% local appreciation)).
- Brewster County population projected at -17% by 2050 — secular population decline; favor cash flow + early exit over multi-decade hold.
- At projected returns (3.0% appreciation + 3.0% rent growth), your $26k cash investment doubles in ~5 years — after that, you're playing with house money.
- By year 10, paydown + projected appreciation supports a ~$33k cash-out refi (75% LTV) — recoverable capital for the next deal without selling this one.
Negotiation context
- It's been on market 260 days — a 12% lower offer ($81k) is reasonable based on typical stale-listing flexibility.
Risks & watch-outs
- Climate carrying-cost: extreme-heat days projected 7→23/yr by 2055 (HVAC capex compounding) — expect insurance premiums to compound above CPI over the hold.
Questions for the listing agent
- It's been on market 260 days. Have you received any prior offers? Is the seller open to a 12% concession, seller financing, or rate buy-down credit?
- Have any recent inspections been done? Can we get a copy of the seller's disclosures and any deferred-maintenance estimates?
- What does the HOA fee cover, when was the last increase, and are there any pending special assessments or reserve-fund shortfalls?
- Why hasn't it sold? Are there any deal-killer items the seller is aware of (foundation, flood, title, zoning, code violations)?
- Is there a deadline driving the sale (1031 exchange, divorce, estate, relocation)? That informs how much negotiation room exists.
- Schools are D-rated, which usually means shorter tenancies and higher turnover. Who's the typical renter profile here, and what's been the actual vacancy rate?
- Crime grade is F in this area — have there been break-ins, vandalism, or insurance claims at this property in the last 3 years? What carrier currently insures it and at what premium?
- What's the average days-on-market for RENTAL listings here right now (not sales)? A rising rental-DOM trend means longer vacancies and softer asking-rent achievability than the comps imply.
- What's the recent tenant-quality profile in this submarket — average credit score on applications, eviction rate, late-payment / NSF rate, and stable-employment percentage? A property-management company in the area should have these aggregated.
- How much new for-sale + rental construction is in the pipeline within 1–3 miles? Heavy new supply typically softens prices + rents 12–24 months out; constrained supply supports both.
Investment metrics
- 1% rule
- 1.06% ✓
- Cap rate
- 7.84%
- Cash-on-cash
- 5.54%
- DSCR
- 1.25
- GRM
- 7.8
CMA / ARV
No comps found within radius.
Projected returns pro-forma
3.0% appreciation · 3.0% rent growth · sell at horizon
- IRR
- 12.7%
- Equity multiple
- 1.73×
- Total profit
- $18,599
- Equity at exit
- $41,187
- IRR
- 14.7%
- Equity multiple
- 3.17×
- Total profit
- $55,696
- Equity at exit
- $63,475
Cash invested: $25,648 (down + closing). Projections, not guarantees.
Landlord ↔ Tenant lean methodology
- Overall (STATE)
- 87 Strongly Landlord-Friendly
- State Texas
- 87 Strongly Landlord-Friendly · R+5
- County
- — inherits STATE
- City
- — inherits STATE
ZIP-level market 79852
- Active inventory
- 312
- Price-to-rent
- 7.8×
Monthly cashflow live
- Estimated rent
- $975 medium interval (Pro) →
- Mortgage (P&I)
- −$480
- Tax est. 1.5%
- −$114 /mo · $1,374/yr
- Insurance
- −$38
- HOA
- −$19
- Vacancy / Maint / Mgmt
- −$205
- Net cashflow
- $118
Break-even live
Sensitivity live
| Price | -10% $182 | -5% $150 | +0% $118 | +5% $87 | +10% $55 |
|---|---|---|---|---|---|
| Rent | -10% $41 | -5% $80 | +0% $118 | +5% $157 | +10% $195 |
| Rate | -1.0pp $164 | -0.5pp $142 | base $118 | +0.5pp $95 | +1.0pp $70 |
UW: 25.0% down · 7.5% · 30yr · 1.5% tax · 5.0% vac · 8.0% maint · 8.0% mgmt
Financing live
Cash to close
- Down payment
- $22,900
- Closing costs
- $2,748
- Reserves months
- —
- Total cash needed
- —
Loan-product check · same deal, 3 products live
Conventional
25% down · 7.5% · 30yr
- Down + closing
- —
- Monthly P&I
- —
- Monthly cashflow
- —
- DSCR
- —
- Eligible?
- —
Personal DTI + credit; lowest rate.
DSCR
20% down · 8.5% · 30yr
- Down + closing
- —
- Monthly P&I
- —
- Monthly cashflow
- —
- DSCR
- —
- Eligible?
- —
No personal income docs; deal must DSCR.
Hard money
10% down · 12.0% · 12mo
- Down + closing
- —
- Monthly P&I
- —
- Monthly cashflow
- —
- DSCR
- —
- Eligible?
- —
Short-term bridge; refi at stabilization.
HOA detail
- Monthly dues
- $19 · $228/yr
- Likely covers
- pool
Listing history 18 events
-
2026-06-21days on market $91,600 Active 260 DOM
-
2026-06-18days on market $91,600 Active 257 DOM
-
2026-06-17days on market $91,600 Active 256 DOM
-
2026-06-16days on market $91,600 Active 255 DOM
-
2026-06-15days on market $91,600 Active 254 DOM
-
2026-06-14days on market $91,600 Active 252 DOM
-
2026-06-13days on market $91,600 Active 251 DOM
-
2026-06-10days on market $91,600 Active 249 DOM
-
2026-06-09days on market $91,600 Active 248 DOM
-
2026-06-08days on market $91,600 Active 247 DOM
-
2026-06-07days on market $91,600 Active 246 DOM
-
2026-06-03days on market $91,600 Active 242 DOM
-
2026-06-02days on market $91,600 Active 241 DOM
-
2026-06-01days on market $91,600 Active 240 DOM
-
2026-05-31days on market $91,600 Active 239 DOM
-
2026-05-31days on market $91,600 Active 238 DOM
-
2026-01-16price $91,600 527-char remark
Show marketing remark (527 chars)
Check this out! Terlingua Ranch Getaway, Investment Property, Hunting Cabin, or All the above! This 1 bedrm, 1 bathrm, Off Grid Fully Equipped, Furnished & Move in Ready! Easy Access roads, Surrounding Mountain Views, Epic Sunsets & Endless Dark Skies! This property is located just 25miles North of Big Bend National Park, & only 12 miles from the Lodge, Cafe & Sparkling Pool. 1 mile off the paved road, corner lot w/ circle drive, Large Storage Shed, Garden Area, & More! Call Skye for showings.
-
2025-10-05$93,550 Active 527-char remark
Show marketing remark (527 chars)
Check this out! Terlingua Ranch Getaway, Investment Property, Hunting Cabin, or All the above! This 1 bedrm, 1 bathrm, Off Grid Fully Equipped, Furnished & Move in Ready! Easy Access roads, Surrounding Mountain Views, Epic Sunsets & Endless Dark Skies! This property is located just 25miles North of Big Bend National Park, & only 12 miles from the Lodge, Cafe & Sparkling Pool. 1 mile off the paved road, corner lot w/ circle drive, Large Storage Shed, Garden Area, & More! Call Skye for showings.
ⓘ Source: listings_history table (triggers on properties + properties_extension) + one-shot
backfill from property_details.listing_events for pre-trigger history.
Climate risk First Street
- Flood 1/10 Low 0% chance over 30 yrs
- Wildfire 1/10 Low
- Heat 6/10 Major 7 d/yr ≥100°F today · 23 d/yr by 30 yrs out
- Wind 1/10 Low
- Air quality 1/10 Low 0 unhealthy d/yr today · 0 by 30 yrs out
Nearby sold comps map
Loading sold comps map…
Walkable amenities ~0.75 mi
Loading nearby amenities…
Taxation est. · year 1
- Rental income
- $11,702
- − Mortgage interest
- −$5,131
- − Property taxes
- −$1,374
- − Insurance
- −$458
- − Repairs & maintenance
- −$936
- − Management
- −$936
- − HOA
- −$228
- − Depreciation
- −$2,665
- Taxable loss
- −$26
- Est. tax savings @ 24.0%
- +$6
- After-tax cash flow
- $1,426/yr
For passive investors: Depreciation is non-cash, so a rental often shows a tax loss while cash-flowing — sheltering income. Rental losses are passive: they offset passive income freely, and up to $25,000/yr can offset ordinary (W-2) income if you actively participate and your MAGI is under $100k (phasing out to $0 by $150k); unused losses carry forward. On sale, claimed depreciation is recaptured at up to 25%, and gains may owe capital-gains tax (a 1031 exchange can defer both). Figures are a year-1 estimate at your 24.0% rate — not tax advice; consult a CPA.
Condition & rehab AI · 12 photos
This property is move-in ready with a fair condition, requiring minor repairs and maintenance to enhance its resale and rental value.
Repairs flagged
- Minor Exterior siding — Weathered but not damaged.
- Minor Paint — Some wear on walls.
- Minor Landscaping — Basic landscaping, could be improved.
Value-add opportunities
- Both Painting and landscaping — Enhances curb appeal and interior aesthetics.
- Both New flooring — Improves living space and resale value.
- Both New appliances — Modernizes kitchen and increases rental appeal.
Renovation cost estimate screening
| Repair item | Severity | Est. cost |
|---|---|---|
| Exterior siding · Weathered but not damaged. | Minor | $500–3,000 |
| Paint · Some wear on walls. | Minor | $500–3,000 |
| Landscaping · Basic landscaping, could be improved. | Minor | $500–3,000 |
| Total estimated repair cost · 3 items | $1,500–9,000 |
Value-add ROI direction
- Both Painting and landscaping — Enhances curb appeal and interior aesthetics. ↑
- Both New flooring — Improves living space and resale value. ↑
- Both New appliances — Modernizes kitchen and increases rental appeal. ↑
ⓘ Cost ranges are severity-bucket heuristics (US national rule-of-thumb). Get contractor quotes + a written scope before underwriting a rehab budget.
Schools (NCES district)
- District
- Alpine ISD
- NCES district ID
- 4807950
- Math proficiency
- 43% ▼ -4.00%
- Reading proficiency
- 53% ▲ 2.00%
- Median HH income
- $39,184
- Composite
- 40.06/100
- National rank
- #3814
- State rank
- #235 of 826 in TX
Livability — Terlingua
- Score
- 63/100
- State rank
- #875
- US rank
- #15764
Category grades
Schools grade is shown separately in the Schools card above.
Census & demographics
- Population (ZIP)
- 614
Population outlook (Brewster County) Hauer SSP2
- Today (2025)
- 8,850 people
- By 2030
- 8,577 · -3.1%
- By 2040
- 7,903 · -10.7%
- By 2050
- 7,338 · -17.1%
- By 2075
- 5,950 · -32.8%
- By 2100
- 4,678 · -47.1%
Race, ethnicity, and origin ACS 2023
- Neighborhood character
- Predominantly White (65%)
- Race & ethnicity
- White 65% Hispanic / Latino 34% Two or more races 21%
- Hispanic origin (detail)
- Mexican 30% Puerto Rican 4%
- Foreign-born
- 13% · Canada
- Languages at home
- 79% English-only · Spanish 21%
Political lean MEDSL · Brewster
- 2024 margin
- R (+12.6) · D 43.0% · R 55.6% · Other 1.4%
- 2008→2024 swing
- -15.5pp toward R · 2008: 3.0pp · 2024: -12.6pp
- All cycles
- 2024: R+12.6 2020: R+4.2 2016: R+4.8 2012: R+5.4 2008: D+3.0
Not yet ingested
- Civics
- —
Market trends
- HPI YoY
- —
- Current HPI
- —
- Rent YoY
- —
- Metro
- —
- State GDP YoY
- ▲ 3.95%
- F500 in state
- 110
Industry mix (Fortune 500 HQ in TX)
| Industry | F500 HQs | Revenue |
|---|---|---|
| Energy | 16 | $1,198B |
|
||
| Technology | 5 | $198B |
|
||
| Engineering / Construction | 4 | $72B |
|
||
| Energy Services | 3 | $60B |
|
||
| Utilities | 3 | $41B |
|
||
| Healthcare | 2 | $330B |
|
||
Price history
-2.1% since first listed2 events — show timeline
- 2026-01-16 Price Changed $91,600 ODMLS
- 2025-10-05 Listed $93,550 ODMLS
Cash-flow waterfall
monthlySold comps — $/sqft
last 12 mo · ≤1 miLoading sold comps…