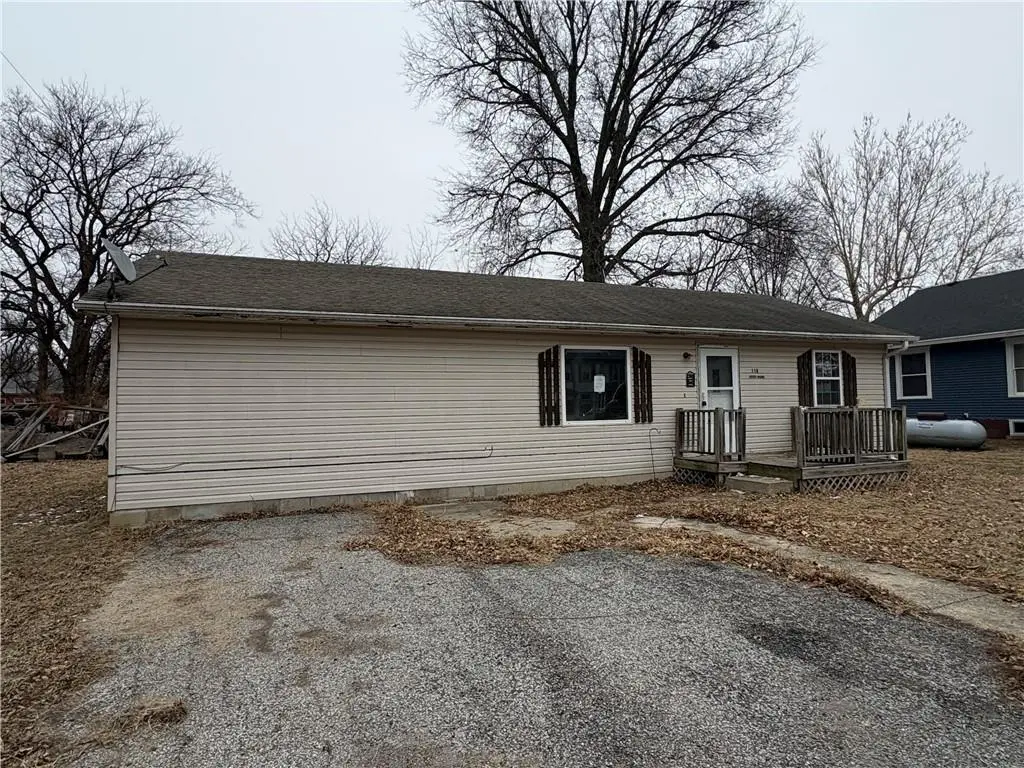
117 Manning St · Burlington Junction, MO
Flood risk 1/10 · Minimal
- FEMA flood zone
- X (unshaded)
- Chance of flooding over 30 yrs
- 0.0%
- Est. flood insurance / yr
- $507 – $1,088
Fire risk 1/10 · Minimal
- Est. fire insurance / yr
- $1,054 – $1,958
Heat risk 3/10 · Minor
- Hot days now (above 106°F)
- 7 days/yr
- Hot days in 30 yrs
- 15 days/yr
Wind risk 2/10 · Minimal
- Chance of severe wind over 30 yrs
- —
Air-quality risk 1/10 · Minimal
- Unhealthy air days now
- 0 days/yr
- Unhealthy air days in 30 yrs
- 0 days/yr
Risk factors via First Street. Map © Google.
Why this score? — see what drove the B grade
The composite is a weighted blend of 9 inputs, each scored 0–100. Each bar is that input's sub-score; the figure is the points it added to the 100-point composite (weight × sub-score).
- Cash flow +30.0/30.0
- 1% rule +10.0/10.0
- DSCR +10.0/10.0
- ARV discount +7.5/15.0
- Appreciation +5.0/10.0
- Livability +3.0/5.0
- Schools +2.8/10.0
- Rent growth +2.5/5.0
- Condition / age +2.5/5.0
$22,382
🖨 Deal sheet (PDF) 📄 Offer letter ✓ Due diligence
Listing remarks MLS
Level ranch all ready for rehab! Nice, level lot with offstreet parking. Make this home amazing again!
Key facts
- Level lot
- Offstreet parking
- 0.26 acre lot
Tags
Neighborhood map
What this means for you Summary
Snapshot
- This is a 2-bed/1.0-bath other listed at $22k.
Deal economics
- At list price, monthly cash flow is $522 ($6k/yr) — positive.
- The deal already cash-flows at list — no discount required.
- Meets the 1% rule at list price ($912 rent vs $22k).
- Recommended offer: $22k (3.0% below list) — sets the bar for market timing.
Location & tenants
- Location reads 60/100 on livability (#466 in MO) — a middle-class / working-renter tenant base. Strengths: cost of living A+, housing A+; Watch: crime F, amenities F, commute F.
- West Nodaway County R-I (rural): math 25% / reading 35% proficiency, ranked #458 of 535 in MO (top 86%) — families likely to look elsewhere, expect single-tenant / working-renter base with shorter leases.
- Zoned schools: West Nodaway R-I Elem. (math 44% / reading 44%, grade F, #413 of 1,115 statewide, top 42%, 132 students, 46% FRL); West Nodaway High (math 52% / reading 52%, grade D+, #92 of 521 statewide, top 20%, 95 students, 44% FRL) — zoned schools at 45% FRL track the district average.
- Zoned-school proficiency averages 48% at this address vs 30% district-wide (+18 pts) — the actual schools serving this property are materially stronger than the West Nodaway County R-I average implies; a family-tenant draw the district grade alone would hide.
- Market conditions: 5 active listings in the ZIP; 49 units permitted in Nodaway County in 2024 (0 in 5+ unit buildings).
Forward outlook
- In year one you build about $825 of equity ($154 loan paydown + $671 appreciation (3.0% local appreciation)).
- Nodaway County population projected at -13% by 2050 — secular population decline; favor cash flow + early exit over multi-decade hold.
- At projected returns (3.0% appreciation + 3.0% rent growth), your $6k cash investment doubles in ~1 year — after that, you're playing with house money.
Negotiation context
- It's been on market 58 days — a 3% lower offer ($22k) is reasonable based on typical stale-listing flexibility.
- 2 sale attempts since 16y ago; this cycle's ask has dropped $1k (5%) from the opening price — seller is motivated, your offer sets the floor, not the list.
Risks & watch-outs
- Watch-outs: property tax is 3.9% of price.
Questions for the listing agent
- It's been on market 58 days. Have you received any prior offers? Is the seller open to a 3% concession, seller financing, or rate buy-down credit?
- Built in 1965 — when were the roof, HVAC, electrical panel, plumbing, and water heater last replaced?
- Property tax is high relative to price — has the assessment been appealed recently, and will the sale trigger a re-assessment?
- Is there a deadline driving the sale (1031 exchange, divorce, estate, relocation)? That informs how much negotiation room exists.
- Schools are F-rated, which usually means shorter tenancies and higher turnover. Who's the typical renter profile here, and what's been the actual vacancy rate?
- Crime grade is F in this area — have there been break-ins, vandalism, or insurance claims at this property in the last 3 years? What carrier currently insures it and at what premium?
- What's the average days-on-market for RENTAL listings here right now (not sales)? A rising rental-DOM trend means longer vacancies and softer asking-rent achievability than the comps imply.
- What's the recent tenant-quality profile in this submarket — average credit score on applications, eviction rate, late-payment / NSF rate, and stable-employment percentage? A property-management company in the area should have these aggregated.
- How much new for-sale + rental construction is in the pipeline within 1–3 miles? Heavy new supply typically softens prices + rents 12–24 months out; constrained supply supports both.
Investment metrics
- 1% rule
- 4.08% ✓
- Cap rate
- 34.26%
- Cash-on-cash
- 99.87%
- DSCR
- 5.44
- GRM
- 2.0
CMA / ARV
No comps found within radius.
Projected returns pro-forma
3.0% appreciation · 3.0% rent growth · sell at horizon
- IRR
- —
- Equity multiple
- 6.74×
- Total profit
- $35,955
- Equity at exit
- $10,064
- IRR
- —
- Equity multiple
- 14.01×
- Total profit
- $81,504
- Equity at exit
- $15,510
Cash invested: $6,267 (down + closing). Projections, not guarantees.
Landlord ↔ Tenant lean methodology
- Overall (STATE)
- 81 Strongly Landlord-Friendly
- State Missouri
- 81 Strongly Landlord-Friendly · R+10
- County
- — inherits STATE
- City
- — inherits STATE
ZIP-level market 64428
- Active inventory
- 5
- Price-to-rent
- 2.0×
Monthly cashflow live
- Estimated rent
- $912 medium interval (Pro) →
- Mortgage (P&I)
- −$117
- Tax from tax record
- −$72 /mo · $868/yr
- Insurance
- −$9
- HOA
- −$0
- Lot rent
- −$0
- Vacancy / Maint / Mgmt
- −$192
- Net cashflow
- $522
Break-even live
Sensitivity live
| Price | -10% $534 | -5% $528 | +0% $522 | +5% $515 | +10% $509 |
|---|---|---|---|---|---|
| Rent | -10% $449 | -5% $486 | +0% $522 | +5% $558 | +10% $594 |
| Rate | -1.0pp $533 | -0.5pp $527 | base $522 | +0.5pp $516 | +1.0pp $510 |
UW: 25.0% down · 7.5% · 30yr · 1.5% tax · 5.0% vac · 8.0% maint · 8.0% mgmt
Financing live
Cash to close
- Down payment
- $5,596
- Closing costs
- $671
- Reserves months
- —
- Total cash needed
- —
Loan-product check · same deal, 3 products live
Conventional
25% down · 7.5% · 30yr
- Down + closing
- —
- Monthly P&I
- —
- Monthly cashflow
- —
- DSCR
- —
- Eligible?
- —
Personal DTI + credit; lowest rate.
DSCR
20% down · 8.5% · 30yr
- Down + closing
- —
- Monthly P&I
- —
- Monthly cashflow
- —
- DSCR
- —
- Eligible?
- —
No personal income docs; deal must DSCR.
Hard money
10% down · 12.0% · 12mo
- Down + closing
- —
- Monthly P&I
- —
- Monthly cashflow
- —
- DSCR
- —
- Eligible?
- —
Short-term bridge; refi at stabilization.
Listing history 5 events
-
2026-05-15status Pending 102-char remark
Show marketing remark (102 chars)
Level ranch all ready for rehab! Nice, level lot with offstreet parking. Make this home amazing again!
-
2026-04-17price $22,382 102-char remark
Show marketing remark (102 chars)
Level ranch all ready for rehab! Nice, level lot with offstreet parking. Make this home amazing again!
-
2026-03-18$23,560 Active 102-char remark
Show marketing remark (102 chars)
Level ranch all ready for rehab! Nice, level lot with offstreet parking. Make this home amazing again!
-
2011-01-11soldstatus 417-char remark
Show marketing remark (417 chars)
Everything is new! All elec home, 35 yr roof, HVAC (AC 2yr), 200 amp service, new wiring, plumbing (PEX/manifold). New doors, windows, cabinets, countertops & carpet, some original oak. New tile in kitchen, bath, shower, & laundry. New lighting fixtures. Quality products were used, it's a home you can live in for years without any major updates needed. Large yard & beautiful trees, asphalt drive.
-
2010-10-19$77,500 417-char remark
Show marketing remark (417 chars)
Everything is new! All elec home, 35 yr roof, HVAC (AC 2yr), 200 amp service, new wiring, plumbing (PEX/manifold). New doors, windows, cabinets, countertops & carpet, some original oak. New tile in kitchen, bath, shower, & laundry. New lighting fixtures. Quality products were used, it's a home you can live in for years without any major updates needed. Large yard & beautiful trees, asphalt drive.
ⓘ Source: listings_history table (triggers on properties + properties_extension) + one-shot
backfill from property_details.listing_events for pre-trigger history.
Tax reassessment forecast MO · Resets to sale price
- Current annual tax
- $868 · $72/mo
- Projected year-2 tax
- $868 · $72/mo
- Expected delta
- $0/yr ($0/mo · 0.0%)
ⓘ Screening estimate from a state-policy table — verify with the county assessor before closing.
Climate risk First Street
- Flood 1/10 Low FEMA zone X (unshaded) · 0% chance over 30 yrs
- Wildfire 1/10 Low
- Heat 3/10 Moderate 7 d/yr ≥106°F today · 15 d/yr by 30 yrs out
- Wind 2/10 Low
- Air quality 1/10 Low 0 unhealthy d/yr today · 0 by 30 yrs out
Nearby sold comps map
Loading sold comps map…
Walkable amenities ~0.75 mi
Loading nearby amenities…
Taxation est. · year 1
- Rental income
- $10,946
- − Mortgage interest
- −$1,254
- − Property taxes
- −$868
- − Insurance
- −$112
- − Repairs & maintenance
- −$876
- − Management
- −$876
- − Depreciation
- −$651
- Taxable income
- $6,310
- Est. tax owed @ 24.0%
- −$1,514
- After-tax cash flow
- $4,744/yr
For passive investors: Depreciation is non-cash, so a rental often shows a tax loss while cash-flowing — sheltering income. Rental losses are passive: they offset passive income freely, and up to $25,000/yr can offset ordinary (W-2) income if you actively participate and your MAGI is under $100k (phasing out to $0 by $150k); unused losses carry forward. On sale, claimed depreciation is recaptured at up to 25%, and gains may owe capital-gains tax (a 1031 exchange can defer both). Figures are a year-1 estimate at your 24.0% rate — not tax advice; consult a CPA.
Schools (NCES district)
- District
- West Nodaway County R-I
- NCES district ID
- 2930900
- Math proficiency
- 25% ▼ -5.00%
- Reading proficiency
- 35% ▬ 0.00%
- Median HH income
- $41,065
- Composite
- 28.16/100
- National rank
- #12195
- State rank
- #458 of 535 in MO
Livability — Burlington Junction
- Score
- 60/100
- State rank
- #466
- US rank
- #18573
Category grades
Schools grade is shown separately in the Schools card above.
Census & demographics
- Census place
- Burlington Junction, MO
- Population (ZIP)
- 561
Population outlook (Nodaway County) Hauer SSP2
- Today (2025)
- 22,010 people
- By 2030
- 21,531 · -2.2%
- By 2040
- 20,360 · -7.5%
- By 2050
- 19,210 · -12.7%
- By 2075
- 17,711 · -19.5%
- By 2100
- 16,796 · -23.7%
Race, ethnicity, and origin ACS 2023
- Neighborhood character
- Predominantly White (97%)
- Race & ethnicity
- White 97% Two or more races 1%
- Common ancestry
- Iranian 2% Slovak 1% Lithuanian 1%
- Foreign-born
- 1%
- Languages at home
- 92% English-only · German/W. Germanic 8%
Political lean MEDSL · Nodaway
- 2024 margin
- Solid R (+43.7) · D 27.6% · R 71.4% · Other 1.0%
- 2008→2024 swing
- -33.2pp toward R · 2008: -10.5pp · 2024: -43.7pp
- All cycles
- 2024: R+43.7 2020: R+40.5 2016: R+40.8 2012: R+27.0 2008: R+10.5
Not yet ingested
- Civics
- —
Market trends
- HPI YoY
- —
- Current HPI
- —
- Rent YoY
- —
- Metro
- —
- State GDP YoY
- ▲ 1.84%
- F500 in state
- 20
Industry mix (Fortune 500 HQ in MO)
| Industry | F500 HQs | Revenue |
|---|---|---|
| Healthcare | 1 | $163B |
|
||
| Insurance | 1 | $21B |
|
||
| Industrial Technology | 1 | $17B |
|
||
| Retail | 1 | $16B |
|
||
| Industrial Distribution | 1 | $10B |
|
||
| Utilities | 1 | $9B |
|
||
Price history
-71.1% since first listed5 events — show timeline
- 2026-05-15 Pending — Heartland MLS as Distributed by MLS Grid
- 2026-04-17 Price Changed $22,382 Heartland MLS as Distributed by MLS Grid
- 2026-03-18 Listed $23,560 Heartland MLS as Distributed by MLS Grid
- 2011-01-11 Sold (MLS) — Heartland MLS as Distributed by MLS Grid
- 2010-10-19 Listed $77,500 Heartland MLS as Distributed by MLS Grid
Property tax history
+4.7%/yrLatest (2025): $868 · +14.6% YoY. Source: county tax records.
Cash-flow waterfall
monthlySold comps — $/sqft
last 12 mo · ≤1 miLoading sold comps…