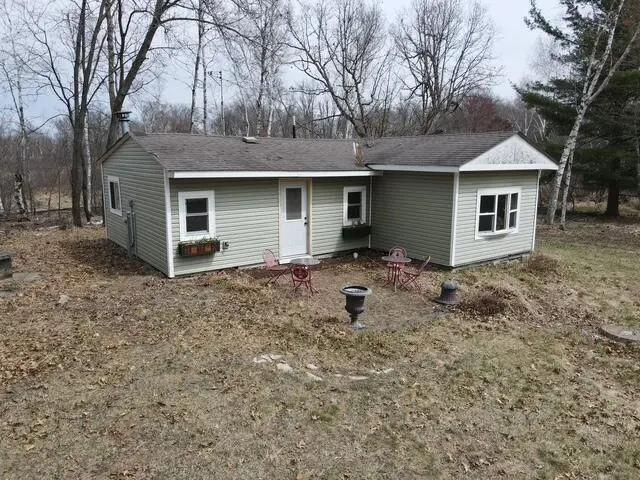
N6432 11th Ct · Harris, WI
Flood risk 1/10 · Minimal
- FEMA flood zone
- X (unshaded)
- Chance of flooding over 30 yrs
- 0.0%
- Est. flood insurance / yr
- $473 – $860
Fire risk 3/10 · Minor
- Est. fire insurance / yr
- $636 – $1,182
Heat risk 2/10 · Minimal
- Hot days now (above 100°F)
- 7 days/yr
- Hot days in 30 yrs
- 13 days/yr
Wind risk 2/10 · Minimal
- Chance of severe wind over 30 yrs
- —
Air-quality risk 2/10 · Minimal
- Unhealthy air days now
- 0 days/yr
- Unhealthy air days in 30 yrs
- 1 days/yr
Risk factors via First Street. Map © Google.
Why this score? — see what drove the C- grade
The composite is a weighted blend of 9 inputs, each scored 0–100. Each bar is that input's sub-score; the figure is the points it added to the 100-point composite (weight × sub-score).
- Cash flow +21.7/30.0
- ARV discount +7.5/15.0
- DSCR +6.9/10.0
- 1% rule +5.7/10.0
- Schools +3.3/10.0
- Rent growth +2.5/5.0
- Livability +2.5/5.0
- Condition / age +2.2/5.0
- Appreciation +0.0/10.0
$79,900
🖨 Deal sheet 📄 Offer letter ✓ Due diligence
Listing remarks
Handyman or Investment Opportunity! This 3-season, 2-bedroom, 1 bath cottage offers the perfect opportunity to create your dream escape nestled on 1.5 acres in a peaceful, wooded setting filled with natural beauty and wildflife. Nature lovers will appreciate the water rights access just a short walk away to the beautiful 172-acre Harris Pond perfect for fishing, kayaking, and relaxing days by the water. Features include a cozy wood-burning stove and a mound system already in place. With some TLC, this property has great potential. Whether you're looking for a weekend retreat or an investment opportunity this property is full of potential and natural beauty. This is your chance to own a slic
Key facts
- Newer septic system
- Wooded setting
- Harris pond
Tags
Property features AI
Finance
- Other: Over 1 acre to 2 acres (approximately 1.5 acres); Residential zoning
Exterior
- Utilities: Point well / sand point water; Private septic system; Power and other utilities as available
- Home design: Single-family, one-story home; Estimated 751-1000 sq ft; Located on main entry level
- Construction: Assessor/public record year built
- Exterior features: Vinyl exterior; Wooded lot; Deeded water access to Harris Pond; Pond access and water rights; Garden shed/outbuilding
Interior
- Kitchen: Main-level kitchen; Cooktop; Refrigerator
- Bedrooms: Main-level master bedroom (10 x 11); Main-level second bedroom (11 x 9)
- Bathrooms: One full bathroom with shower over tub
- Heating & cooling: Wood/coal heat; Window/wall air conditioning
- Interior features: Main-level living areas; Mud room on main level; Den/office on main level
- Laundry & utility: Window/wall AC (portable/window units noted)
Neighborhood map
What this means for you Summary
Snapshot
- This is a 2-bed/1.0-bath single-family listed at $80k. Condition is rated fair.
Deal economics
- At list price, monthly cash flow is $123 ($1k/yr) — positive.
- The deal already cash-flows at list — no discount required.
- Meets the 1% rule at list price ($855 rent vs $80k).
- Recommended offer: $75k (6.0% below list) — sets the bar for market timing.
Location & tenants
- Location reads: area grade C — affects rentability + tenant quality, not the cash-flow math above.
- Westfield School District (rural): math 39% / reading 37% proficiency, ranked #195 of 342 in WI (top 57%) — families likely to look elsewhere, expect single-tenant / working-renter base with shorter leases.
- Zoned schools: Westfield Area High (math 34% / reading 44%, grade F, #99 of 483 statewide, top 24%, 291 students, 44% FRL) — zoned schools at 44% FRL track the district average.
- Market conditions: 19 active listings in the ZIP; 95 units permitted in Marquette County in 2024 (0 in 5+ unit buildings).
Forward outlook
- Local home prices are declining (-3.0%/yr); year-one equity from $552 of loan paydown is wiped out by about $2k of value loss. Plan a longer hold.
- Marquette County population projected at -25% by 2050 — secular population decline; favor cash flow + early exit over multi-decade hold.
Negotiation context
- It's been on market 62 days — a 6% lower offer ($75k) is reasonable based on typical stale-listing flexibility.
- 2 sale attempts with the ask held roughly flat each time — persistent listings suggest the price (not the market) is what's stuck; bring a comps-based counter.
Risks & watch-outs
- Watch-outs: built in 1950 — expect roof / HVAC / electrical / plumbing capex.
Questions for the listing agent
- It's been on market 62 days. Have you received any prior offers? Is the seller open to a 6% concession, seller financing, or rate buy-down credit?
- Have any recent inspections been done? Can we get a copy of the seller's disclosures and any deferred-maintenance estimates?
- Built in 1950 — when were the roof, HVAC, electrical panel, plumbing, and water heater last replaced?
- Why hasn't it sold? Are there any deal-killer items the seller is aware of (foundation, flood, title, zoning, code violations)?
- Is there a deadline driving the sale (1031 exchange, divorce, estate, relocation)? That informs how much negotiation room exists.
- What's the average days-on-market for RENTAL listings here right now (not sales)? A rising rental-DOM trend means longer vacancies and softer asking-rent achievability than the comps imply.
- What's the recent tenant-quality profile in this submarket — average credit score on applications, eviction rate, late-payment / NSF rate, and stable-employment percentage? A property-management company in the area should have these aggregated.
- How much new for-sale + rental construction is in the pipeline within 1–3 miles? Heavy new supply typically softens prices + rents 12–24 months out; constrained supply supports both.
Investment metrics
- 1% rule
- 1.07% ✓
- Cap rate
- 8.15%
- Cash-on-cash
- 6.62%
- DSCR
- 1.29
- GRM
- 7.8
CMA / ARV
No comps found within radius.
Projected returns pro-forma
-3.0% appreciation · 3.0% rent growth · sell at horizon
- IRR
- -6.1%
- Equity multiple
- 0.77×
- Total profit
- $-5,076
- Equity at exit
- $11,913
- IRR
- 3.5%
- Equity multiple
- 1.26×
- Total profit
- $5,751
- Equity at exit
- $6,908
Cash invested: $22,372 (down + closing). Projections, not guarantees.
Landlord ↔ Tenant lean methodology
- Overall (STATE)
- 73 Landlord-Friendly
- State Wisconsin
- 73 Landlord-Friendly · R+2
- County
- — inherits STATE
- City
- — inherits STATE
ZIP-level market 53964
- Home prices YoY
- -12.3%
- Active inventory
- 19
- Price-to-rent
- 7.8×
Monthly cashflow live
- Estimated rent
- $855 medium interval (Pro) →
- Mortgage (P&I)
- −$419
- Tax est. 1.5%
- −$100 /mo · $1,198/yr
- Insurance
- −$33
- HOA
- −$0
- Vacancy / Maint / Mgmt
- −$180
- Net cashflow
- $123
Break-even live
UW: 25.0% down · 7.5% · 30yr · 1.5% tax · 5.0% vac · 8.0% maint · 8.0% mgmt
Financing live
Cash to close
- Down payment
- $19,975
- Closing costs
- $2,397
- Reserves months
- —
- Total cash needed
- —
Loan-product check · same deal, 3 products live
Conventional
25% down · 7.5% · 30yr
- Down + closing
- —
- Monthly P&I
- —
- Monthly cashflow
- —
- DSCR
- —
- Eligible?
- —
Personal DTI + credit; lowest rate.
DSCR
20% down · 8.5% · 30yr
- Down + closing
- —
- Monthly P&I
- —
- Monthly cashflow
- —
- DSCR
- —
- Eligible?
- —
No personal income docs; deal must DSCR.
Hard money
10% down · 12.0% · 12mo
- Down + closing
- —
- Monthly P&I
- —
- Monthly cashflow
- —
- DSCR
- —
- Eligible?
- —
Short-term bridge; refi at stabilization.
Listing history 17 events
-
2026-06-18days on market $79,900 Active 62 DOM
-
2026-06-17days on market $79,900 Active 61 DOM
-
2026-06-16days on market $79,900 Active 60 DOM
-
2026-06-15days on market $79,900 Active 59 DOM
-
2026-06-14days on market $79,900 Active 57 DOM
-
2026-06-10days on market $79,900 Active 54 DOM
-
2026-06-09days on market $79,900 Active 53 DOM
-
2026-06-08days on market $79,900 Active 52 DOM
-
2026-06-07days on market $79,900 Active 51 DOM
-
2026-06-03days on market $79,900 Active 47 DOM
-
2026-06-02days on market $79,900 Active 46 DOM
-
2026-06-01days on market $79,900 Active 45 DOM
-
2026-05-31days on market $79,900 Active 44 DOM
-
2026-05-31days on market $79,900 Active 43 DOM
-
2026-05-03status Active
-
2026-04-21historical Contingent
-
2026-04-17$79,900 Active
ⓘ Source: listings_history table (triggers on properties + properties_extension) + one-shot
backfill from property_details.listing_events for pre-trigger history.
Climate risk First Street
- Flood 1/10 Low FEMA zone X (unshaded) · 0% chance over 30 yrs
- Wildfire 3/10 Moderate
- Heat 2/10 Low 7 d/yr ≥100°F today · 13 d/yr by 30 yrs out
- Wind 2/10 Low
- Air quality 2/10 Low 0 unhealthy d/yr today · 1 by 30 yrs out
Nearby sold comps map
Loading sold comps map…
Walkable amenities ~0.75 mi
Loading nearby amenities…
Taxation est. · year 1
- Rental income
- $10,262
- − Mortgage interest
- −$4,476
- − Property taxes
- −$1,198
- − Insurance
- −$400
- − Repairs & maintenance
- −$821
- − Management
- −$821
- − Depreciation
- −$2,324
- Taxable income
- $222
- Est. tax owed @ 24.0%
- −$53
- After-tax cash flow
- $1,427/yr
For passive investors: Depreciation is non-cash, so a rental often shows a tax loss while cash-flowing — sheltering income. Rental losses are passive: they offset passive income freely, and up to $25,000/yr can offset ordinary (W-2) income if you actively participate and your MAGI is under $100k (phasing out to $0 by $150k); unused losses carry forward. On sale, claimed depreciation is recaptured at up to 25%, and gains may owe capital-gains tax (a 1031 exchange can defer both). Figures are a year-1 estimate at your 24.0% rate — not tax advice; consult a CPA.
Condition & rehab AI · 13 photos
This property presents a moderate renovation opportunity with significant repairs and maintenance needed to improve its condition and value.
Repairs flagged
- Major roof — The roof appears to be in poor condition, with visible wear and tear.
- Major siding — The siding is peeling and the paint is chipping, indicating a need for repainting and possibly replacing the siding.
- Major flooring — The flooring in the interior appears to be carpeted and in poor condition, with visible wear and tear.
- Major interior walls — The interior walls appear to be in poor condition, with visible wear and tear.
- Major landscaping — The landscaping is overgrown and the fencing is in poor condition.
- Major HVAC — The HVAC system appears to be in poor condition, with visible wear and tear.
Value-add opportunities
- Resale repainting the siding and replacing the roof — Repainting the siding and replacing the roof would significantly improve the home's curb appeal and overall condition, making it more attractive to potential buyers.
- Resale upgrading the HVAC system — Upgrading the HVAC system would improve the home's comfort and energy efficiency, making it more attractive to potential buyers.
- Both landscaping and fencing — Landscaping and fencing would improve the home's curb appeal and overall condition, making it more attractive to potential buyers and renters.
Renovation cost estimate screening
| Repair item | Severity | Est. cost |
|---|---|---|
| roof · The roof appears to be in poor condition, with visible wear and tear. | Major | $15,000–50,000 |
| siding · The siding is peeling and the paint is chipping, indicating a need for repainting and possibly replacing the siding. | Major | $15,000–50,000 |
| flooring · The flooring in the interior appears to be carpeted and in poor condition, with visible wear and tear. | Major | $15,000–50,000 |
| interior walls · The interior walls appear to be in poor condition, with visible wear and tear. | Major | $15,000–50,000 |
| landscaping · The landscaping is overgrown and the fencing is in poor condition. | Major | $15,000–50,000 |
| HVAC · The HVAC system appears to be in poor condition, with visible wear and tear. | Major | $15,000–50,000 |
| Total estimated repair cost · 6 items | $90,000–300,000 |
Value-add ROI direction
- Resale repainting the siding and replacing the roof — Repainting the siding and replacing the roof would significantly improve the home's curb appeal and overall condition, making it more attractive to potential buyers. ↑
- Resale upgrading the HVAC system — Upgrading the HVAC system would improve the home's comfort and energy efficiency, making it more attractive to potential buyers. ↑
- Both landscaping and fencing — Landscaping and fencing would improve the home's curb appeal and overall condition, making it more attractive to potential buyers and renters. ↑
ⓘ Cost ranges are severity-bucket heuristics (US national rule-of-thumb). Get contractor quotes + a written scope before underwriting a rehab budget.
Schools (NCES district)
- District
- Westfield School District
- NCES district ID
- 5516440
- Math proficiency
- 39% ▲ 4.00%
- Reading proficiency
- 37% ▬ 0.00%
- Median HH income
- $46,419
- Composite
- 32.51/100
- National rank
- #5702
- State rank
- #195 of 342 in WI
Livability — Harris
No livability data for this city. (Only ~50 U.S. cities are tracked.)
Census & demographics
- Population (ZIP)
- 3,475
Population outlook (Marquette County) Hauer SSP2
- Today (2025)
- 14,049 people
- By 2030
- 13,362 · -4.9%
- By 2040
- 11,850 · -15.7%
- By 2050
- 10,519 · -25.1%
- By 2075
- 8,457 · -39.8%
- By 2100
- 7,077 · -49.6%
Race, ethnicity, and origin ACS 2023
- Neighborhood character
- Predominantly White (91%)
- Race & ethnicity
- White 91% Hispanic / Latino 4% Two or more races 3% Asian 1%
- Common ancestry
- Romanian 8% Portuguese 7% Lithuanian 3%
- Foreign-born
- 3% · Canada
- Languages at home
- 94% English-only · Spanish 4% German/W. Germanic 2%
Political lean MEDSL · Marquette
- 2024 margin
- Strong R (+29.6) · D 34.6% · R 64.2% · Other 1.2%
- 2008→2024 swing
- -34.9pp toward R · 2008: 5.3pp · 2024: -29.6pp
- All cycles
- 2024: R+29.6 2020: R+27.4 2016: R+24.4 2012: D+4.5 2008: D+5.3
Not yet ingested
- Civics
- —
Market trends
- HPI YoY
- ▼ -31.65%
- Current HPI
- 225.2727
- Rent YoY
- —
- Metro
- —
- State GDP YoY
- ▲ 2.10%
- F500 in state
- 20
Industry mix (Fortune 500 HQ in WI)
| Industry | F500 HQs | Revenue |
|---|---|---|
| Industrial Machinery | 4 | $23B |
|
||
| Industrial Technology | 2 | $36B |
|
||
| Insurance | 1 | $36B |
|
||
| Professional Services | 1 | $19B |
|
||
| Utilities | 1 | $9B |
|
||
| Consumer Goods | 1 | $3B |
|
||
Price history
3 events — show timeline
- 2026-05-03 Relisted — METROMLS
- 2026-04-21 Contingent — METROMLS
- 2026-04-17 Listed $79,900 METROMLS
Cash-flow waterfall
monthlySold comps — $/sqft
last 12 mo · ≤1 miLoading sold comps…