9015 Landis Dr · Beaumont, TX
Flood risk 6/10 · Moderate
- FEMA flood zone
- X
- Chance of flooding over 30 yrs
- 0.74%
- Est. flood insurance / yr
- $507 – $1,088
Fire risk 2/10 · Minimal
- Est. fire insurance / yr
- $1,222 – $2,270
Heat risk 9/10 · Severe
- Hot days now (above 110°F)
- 7 days/yr
- Hot days in 30 yrs
- 24 days/yr
Wind risk 9/10 · Severe
- Chance of severe wind over 30 yrs
- 99.0%
Air-quality risk 2/10 · Minimal
- Unhealthy air days now
- 1 days/yr
- Unhealthy air days in 30 yrs
- 1 days/yr
Risk factors via First Street. Map © Google.
Why this score? — see what drove the B- grade
The composite is a weighted blend of 9 inputs, each scored 0–100. Each bar is that input's sub-score; the figure is the points it added to the 100-point composite (weight × sub-score).
- Cash flow +25.4/30.0
- ARV discount +14.6/15.0
- DSCR +8.4/10.0
- 1% rule +7.7/10.0
- Livability +3.2/5.0
- Rent growth +2.5/5.0
- Condition / age +2.5/5.0
- Schools +1.5/10.0
- Appreciation +0.0/10.0
$135,000
🖨 Deal sheet 📄 Offer letter ✓ Due diligence
Listing remarks
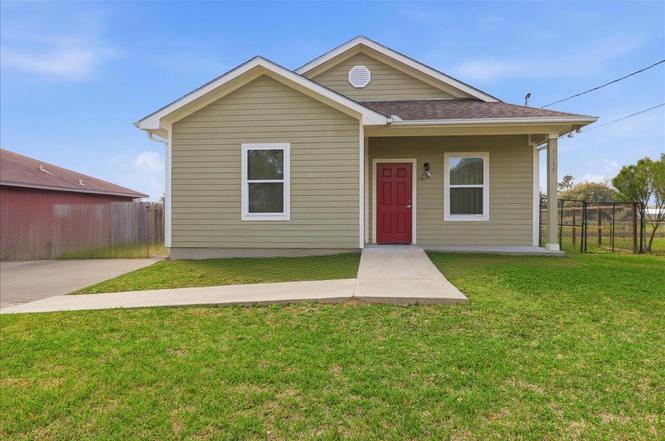
This well-maintained single-story residence offers 2 bedrooms, 2 full bathrooms, and approximately 1,281 square feet of living space with an open-concept floor plan designed for comfortable everyday living. The interior features tile and luxury vinyl plank flooring throughout, creating a clean and low-maintenance living environment. The spacious primary suite includes two closets and a private bathroom, while the secondary bedroom is conveniently located near the second full bath. The kitchen opens to the main living area and includes solid surface countertops, pantry storage, and modern appliances, with an inside utility room located just off the kitchen for added convenience.
Key facts
- Pantry storage
- Modern appliances
- Tile flooring
Tags
Property features AI
Exterior
- Parking: Driveway
- Security: Smoke detectors
- Utilities: Public water; Public sewer
- Home design: Residential property; Built in 2020; Slab foundation; Composition roof
- Construction: Construction materials: Unknown
- Exterior features: Covered patio; Deck; Patio; Porch; Fenced backyard; Workshop structure
Interior
- Kitchen: Dishwasher; Electric oven; Electric range / free-standing range; Microwave; Garbage disposal; Refrigerator
- Bedrooms: Primary bedroom on the first floor (approx. 13'11" x 14'6"); Bedroom on the first floor (approx. 13'11" x 11'7")
- Flooring: Plank flooring; Vinyl flooring
- Bathrooms: Two full bathrooms; Primary bathroom on the first floor (approx. 8'0" x 9'6"); Additional bathroom on the first floor (approx. 9'11" x 10'5")
- Heating & cooling: Central heating (electric); Central air conditioning (electric)
- Interior features: Butler's pantry; Double vanity in bathroom; Granite counters; Pots & pan drawers; Tub with shower; Ceiling fans; Combined living and dining area; Accessible full bath; Storm windows
- Laundry & utility: Washer hookup; Electric dryer hookup
Neighborhood map
What this means for you Summary
Snapshot
- This is a 2-bed/2.0-bath single-family listed at $135k.
Deal economics
- At list price, monthly cash flow is $313 ($4k/yr) — positive.
- The deal already cash-flows at list — no discount required.
- Meets the 1% rule at list price ($2k rent vs $135k).
- Recommended offer: $131k (3.0% below list) — sets the bar for market timing.
- Cap rate 9.1% vs local median 5.3% in Beaumont — top-decile yield for the area; either an underpriced asset or a hidden risk that comps aren't pricing in. Stress-test before assuming the spread holds.
Location & tenants
- Location reads 64/100 on livability (#739 in TX) — a middle-class / working-renter tenant base. Strengths: cost of living A+, housing A+, health & safety A+; Watch: employment D, crime F, amenities F.
- Beaumont ISD (urban): math 14% / reading 22% proficiency, ranked #789 of 826 in TX (top 96%) — low school quality limits family demand, transient renter base, plan for 1-2y turnover; 69% free/reduced lunch — lower-income household profile, screen leases tightly.
- Zoned schools: Vincent Middle (math 8% / reading 17%, grade F, #1,616 of 1,662 statewide, top 97%, 688 students, 75% FRL); West Brook Sr H S (math 19% / reading 34%, grade F, #1,228 of 1,632 statewide, top 76%, 2,245 students, 58% FRL) — zoned schools at 66% FRL track the district average.
- Market conditions: 151 active listings in the ZIP; 15 comparable units currently listed for rent nearby; rentals lingering (median 44d on market — plan ~5-8 weeks vacancy on turnover, expect pricing pressure); 60% of comp listings sitting > 30 days — soft ceiling on asking rent; 343 units permitted in Jefferson County in 2024 (0 in 5+ unit buildings).
Forward outlook
- Local home prices are declining (-3.0%/yr); year-one equity from $933 of loan paydown is wiped out by about $4k of value loss. Plan a longer hold.
Negotiation context
- It's been on market 57 days — a 3% lower offer ($131k) is reasonable based on typical stale-listing flexibility.
Risks & watch-outs
- Climate carrying-cost: major flood risk; severe wind risk, 99% chance of damaging wind over 30y; extreme-heat days projected 7→24/yr by 2055 (HVAC capex compounding) — expect insurance premiums to compound above CPI over the hold.
Questions for the listing agent
- It's been on market 57 days. Have you received any prior offers? Is the seller open to a 3% concession, seller financing, or rate buy-down credit?
- Is there a deadline driving the sale (1031 exchange, divorce, estate, relocation)? That informs how much negotiation room exists.
- Schools are D-rated, which usually means shorter tenancies and higher turnover. Who's the typical renter profile here, and what's been the actual vacancy rate?
- Crime grade is F in this area — have there been break-ins, vandalism, or insurance claims at this property in the last 3 years? What carrier currently insures it and at what premium?
- What's the average days-on-market for RENTAL listings here right now (not sales)? A rising rental-DOM trend means longer vacancies and softer asking-rent achievability than the comps imply.
- What's the recent tenant-quality profile in this submarket — average credit score on applications, eviction rate, late-payment / NSF rate, and stable-employment percentage? A property-management company in the area should have these aggregated.
- How much new for-sale + rental construction is in the pipeline within 1–3 miles? Heavy new supply typically softens prices + rents 12–24 months out; constrained supply supports both.
Investment metrics
- 1% rule
- 1.27% ✓
- Cap rate
- 9.07%
- Cash-on-cash
- 9.93%
- DSCR
- 1.44
- GRM
- 6.6
CMA / ARV
- ARV (on-the-fly)
- $160,125
- Comps found
- 10
Show comp detail 10 sales within ~0.75 mi
| Address | Dist | Beds/Ba | Sqft | Sold | Price | $/sf | Match |
|---|---|---|---|---|---|---|---|
| 9015 Landis Dr | 0.00mi | 2/2.0 | 1,281 (0%) | 1mo | $135,000 | $105 | 100 |
| 9510 Shepherd Dr | 0.66mi | 3/2.0 (+1) | 1,302 (+2%) | 1mo | $182,000 | $140 | 61 |
| 8675 Braeburn St | 0.47mi | 3/2.0 (+1) | 1,269 (-1%) | 15mo | $169,900 | $134 | 59 |
| 9410 Guy Cir | 0.61mi | 3/1.5 (+1) | 1,282 (+0%) | 10mo | $178,000 | $139 | 57 |
| 120 Smelker St | 0.49mi | 2/2.0 | 1,275 (-0%) | 24mo | $159,900 | $125 | 56 |
| 1745 Shirley Cir | 0.70mi | 3/2.0 (+1) | 1,366 (+7%) | 8mo | $195,000 | $143 | 45 |
| 9310 Josey St | 0.45mi | 3/2.0 (+1) | 1,408 (+10%) | 16mo | $69,000 | $49 | 44 |
| 9310 Shepherd Dr | 0.52mi | 3/1.0 (+1) | 1,131 (-12%) | 5mo | $112,900 | $100 | 43 |
| 9385 Shepherd Dr | 0.56mi | 3/1.0 (+1) | 1,148 (-10%) | 9mo | $139,000 | $121 | 40 |
| 9610 Josey St | 0.68mi | 3/2.0 (+1) | 1,192 (-7%) | 16mo | $100,000 | $84 | 39 |
Match score weights: distance 35% · size 25% · config 20% · recency 20%. Top-matched comps best support the ARV.
Projected returns pro-forma
-3.0% appreciation · 3.0% rent growth · sell at horizon
- IRR
- -1.3%
- Equity multiple
- 0.95×
- Total profit
- $-1,866
- Equity at exit
- $20,129
- IRR
- 8.4%
- Equity multiple
- 1.65×
- Total profit
- $24,398
- Equity at exit
- $11,672
Cash invested: $37,800 (down + closing). Projections, not guarantees.
Landlord ↔ Tenant lean methodology
- Overall (STATE)
- 87 Strongly Landlord-Friendly
- State Texas
- 87 Strongly Landlord-Friendly · R+5
- County
- — inherits STATE
- City
- — inherits STATE
ZIP-level market 77707
- Active inventory
- 151
- Price-to-rent
- 6.6×
Monthly cashflow live
- Estimated rent
- $1,714 high interval (Pro) →
- Mortgage (P&I)
- −$708
- Tax from tax record
- −$277 /mo · $3,325/yr
- Insurance
- −$56
- HOA
- −$0
- Vacancy / Maint / Mgmt
- −$360
- Net cashflow
- $313
Break-even live
UW: 25.0% down · 7.5% · 30yr · 1.5% tax · 5.0% vac · 8.0% maint · 8.0% mgmt
Financing live
Cash to close
- Down payment
- $33,750
- Closing costs
- $4,050
- Reserves months
- —
- Total cash needed
- —
Loan-product check · same deal, 3 products live
Conventional
25% down · 7.5% · 30yr
- Down + closing
- —
- Monthly P&I
- —
- Monthly cashflow
- —
- DSCR
- —
- Eligible?
- —
Personal DTI + credit; lowest rate.
DSCR
20% down · 8.5% · 30yr
- Down + closing
- —
- Monthly P&I
- —
- Monthly cashflow
- —
- DSCR
- —
- Eligible?
- —
No personal income docs; deal must DSCR.
Hard money
10% down · 12.0% · 12mo
- Down + closing
- —
- Monthly P&I
- —
- Monthly cashflow
- —
- DSCR
- —
- Eligible?
- —
Short-term bridge; refi at stabilization.
Rent comps 15 comps
| Address | Beds | Baths | Sqft | Rent | $/sqft | DOM | Units | Dist |
|---|---|---|---|---|---|---|---|---|
| 9260 Josey St Beaumont, TX | 3.0 | 2.0 | 1500 | $2,100 | $1.40 | 43d | 1 | 0.43mi |
| 9225 Shepherd Dr Beaumont, TX | 3.0 | 1.0 | 1136 | $1,495 | $1.32 | 43d | 1 | 0.49mi |
| 120 Smelker St Beaumont, TX | 3.0 | 2.0 | 1300 | $1,795 | $1.38 | 13d | 1 | 0.51mi |
| 9245 Shepherd Dr Beaumont, TX | 3.0 | 1.0 | 1003 | $1,350 | $1.35 | 13d | 1 | 0.51mi |
| 2065 88th Cir Beaumont, TX | 3.0 | 2.0 | 1750 | $1,800 | $1.03 | 23d | 1 | 0.71mi |
| 1625 Glendale St Beaumont, TX | 3.0 | 2.0 | 1330 | $1,800 | $1.35 | 43d | 1 | 0.79mi |
| 405 Harbor Oaks Dr Beaumont, TX | 3.0 | 2.5 | 1828 | $2,600 | $1.42 | 23d | 1 | 0.83mi |
| 434 Harbor Oaks Dr Beaumont, TX | 3.0 | 2.0 | 1844 | $2,500 | $1.36 | 23d | 1 | 0.86mi |
| 8960 Manion Dr Beaumont, TX | 2.0 | 2.5 | 1358 | $1,550 | $1.14 | 43d | 1 | 1.24mi |
| 379 Pinchback Rd Beaumont, TX | 2.0 | 1.5 | 1254 | $1,175 | $0.94 | 43d | 1 | 1.29mi |
| 976 Sunmeadow Dr Beaumont, TX | 3.0 | 2.5 | 1656 | $1,995 | $1.20 | 13d | 1 | 1.32mi |
| 976 Sunmeadow Dr Unit 05/04/26 Beaumont, TX | 3.0 | 2.5 | 1656 | $2,150 | $1.30 | 43d | 1 | 1.32mi |
| 6860 Prutzman Rd Unit 18 Beaumont, TX | 2.0 | 1.0 | 884 | $1,100 | $1.24 | 43d | 1 | 1.33mi |
| 1069 Green Meadow St Beaumont, TX | 2.0 | 2.0 | 1556 | $1,795 | $1.15 | 44d | 1 | 1.34mi |
| 9252 Glen Meadow Ln Beaumont, TX | 2.0 | 1.0 | 929 | $1,250 | $1.35 | 43d | 1 | 1.45mi |
Listing history 5 events
-
2026-05-04status Pending
-
2026-04-22status Pending
-
2026-04-09price $135,000
-
2026-03-07$149,000 Active
-
2005-03-03soldstatus
ⓘ Source: listings_history table (triggers on properties + properties_extension) + one-shot
backfill from property_details.listing_events for pre-trigger history.
Tax reassessment forecast TX · Resets to sale price
- Current annual tax
- $3,325 · $277/mo
- Projected year-2 tax
- $3,325 · $277/mo
- Expected delta
- $0/yr ($0/mo · 0.0%)
ⓘ Screening estimate from a state-policy table — verify with the county assessor before closing.
Climate risk First Street
- Flood 6/10 Major FEMA zone X · 74% chance over 30 yrs
- Wildfire 2/10 Low
- Heat 9/10 Extreme 7 d/yr ≥110°F today · 24 d/yr by 30 yrs out
- Wind 9/10 Extreme 99% chance of damaging wind over 30 yrs
- Air quality 2/10 Low 1 unhealthy d/yr today · 1 by 30 yrs out
Nearby sold comps map
Loading sold comps map…
Walkable amenities ~0.75 mi
Loading nearby amenities…
Taxation est. · year 1
- Rental income
- $20,567
- − Mortgage interest
- −$7,562
- − Property taxes
- −$3,325
- − Insurance
- −$675
- − Repairs & maintenance
- −$1,645
- − Management
- −$1,645
- − Depreciation
- −$3,927
- Taxable income
- $1,787
- Est. tax owed @ 24.0%
- −$429
- After-tax cash flow
- $3,324/yr
For passive investors: Depreciation is non-cash, so a rental often shows a tax loss while cash-flowing — sheltering income. Rental losses are passive: they offset passive income freely, and up to $25,000/yr can offset ordinary (W-2) income if you actively participate and your MAGI is under $100k (phasing out to $0 by $150k); unused losses carry forward. On sale, claimed depreciation is recaptured at up to 25%, and gains may owe capital-gains tax (a 1031 exchange can defer both). Figures are a year-1 estimate at your 24.0% rate — not tax advice; consult a CPA.
Schools (NCES district)
- District
- Beaumont ISD
- NCES district ID
- 4809670
- Math proficiency
- 14% ▼ -13.00%
- Reading proficiency
- 22% ▼ -7.00%
- Median HH income
- $41,683
- Composite
- 15.43/100
- National rank
- #9316
- State rank
- #789 of 826 in TX
Livability — Beaumont
- Score
- 64/100
- State rank
- #739
- US rank
- #13710
Category grades
Schools grade is shown separately in the Schools card above.
Census & demographics
- Census place
- Beaumont, TX
- County
- Jefferson County · 203,592 people
- City population
- 125,901
- Metro
- Beaumont-Port Arthur, TX
- Population (ZIP)
- 18,323
- Household income
- $69,756
- Rent vs Own
- Severe rent burden
- 596.0
Population outlook (Jefferson County) Hauer SSP2
- Today (2025)
- 259,015 people
- By 2030
- 260,685 · +0.6%
- By 2040
- 263,309 · +1.7%
- By 2050
- 265,237 · +2.4%
- By 2075
- 270,193 · +4.3%
- By 2100
- 255,628 · -1.3%
Race, ethnicity, and origin ACS 2023
- Neighborhood character
- Highly diverse neighborhood (Simpson 0.70)
- Race & ethnicity
- Black 40% White 28% Hispanic / Latino 23% Two or more races 18% Asian 6%
- Hispanic origin (detail)
- Mexican 19%
- Common ancestry
- Lithuanian 3% Italian 1% Romanian 1%
- Foreign-born
- 12% · Canada, Vietnam
- Languages at home
- 75% English-only · Spanish 19% Vietnamese 3% Other Indo-European 1%
Political lean MEDSL · Jefferson
- 2024 margin
- Lean R (+8.9) · D 45.1% · R 54.0%
- 2008→2024 swing
- -11.1pp toward R · 2008: 2.2pp · 2024: -8.9pp
- All cycles
- 2024: R+8.9 2020: R+1.6 2016: R+0.5 2012: D+1.6 2008: D+2.2
Not yet ingested
- Civics
- —
Market trends
- HPI YoY
- ▼ -163.16%
- Current HPI
- 167.8109
- Rent YoY
- —
- Metro
- Beaumont-Port Arthur, TX
- State GDP YoY
- ▲ 3.95%
- F500 in state
- 110
Industry mix (Fortune 500 HQ in TX)
| Industry | F500 HQs | Revenue |
|---|---|---|
| Energy | 16 | $1,198B |
|
||
| Technology | 5 | $198B |
|
||
| Engineering / Construction | 4 | $72B |
|
||
| Energy Services | 3 | $60B |
|
||
| Utilities | 3 | $41B |
|
||
| Healthcare | 2 | $330B |
|
||
Price history
-9.4% since first listed5 events — show timeline
- 2026-05-04 Pending — HARMLS
- 2026-04-22 Pending — HARMLS
- 2026-04-09 Price Changed $135,000 HARMLS
- 2026-03-07 Listed $149,000 HARMLS
- 2005-03-03 Sold (Public Records) — Public Records
Property tax history
+5.5%/yrLatest (2025): $3,325 · +9.1% YoY. Source: county tax records.
Cash-flow waterfall
monthlySold comps — $/sqft
last 12 mo · ≤1 miLoading sold comps…