 🏗️ New Construction
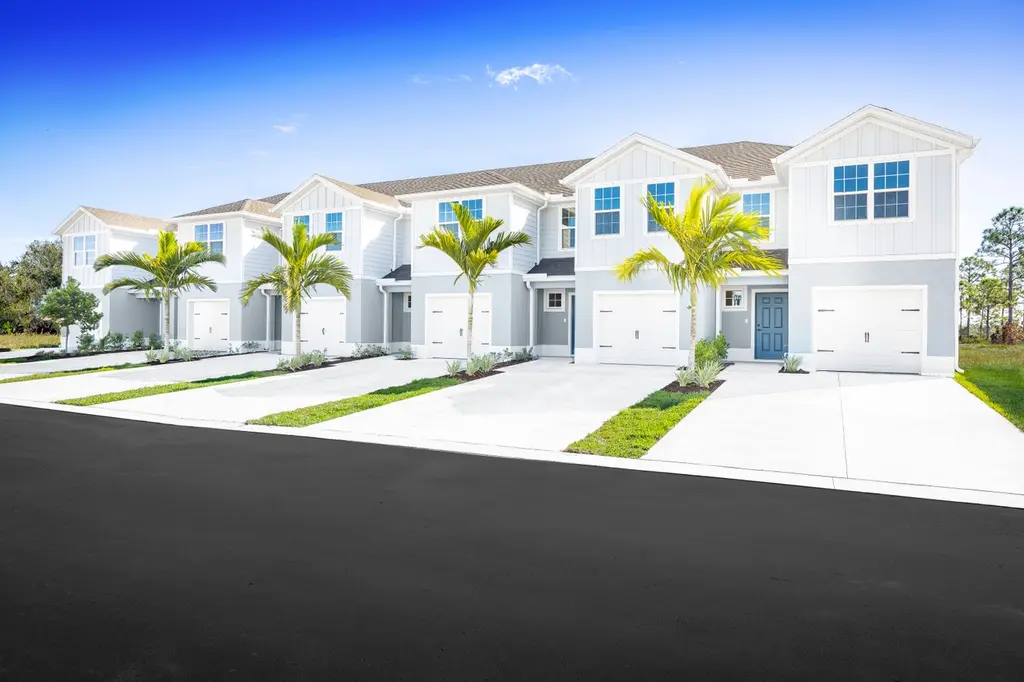
Piper Plan · Indiantown, FL
Flood risk 1/10 · Minimal
- FEMA flood zone
- X (unshaded)
- Chance of flooding over 30 yrs
- 0.0%
- Est. flood insurance / yr
- $507 – $1,088
Fire risk 6/10 · Moderate
- Est. fire insurance / yr
- $947 – $1,759
Heat risk 9/10 · Severe
- Hot days now (above 108°F)
- 7 days/yr
- Hot days in 30 yrs
- 24 days/yr
Wind risk 10/10 · Severe
- Chance of severe wind over 30 yrs
- 99.0%
Air-quality risk 2/10 · Minimal
- Unhealthy air days now
- 0 days/yr
- Unhealthy air days in 30 yrs
- 1 days/yr
Risk factors via First Street. Map © Google.
Why this score? — see what drove the C- grade
The composite is a weighted blend of 9 inputs, each scored 0–100. Each bar is that input's sub-score; the figure is the points it added to the 100-point composite (weight × sub-score).
- Cash flow +12.6/30.0
- Appreciation +8.3/10.0
- ARV discount +7.5/15.0
- 1% rule +5.0/10.0
- Schools +4.5/10.0
- Condition / age +4.0/5.0
- DSCR +3.7/10.0
- Livability +3.0/5.0
- Rent growth +2.5/5.0
$253,990
🖨 Deal sheet (PDF) 📄 Offer letter ✓ Due diligence
Listing remarks
The Piper is the perfect combination of efficient space and endless style. This one-car garage floor plan offers a warm and welcoming feeling from the first step. Gather with friends and family in the large great room. The adjoining gourmet kitchen features a central island and connected dining space. Enjoy the fresh air outside on your optional lanai or patio. Upstairs, two spacious bedrooms share a hall bath. Your grand owner's suite exudes luxury, with its dual vanity bath and expansive walk-in closet. It will only take one look to see that the Piper is just right for you.
Key facts
- Central island
- One car garage
- Gourmet kitchen
Tags
Property features AI
Finance
- Other: List price $253,990
- HOA & community: Association fee approximately $289 (period not specified)
Exterior
- Parking: 1 garage parking space (1 total parking)
- Utilities: Central air (electric cooling)
- Home design: Single-family plan home (Piper); Listed as Active
- Exterior features: Living area approximately 1,466 (plan)
Interior
- Bedrooms: 3 bedrooms
- Bathrooms: 2 full bathrooms and 1 half bathroom (2.5 total)
- Heating & cooling: Central air conditioning
- Interior features: Plan-based new construction (Piper plan)
Neighborhood map
What this means for you Summary
Snapshot
- This is a 3-bed/2.5-bath townhouse listed at $254k. Condition is rated good.
Deal economics
- At list price, monthly cash flow is $-35 ($-418/yr) — negative.
- To cash-flow at today's rent, offer at most $249k (2.0% below list).
- Meets the 1% rule at list price ($3k rent vs $254k).
- Recommended offer: $249k (2.0% below list) — sets the bar for cash-flow.
- Cap rate 6.1% vs local median 11.7% in Indiantown — below-typical yield; the buyer is paying a premium for something (appreciation thesis, condition, location) that the cap rate doesn't capture.
Location & tenants
- Location reads 59/100 on livability (#829 in FL) — a working-class tenant base; expect higher turnover. Strengths: cost of living A+, housing A+; Watch: amenities F, commute F, employment F.
- Martin (suburban): math 52% / reading 53% proficiency, ranked #24 of 73 in FL (top 33%) — acceptable for families but not a draw, mixed tenant base, ~2y average lease.
- Zoned schools: Warfield Elementary School (math 22% / reading 19%, grade F, #2,094 of 2,144 statewide, top 98%, 686 students, 79% FRL); Indiantown Middle School (math 42% / reading 29%, grade F, #414 of 571 statewide, top 73%, 646 students, 75% FRL); South Fork High School (math 36% / reading 48%, grade F, #275 of 667 statewide, top 42%, 1,810 students, 51% FRL) — zoned schools average 68% FRL vs 41% district-wide (27 pts higher); higher-poverty schools than district average — tighter screening recommended.
- Zoned-school proficiency averages 33% at this address vs 52% district-wide (-20 pts) — the specific schools serving this property underperform the Martin average; the district grade overstates school quality for this exact location.
- Market conditions: 136 active listings in the ZIP; 3 comparable units currently listed for rent nearby; rentals at typical pace (median 16d on market — plan ~3-4 weeks tenant-placement turnaround); 737 units permitted in Martin County in 2024 (167 in 5+ unit buildings).
Forward outlook
- In year one you build about $19k of equity ($2k loan paydown + $17k appreciation (6.7% local appreciation)).
- Martin County population projected at +19% by 2050 — long-run rental-demand tailwind backs the buy-and-hold thesis.
- At projected returns (6.7% appreciation + 3.0% rent growth), your $71k cash investment doubles in ~4 years — after that, you're playing with house money.
- By year 3, paydown + projected appreciation supports a ~$46k cash-out refi (75% LTV) — recoverable capital for the next deal without selling this one.
Negotiation context
- Only 3 days on market — expect competitive offers; lowballing is unlikely to land.
Risks & watch-outs
- Climate carrying-cost: severe wind risk, 99% chance of damaging wind over 30y; major wildfire risk; extreme-heat days projected 7→24/yr by 2055 (HVAC capex compounding) — expect insurance premiums to compound above CPI over the hold.
Questions for the listing agent
- What do current leases actually rent for vs. the listed asking? Can we see a recent rent roll and the last 12 months of T-12 income?
- What does the HOA fee cover, when was the last increase, and are there any pending special assessments or reserve-fund shortfalls?
- Is there a deadline driving the sale (1031 exchange, divorce, estate, relocation)? That informs how much negotiation room exists.
- Schools are F-rated, which usually means shorter tenancies and higher turnover. Who's the typical renter profile here, and what's been the actual vacancy rate?
- What's the average days-on-market for RENTAL listings here right now (not sales)? A rising rental-DOM trend means longer vacancies and softer asking-rent achievability than the comps imply.
- What's the recent tenant-quality profile in this submarket — average credit score on applications, eviction rate, late-payment / NSF rate, and stable-employment percentage? A property-management company in the area should have these aggregated.
- How much new for-sale + rental construction is in the pipeline within 1–3 miles? Heavy new supply typically softens prices + rents 12–24 months out; constrained supply supports both.
Investment metrics
- 1% rule
- 1.00% ✓
- Cap rate
- 6.13%
- Cash-on-cash
- -0.59%
- DSCR
- 0.97
- GRM
- 8.3
CMA / ARV
No comps found within radius.
Projected returns pro-forma
6.65% appreciation · 3.0% rent growth · sell at horizon
- IRR
- 16.5%
- Equity multiple
- 2.14×
- Total profit
- $81,267
- Equity at exit
- $170,238
- IRR
- 16.2%
- Equity multiple
- 4.36×
- Total profit
- $238,982
- Equity at exit
- $318,280
Cash invested: $71,117 (down + closing). Projections, not guarantees.
Landlord ↔ Tenant lean methodology
- Overall (STATE)
- 87 Strongly Landlord-Friendly
- State Florida
- 87 Strongly Landlord-Friendly · R+3
- County
- — inherits STATE
- City
- — inherits STATE
ZIP-level market 34956
- Home prices YoY
- 1.2%
- Active inventory
- 136
- Price-to-rent
- 8.3×
Monthly cashflow live
- Estimated rent
- $2,544 medium interval (Pro) →
- Mortgage (P&I)
- −$1,332
- Tax est. 1.5%
- −$317 /mo · $3,810/yr
- Insurance
- −$106
- HOA
- −$289
- Vacancy / Maint / Mgmt
- −$534
- Net cashflow
- $-35
Break-even live
Sensitivity live
| Price | -10% $141 | -5% $53 | +0% $-35 | +5% $-123 | +10% $-210 |
|---|---|---|---|---|---|
| Rent | -10% $-236 | -5% $-135 | +0% $-35 | +5% $66 | +10% $166 |
| Rate | -1.0pp $93 | -0.5pp $30 | base $-35 | +0.5pp $-101 | +1.0pp $-168 |
UW: 25.0% down · 7.5% · 30yr · 1.5% tax · 5.0% vac · 8.0% maint · 8.0% mgmt
Financing live
Cash to close
- Down payment
- $63,498
- Closing costs
- $7,620
- Reserves months
- —
- Total cash needed
- —
Loan-product check · same deal, 3 products live
Conventional
25% down · 7.5% · 30yr
- Down + closing
- —
- Monthly P&I
- —
- Monthly cashflow
- —
- DSCR
- —
- Eligible?
- —
Personal DTI + credit; lowest rate.
DSCR
20% down · 8.5% · 30yr
- Down + closing
- —
- Monthly P&I
- —
- Monthly cashflow
- —
- DSCR
- —
- Eligible?
- —
No personal income docs; deal must DSCR.
Hard money
10% down · 12.0% · 12mo
- Down + closing
- —
- Monthly P&I
- —
- Monthly cashflow
- —
- DSCR
- —
- Eligible?
- —
Short-term bridge; refi at stabilization.
Rent comps 3 comps
| Address | Beds | Baths | Sqft | Rent | $/sqft | DOM | Units | Dist |
|---|---|---|---|---|---|---|---|---|
| 15817 SW Winter Rd Indiantown, FL | 3.0 | 2.5 | 1428 | $2,300 | $1.61 | 16d | 1 | 0.03mi |
| 15404 SW American St Indiantown, FL | 4.0 | 2.0 | 1850 | $3,000 | $1.62 | 16d | 1 | 0.15mi |
| 15760 SW Hammock Way Indiantown, FL | 3.0–4.0 | 2.0–3.5 | 1918 | $2,420 | $1.26 | 0d | 40 | 0.95mi |
HOA detail
- Monthly dues
- $289 · $3,468/yr
Listing history 19 events
-
2026-06-21days on market $253,990 Active 3 DOM
-
2026-06-18days on market $253,990 Active 1 DOM
-
2026-06-17days on market $253,990 Active 13 DOM
-
2026-06-16days on market $253,990 Active 12 DOM
-
2026-06-15days on market $253,990 Active 11 DOM
-
2026-06-14days on market $253,990 Active 9 DOM
-
2026-06-13days on market $253,990 Active 8 DOM
-
2026-06-10days on market $253,990 Active 6 DOM
-
2026-06-09days on market $253,990 Active 5 DOM
-
2026-06-08days on market $253,990 Active 4 DOM
-
2026-06-07days on market $253,990 Active 3 DOM
-
2026-06-03days on market $253,990 Active 178 DOM
-
2026-06-02days on market $253,990 Active 177 DOM
-
2026-06-01days on market $253,990 Active 176 DOM
-
2026-05-31days on market $253,990 Active 175 DOM
-
2026-05-31days on market $253,990 Active 174 DOM
-
2026-04-02price $251,990 582-char remark
-
2026-03-04price $250,990 582-char remark
-
2025-12-07$249,990 Active 582-char remark
ⓘ Source: listings_history table (triggers on properties + properties_extension) + one-shot
backfill from property_details.listing_events for pre-trigger history.
Climate risk First Street
- Flood 1/10 Low FEMA zone X (unshaded) · 0% chance over 30 yrs
- Wildfire 6/10 Major
- Heat 9/10 Extreme 7 d/yr ≥108°F today · 24 d/yr by 30 yrs out
- Wind 10/10 Extreme 99% chance of damaging wind over 30 yrs
- Air quality 2/10 Low 0 unhealthy d/yr today · 1 by 30 yrs out
Nearby sold comps map
Loading sold comps map…
Walkable amenities ~0.75 mi
Loading nearby amenities…
Taxation est. · year 1
- Rental income
- $30,523
- − Mortgage interest
- −$14,227
- − Property taxes
- −$3,810
- − Insurance
- −$1,270
- − Repairs & maintenance
- −$2,442
- − Management
- −$2,442
- − HOA
- −$3,468
- − Depreciation
- −$7,389
- Taxable loss
- −$4,524
- Est. tax savings @ 24.0%
- +$1,086
- After-tax cash flow
- $668/yr
For passive investors: Depreciation is non-cash, so a rental often shows a tax loss while cash-flowing — sheltering income. Rental losses are passive: they offset passive income freely, and up to $25,000/yr can offset ordinary (W-2) income if you actively participate and your MAGI is under $100k (phasing out to $0 by $150k); unused losses carry forward. On sale, claimed depreciation is recaptured at up to 25%, and gains may owe capital-gains tax (a 1031 exchange can defer both). Figures are a year-1 estimate at your 24.0% rate — not tax advice; consult a CPA.
Condition & rehab AI · 6 photos
This well-maintained townhouse in Indiantown, FL, offers a modern kitchen, spacious living areas, and a clean exterior. It is ready for immediate occupancy and can be enhanced with minor updates to boost its value.
Value-add opportunities
- Both Painting the exterior and interior walls — Fresh paint can enhance curb appeal and interior aesthetics.
- Both Landscaping improvements — Enhanced landscaping can increase curb appeal and property value.
- Both Adding smart home features — Smart home features can increase property value and attract tech-savvy buyers/tenants.
- Both Upgrading the kitchen backsplash — A new backsplash can refresh the kitchen and add value.
- Both Upgrading the flooring in high-traffic areas — Newer flooring can improve the overall look and feel of the home.
Renovation cost estimate screening
Value-add ROI direction
- Both Painting the exterior and interior walls — Fresh paint can enhance curb appeal and interior aesthetics. ↑
- Both Landscaping improvements — Enhanced landscaping can increase curb appeal and property value. ↑
- Both Adding smart home features — Smart home features can increase property value and attract tech-savvy buyers/tenants. ↑
- Both Upgrading the kitchen backsplash — A new backsplash can refresh the kitchen and add value. ↑
- Both Upgrading the flooring in high-traffic areas — Newer flooring can improve the overall look and feel of the home. ↑
ⓘ Cost ranges are severity-bucket heuristics (US national rule-of-thumb). Get contractor quotes + a written scope before underwriting a rehab budget.
Schools (NCES district)
- District
- Martin
- NCES district ID
- 1201290
- Math proficiency
- 52% ▼ -14.00%
- Reading proficiency
- 53% ▼ -4.00%
- Median HH income
- $52,482
- Composite
- 45.1/100
- National rank
- #2690
- State rank
- #24 of 73 in FL
Livability — Indiantown
- Score
- 59/100
- State rank
- #829
- US rank
- #20298
Category grades
Schools grade is shown separately in the Schools card above.
Census & demographics
- Census place
- Indiantown, FL
- Population (ZIP)
- 9,639
Population outlook (Martin County) Hauer SSP2
- Today (2025)
- 172,383 people
- By 2030
- 180,192 · +4.5%
- By 2040
- 194,114 · +12.6%
- By 2050
- 204,992 · +18.9%
- By 2075
- 229,641 · +33.2%
- By 2100
- 232,146 · +34.7%
Race, ethnicity, and origin ACS 2023
- Neighborhood character
- Diverse neighborhood (Simpson 0.64)
- Race & ethnicity
- Hispanic / Latino 49% Black 24% White 24% Two or more races 16% Native American 5% Asian 1%
- Hispanic origin (detail)
- Mexican 21% Puerto Rican 4% Cuban 1%
- Common ancestry
- Lithuanian 1% Italian 1% Slovak 1%
- Foreign-born
- 22% · Canada
- Languages at home
- 55% English-only · Spanish 42%
Political lean MEDSL · Martin
- 2024 margin
- Solid R (+31.1) · D 34.1% · R 65.2%
- 2008→2024 swing
- -17.5pp toward R · 2008: -13.6pp · 2024: -31.1pp
- All cycles
- 2024: R+31.1 2020: R+24.6 2016: R+26.9 2012: R+22.9 2008: R+13.6
Not yet ingested
- Civics
- —
Market trends
- HPI YoY
- ▲ 6.65%
- Current HPI
- 561.896
- Rent YoY
- —
- Metro
- —
- State GDP YoY
- ▲ 3.28%
- F500 in state
- 36
Industry mix (Fortune 500 HQ in FL)
| Industry | F500 HQs | Revenue |
|---|---|---|
| Industrial Technology | 2 | $29B |
|
||
| Insurance | 2 | $17B |
|
||
| Retail | 1 | $60B |
|
||
| Technology Distribution | 1 | $58B |
|
||
| Homebuilding | 1 | $35B |
|
||
| Technology Manufacturing | 1 | $35B |
|
||
Cash-flow waterfall
monthlySold comps — $/sqft
last 12 mo · ≤1 miLoading sold comps…