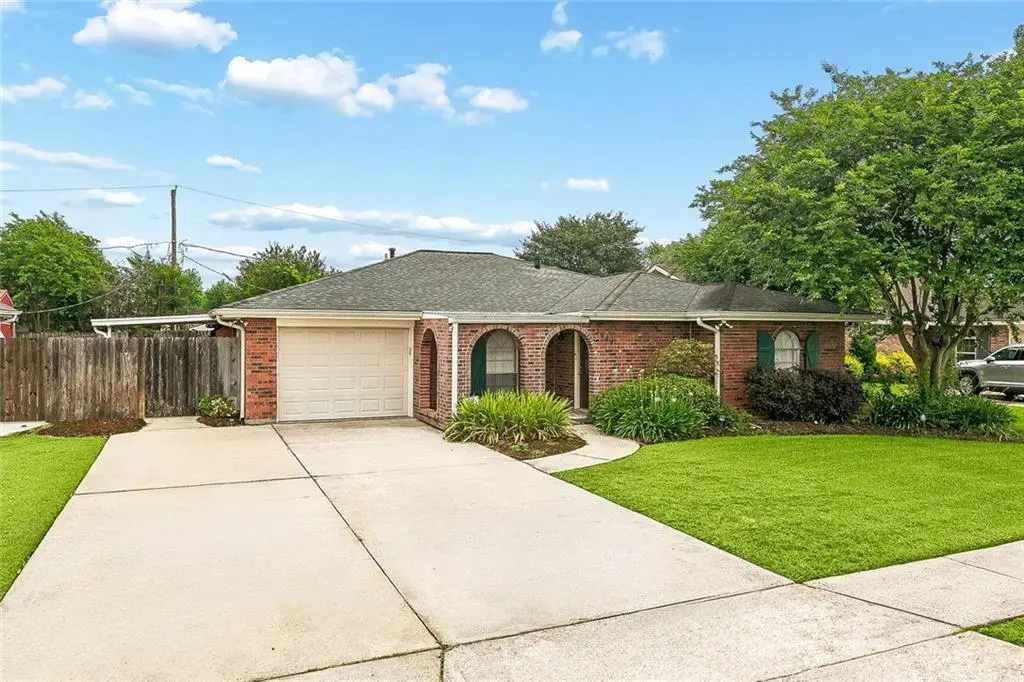
2649 Vulcan St · Harvey, LA
Flood risk 8/10 · Major
- FEMA flood zone
- X
- Chance of flooding over 30 yrs
- 0.6%
- Est. flood insurance / yr
- $507 – $1,088
Fire risk 1/10 · Minimal
- Est. fire insurance / yr
- $1,269 – $2,357
Heat risk 10/10 · Severe
- Hot days now (above 108°F)
- 7 days/yr
- Hot days in 30 yrs
- 21 days/yr
Wind risk 10/10 · Severe
- Chance of severe wind over 30 yrs
- 99.0%
Air-quality risk 3/10 · Minor
- Unhealthy air days now
- 3 days/yr
- Unhealthy air days in 30 yrs
- 4 days/yr
Risk factors via First Street. Map © Google.
Why this score? — see what drove the C- grade
The composite is a weighted blend of 9 inputs, each scored 0–100. Each bar is that input's sub-score; the figure is the points it added to the 100-point composite (weight × sub-score).
- Cash flow +18.4/30.0
- ARV discount +13.7/15.0
- DSCR +5.8/10.0
- 1% rule +4.0/10.0
- Livability +3.2/5.0
- Schools +2.5/10.0
- Condition / age +2.5/5.0
- Rent growth +1.5/5.0
- Appreciation +0.0/10.0
$230,000
🖨 Deal sheet 📄 Offer letter ✓ Due diligence
Listing remarks MLS
Check out this spacious well maintained 3-bedroom 2-bathroom home. The home includes plenty of storage with a 1 car garage, and plenty of off-street parking. The nice backyard and large covered patio make for a great entertainment area. This home comes with the benefit of a three-year-old HVAC system. Call today to book your showing.
Key facts
- Backyard
- Covered patio
- Hvac system
Tags
Property features AI
Exterior
- Parking: Garage; Off-street parking; Three or more parking spaces
- Security: Security system
- Utilities: Public water; Public sewer
- Home design: Single-story property; Slab foundation; Shingle roof
- Construction: Brick construction; Built with a slab foundation; Shingle roof
- Exterior features: Brick exterior; Fence; Covered concrete patio/porch; Rectangular, city lot
Interior
- Bedrooms: Total of 6 rooms (includes bedrooms and other living spaces)
- Bathrooms: 2 full bathrooms
- Heating & cooling: Central heating; Central air conditioning
- Interior features: Very good condition; Security system
Neighborhood map
What this means for you Summary
Snapshot
- This is a 3-bed/2.0-bath single-family listed at $230k.
Deal economics
- At list price, monthly cash flow is $149 ($2k/yr) — positive.
- The deal already cash-flows at list — no discount required.
- To meet the 1% rule (rent ≥ 1% of price), the offer needs to be $207k (10.2% below list).
- Recommended offer: $207k (10.2% below list) — sets the bar for 1% rule.
- Cap rate 7.4% vs local median 4.8% in Harvey — top-decile yield for the area; either an underpriced asset or a hidden risk that comps aren't pricing in. Stress-test before assuming the spread holds.
Location & tenants
- Location reads 64/100 on livability (#166 in LA) — a middle-class / working-renter tenant base. Strengths: cost of living A+, housing A+; Watch: schools D+, crime F, amenities F.
- Jefferson Parish (suburban): math 24% / reading 34% proficiency, ranked #44 of 98 in LA (top 45%) — low school quality limits family demand, transient renter base, plan for 1-2y turnover; 70% free/reduced lunch — lower-income household profile, screen leases tightly.
- Market conditions: Rents falling (-3.9%/yr); 187 active listings in the ZIP; 18 comparable units currently listed for rent nearby; rentals at typical pace (median 24d on market — plan ~3-4 weeks tenant-placement turnaround); 518 units permitted in Jefferson Parish in 2024 (43 in 5+ unit buildings).
- This rent runs 40% of the median local income ($62k/yr) — at the standard rent-burdened threshold; future hikes will face affordability resistance.
Forward outlook
- Local home prices are declining (-3.0%/yr); year-one equity from $2k of loan paydown is wiped out by about $7k of value loss. Plan a longer hold.
Negotiation context
- It's been on market 46 days — a 3% lower offer ($223k) is reasonable based on typical stale-listing flexibility.
- 2 sale attempts with the ask held roughly flat each time — persistent listings suggest the price (not the market) is what's stuck; bring a comps-based counter.
- Current owner paid $67k; list at $230k implies a 243% gain — meaningful room to come down on a strong offer.
Risks & watch-outs
- Watch-outs: flood insurance adds $66/mo.
- Climate carrying-cost: severe flood risk; severe wind risk, 99% chance of damaging wind over 30y; extreme-heat days projected 7→21/yr by 2055 (HVAC capex compounding) — expect insurance premiums to compound above CPI over the hold.
Questions for the listing agent
- It's been on market 46 days. Have you received any prior offers? Is the seller open to a 10% concession, seller financing, or rate buy-down credit?
- Built in 1975 — when were the roof, HVAC, electrical panel, plumbing, and water heater last replaced?
- What's the actual annual flood-insurance premium (NFIP or private), and is the property in a SFHA with mandatory coverage?
- Is there a deadline driving the sale (1031 exchange, divorce, estate, relocation)? That informs how much negotiation room exists.
- Schools are D-rated, which usually means shorter tenancies and higher turnover. Who's the typical renter profile here, and what's been the actual vacancy rate?
- Crime grade is F in this area — have there been break-ins, vandalism, or insurance claims at this property in the last 3 years? What carrier currently insures it and at what premium?
- What's the average days-on-market for RENTAL listings here right now (not sales)? A rising rental-DOM trend means longer vacancies and softer asking-rent achievability than the comps imply.
- What's the recent tenant-quality profile in this submarket — average credit score on applications, eviction rate, late-payment / NSF rate, and stable-employment percentage? A property-management company in the area should have these aggregated.
- How much new for-sale + rental construction is in the pipeline within 1–3 miles? Heavy new supply typically softens prices + rents 12–24 months out; constrained supply supports both.
Investment metrics
- 1% rule
- 0.90% ✗
- Cap rate
- 7.41%
- Cash-on-cash
- 4.01%
- DSCR
- 1.18
- GRM
- 9.3
CMA / ARV
- ARV (median comp)
- $266,816
- List price
- $230,000
- Delta
- -13.80%
- Verdict
- UNDERPRICED
- Comps
- 20 within 1.0 mi
Show comp detail 12 sales within ~0.75 mi
| Address | Dist | Beds/Ba | Sqft | Sold | Price | $/sf | Match |
|---|---|---|---|---|---|---|---|
| 2289 Colombo Dr | 0.09mi | 3/2.0 | 1,715 (+10%) | 14mo | $293,000 | $171 | 67 |
| 2241 Hampton Dr | 0.30mi | 3/2.0 | 1,700 (+9%) | 4mo | $150,000 | $88 | 67 |
| 2214 N Friendship Dr | 0.48mi | 3/2.0 | 1,453 (-6%) | 7mo | $235,000 | $162 | 61 |
| 2282 N Village Green St | 0.62mi | 3/2.0 | 1,600 (+3%) | 10mo | $230,000 | $144 | 58 |
| 2323 N Harper Dr | 0.46mi | 3/2.0 | 1,678 (+8%) | 10mo | $350,000 | $209 | 57 |
| 1857 Stall Dr | 0.70mi | 3/2.0 | 1,600 (+3%) | 12mo | $160,500 | $100 | 53 |
| 2239 S Village Green St | 0.65mi | 3/2.0 | 1,641 (+6%) | 10mo | $255,000 | $155 | 52 |
| 2128 Missile St | 0.50mi | 3/2.0 | 1,673 (+8%) | 18mo | $255,000 | $152 | 49 |
| 3405 W Parc Green St | 0.74mi | 3/2.0 | 1,650 (+6%) | 12mo | $254,000 | $154 | 45 |
| 2120 Colombo Dr | 0.44mi | 4/2.0 (+1) | 1,726 (+11%) | 14mo | $245,000 | $142 | 44 |
| 34 Terraza Del Oeste Dr | 0.67mi | 3/2.0 | 1,409 (-9%) | 12mo | $220,000 | $156 | 44 |
| 1909 Stall Dr | 0.65mi | 3/2.0 | 1,750 (+13%) | 10mo | $182,000 | $104 | 40 |
Match score weights: distance 35% · size 25% · config 20% · recency 20%. Top-matched comps best support the ARV.
Projected returns pro-forma
-3.0% appreciation · 0.0% rent growth · sell at horizon
- IRR
- -15.2%
- Equity multiple
- 0.47×
- Total profit
- $-33,899
- Equity at exit
- $34,294
- IRR
- -12.3%
- Equity multiple
- 0.37×
- Total profit
- $-40,876
- Equity at exit
- $19,886
Cash invested: $64,400 (down + closing). Projections, not guarantees.
Landlord ↔ Tenant lean methodology
- Overall (STATE)
- 90 Strongly Landlord-Friendly
- State Louisiana
- 90 Strongly Landlord-Friendly · R+12
- County
- — inherits STATE
- City
- — inherits STATE
ZIP-level market 70058
- Rents YoY
- -3.9%
- Active inventory
- 187
- Price-to-rent
- 9.3×
Monthly cashflow live
- Estimated rent
- $2,066 high interval (Pro) →
- Mortgage (P&I)
- −$1,206
- Tax from tax record
- −$115 /mo · $1,383/yr
- Insurance
- −$96
- Flood insurance flood zone
- −$66 /mo · $798/yr
- HOA
- −$0
- Vacancy / Maint / Mgmt
- −$434
- Net cashflow
- $149
Break-even live
UW: 25.0% down · 7.5% · 30yr · 1.5% tax · 5.0% vac · 8.0% maint · 8.0% mgmt
Financing live
Cash to close
- Down payment
- $57,500
- Closing costs
- $6,900
- Reserves months
- —
- Total cash needed
- —
Loan-product check · same deal, 3 products live
Conventional
25% down · 7.5% · 30yr
- Down + closing
- —
- Monthly P&I
- —
- Monthly cashflow
- —
- DSCR
- —
- Eligible?
- —
Personal DTI + credit; lowest rate.
DSCR
20% down · 8.5% · 30yr
- Down + closing
- —
- Monthly P&I
- —
- Monthly cashflow
- —
- DSCR
- —
- Eligible?
- —
No personal income docs; deal must DSCR.
Hard money
10% down · 12.0% · 12mo
- Down + closing
- —
- Monthly P&I
- —
- Monthly cashflow
- —
- DSCR
- —
- Eligible?
- —
Short-term bridge; refi at stabilization.
Rent comps 18 comps
| Address | Beds | Baths | Sqft | Rent | $/sqft | DOM | Units | Dist |
|---|---|---|---|---|---|---|---|---|
| 2278 Telestar St Harvey, LA | 4.0 | 2.0 | 2121 | $2,450 | $1.16 | 23d | 1 | 0.09mi |
| 2713 W Friendship Dr Harvey, LA | 3.0 | 2.0 | 1750 | $1,850 | $1.06 | 23d | 1 | 0.27mi |
| 2323 N Harper Dr Harvey, LA | 3.0 | 2.0 | 1678 | $3,000 | $1.79 | 43d | 1 | 0.45mi |
| 3014 Destrehan Ave Harvey, LA | 2.0 | 2.0 | 1150 | $1,600 | $1.39 | 43d | 1 | 0.91mi |
| 1805 Redwood Dr Harvey, LA | 3.0 | 2.0 | 1270 | $1,850 | $1.46 | 21d | 1 | 1.03mi |
| 1849 Redwood Dr Harvey, LA | 3.0 | 2.0 | 1600 | $1,900 | $1.19 | 23d | 1 | 1.08mi |
| 1849 Redwood Dr Harvey, LA | 3.0 | 2.0 | 1600 | $1,900 | $1.19 | 43d | 1 | 1.08mi |
| 1500 Lorene Dr Harvey, LA | 3.0 | 1.0–2.0 | 766 | $1,790 | $2.34 | 3d | 8 | 1.16mi |
| 2236 Litchwood Ln Harvey, LA | 4.0 | 2.0 | 1800 | $2,200 | $1.22 | 3d | 1 | 1.22mi |
| 2236 Litchwood Ln Harvey, LA | 4.0 | 2.0 | 1800 | $2,200 | $1.22 | 2d | 1 | 1.22mi |
| 1645 Dogwood Dr Harvey, LA | 4.0 | 1.0 | 1185 | $1,800 | $1.52 | 23d | 1 | 1.23mi |
| 2331 Justin Ln Unit Justin Harvey, LA | 2.0 | 1.5 | 1384 | $1,552 | $1.12 | 43d | 1 | 1.24mi |
| 2700 Whitney Ave Harvey, LA | 3.0 | 1.0–2.0 | 844 | $1,538 | $1.82 | 2d | 11 | 1.26mi |
| 1840 Mathis Ave Harvey, LA | 3.0 | 2.0 | 1200 | $1,800 | $1.50 | 43d | 1 | 1.31mi |
| 829 Bellemeade Blvd Gretna, LA | 4.0 | 2.0 | 1805 | $2,400 | $1.33 | 43d | 1 | 1.36mi |
| 1499 Central Park Blvd Harvey, LA | 1.0–3.0 | 1.0–2.0 | 1002 | $2,195 | $2.19 | 3d | 18 | 1.45mi |
| 4016 S Dells St Harvey, LA | 4.0 | 2.0 | 1750 | $2,000 | $1.14 | 43d | 1 | 1.49mi |
| 4112 Lac Bienville Dr Unit A Harvey, LA | 2.0 | 1.5 | 1100 | $1,400 | $1.27 | 14d | 1 | 1.49mi |
Listing history 16 events
-
2026-06-18days on market $230,000 Active 46 DOM
-
2026-06-17days on market $230,000 Active 45 DOM
-
2026-06-16days on market $230,000 Active 44 DOM
-
2026-06-15days on market $230,000 Active 43 DOM
-
2026-06-13days on market $230,000 Active 41 DOM
-
2026-06-10days on market $230,000 Active 38 DOM
-
2026-06-09days on market $230,000 Active 37 DOM
-
2026-06-08days on market $230,000 Active 36 DOM
-
2026-06-07days on market $230,000 Active 35 DOM
-
2026-06-03days on market $230,000 Active 31 DOM
-
2026-06-02days on market $230,000 Active 30 DOM
-
2026-06-01days on market $230,000 Active 29 DOM
-
2026-05-31days on market $230,000 Active 28 DOM
-
2026-05-03$240,000 Active 335-char remark
Show marketing remark (335 chars)
Check out this spacious well maintained 3-bedroom 2-bathroom home. The home includes plenty of storage with a 1 car garage, and plenty of off-street parking. The nice backyard and large covered patio make for a great entertainment area. This home comes with the benefit of a three-year-old HVAC system. Call today to book your showing.
-
1986-03-01soldstatus $67,000
ⓘ Source: listings_history table (triggers on properties + properties_extension) + one-shot
backfill from property_details.listing_events for pre-trigger history.
Tax reassessment forecast LA · Resets to sale price
- Current annual tax
- $1,383 · $115/mo
- Projected year-2 tax
- $1,383 · $115/mo
- Expected delta
- $0/yr ($0/mo · 0.0%)
ⓘ Screening estimate from a state-policy table — verify with the county assessor before closing.
Climate risk First Street
- Flood 8/10 Severe FEMA zone X · 60% chance over 30 yrs
- Wildfire 1/10 Low
- Heat 10/10 Extreme 7 d/yr ≥108°F today · 21 d/yr by 30 yrs out
- Wind 10/10 Extreme 99% chance of damaging wind over 30 yrs
- Air quality 3/10 Moderate 3 unhealthy d/yr today · 4 by 30 yrs out
Nearby sold comps map
Loading sold comps map…
Walkable amenities ~0.75 mi
Loading nearby amenities…
Taxation est. · year 1
- Rental income
- $24,793
- − Mortgage interest
- −$12,884
- − Property taxes
- −$1,383
- − Insurance
- −$1,948
- − Repairs & maintenance
- −$1,983
- − Management
- −$1,983
- − Depreciation
- −$6,691
- Taxable loss
- −$2,079
- Est. tax savings @ 24.0%
- +$499
- After-tax cash flow
- $2,281/yr
For passive investors: Depreciation is non-cash, so a rental often shows a tax loss while cash-flowing — sheltering income. Rental losses are passive: they offset passive income freely, and up to $25,000/yr can offset ordinary (W-2) income if you actively participate and your MAGI is under $100k (phasing out to $0 by $150k); unused losses carry forward. On sale, claimed depreciation is recaptured at up to 25%, and gains may owe capital-gains tax (a 1031 exchange can defer both). Figures are a year-1 estimate at your 24.0% rate — not tax advice; consult a CPA.
Schools (NCES district)
- District
- Jefferson Parish
- NCES district ID
- 2200840
- Math proficiency
- 24% ▼ -36.00%
- Reading proficiency
- 34% ▼ -30.00%
- Median HH income
- $48,421
- Composite
- 25.19/100
- National rank
- #7511
- State rank
- #44 of 98 in LA
Livability — Harvey
- Score
- 64/100
- State rank
- #166
- US rank
- #13980
Category grades
Schools grade is shown separately in the Schools card above.
Census & demographics
- Census place
- Harvey, LA
- County
- Jefferson Parish · 426,999 people
- City population
- 39,578
- Metro
- New Orleans-Metairie, LA
- Population (ZIP)
- 39,578
- Household income
- $62,416
- Rent vs Own
- Severe rent burden
- 1992.0
Population outlook (Jefferson County) Hauer SSP2
- Today (2025)
- 451,696 people
- By 2030
- 455,451 · +0.8%
- By 2040
- 458,308 · +1.5%
- By 2050
- 461,031 · +2.1%
- By 2075
- 476,351 · +5.5%
- By 2100
- 499,377 · +10.6%
Race, ethnicity, and origin ACS 2023
- Neighborhood character
- Diverse neighborhood (Simpson 0.60)
- Race & ethnicity
- Black 58% White 20% Hispanic / Latino 13% Asian 7% Two or more races 4%
- Hispanic origin (detail)
- Mexican 1% Dominican 1%
- Common ancestry
- Lithuanian 4% Hispanic 1%
- Foreign-born
- 13% · Canada, Vietnam
- Languages at home
- 81% English-only · Spanish 10% Vietnamese 5% French/Haitian/Cajun 2%
Political lean MEDSL · Jefferson
- 2024 margin
- R (+12.9) · D 42.5% · R 55.5% · Other 2.1%
- 2008→2024 swing
- +13.6pp toward D · 2008: -26.6pp · 2024: -12.9pp
- All cycles
- 2024: R+12.9 2020: R+11.1 2016: R+14.8 2012: R+18.4 2008: R+26.6
Not yet ingested
- Civics
- —
Market trends
- HPI YoY
- ▼ -96.82%
- Current HPI
- 156.1052
- Rent YoY
- ▼ -3.88%
- Metro
- New Orleans-Metairie, LA
- State GDP YoY
- ▲ 3.29%
- F500 in state
- 10
Industry mix (Fortune 500 HQ in LA)
| Industry | F500 HQs | Revenue |
|---|---|---|
| Telecommunications | 2 | $23B |
|
||
| Utilities | 1 | $12B |
|
||
| Wholesale / Distribution | 1 | $5B |
|
||
| Advertising | 1 | $2B |
|
||
Price history
+243.3% since first listed5 events — show timeline
- 2026-05-27 Price Changed $230,000 AcadianaMLS
- 2026-05-27 Price Changed $230,000 GSREIN
- 2026-05-03 Listed $240,000 GSREIN
- 2026-05-03 Listed $240,000 AcadianaMLS
- 1986-03-01 Sold (Public Records) $67,000 Public Records
Property tax history
+1.7%/yrLatest (2025): $1,383 · +0.3% YoY. Source: county tax records.
Cash-flow waterfall
monthlySold comps — $/sqft
last 12 mo · ≤1 miLoading sold comps…