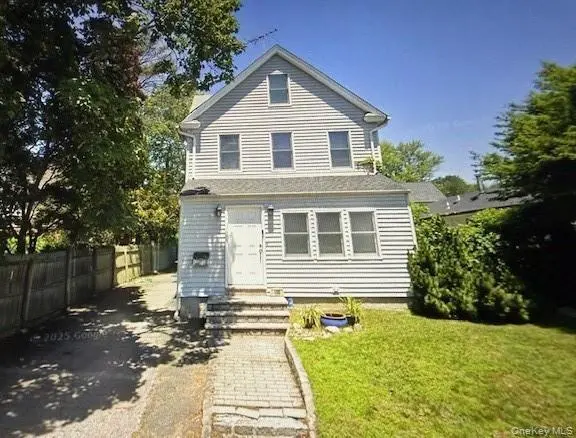
105 Bayview Ave · Manhasset, NY
Flood risk 3/10 · Minor
- FEMA flood zone
- X (unshaded)
- Chance of flooding over 30 yrs
- 0.2%
- Est. flood insurance / yr
- $473 – $860
Fire risk 4/10 · Minor
- Est. fire insurance / yr
- $691 – $1,283
Heat risk 6/10 · Moderate
- Hot days now (above 98°F)
- 7 days/yr
- Hot days in 30 yrs
- 16 days/yr
Wind risk 6/10 · Moderate
- Chance of severe wind over 30 yrs
- 27.0%
Air-quality risk 4/10 · Minor
- Unhealthy air days now
- 6 days/yr
- Unhealthy air days in 30 yrs
- 7 days/yr
Risk factors via First Street. Map © Google.
Why this score? — see what drove the D grade
The composite is a weighted blend of 9 inputs, each scored 0–100. Each bar is that input's sub-score; the figure is the points it added to the 100-point composite (weight × sub-score).
- ARV discount +15.0/15.0
- Schools +8.3/10.0
- Appreciation +7.7/10.0
- Cash flow +4.3/30.0
- Livability +4.1/5.0
- Rent growth +2.5/5.0
- Condition / age +2.5/5.0
- 1% rule +0.0/10.0
- DSCR +0.0/10.0
$1,100,000
🖨 Deal sheet (PDF) 📄 Offer letter ✓ Due diligence
Listing remarks
Charming Colonial in the Heart of Manhasset. This charming Colonial is waiting for your personal touch to make it truly your own. The home features three bedrooms and 1.5 bathrooms, along with a comfortable living room and a kitchen ready for your updates. A full unfinished basement offers additional potential for storage for storage or future living space. Ideally located, this property is within walking distance to schools, the LIRR, as well as dining and shopping options. Don't miss this great opportunity to create the home you've been dreaming of!
Key facts
- 5,000 sq ft lot
- Garage
- Built 1893
Property features AI
Exterior
- Parking: Driveway; 1-car garage
- Utilities: Cesspool sewer; Natural gas connected
- Home design: Single family residence; Three or more levels
- Construction: Vinyl siding construction
- Exterior features: Vinyl siding; Not waterfront; No additional parcels
Interior
- Kitchen: Gas range; Microwave; Refrigerator
- Bedrooms: Total rooms: 5
- Bathrooms: 1 full bathroom; 1 half bathroom
- Heating & cooling: Oil heating; Wall/window air conditioning units
- Interior features: Eat-in kitchen; Unfinished basement; Full attic
Neighborhood map
What this means for you Summary
Snapshot
- This is a 3-bed/1.5-bath single-family listed at $1.10M.
Deal economics
- At list price, monthly cash flow is $-3k ($-35k/yr) — negative.
- To cash-flow at today's rent, offer at most $579k (47.4% below list).
- To meet the 1% rule (rent ≥ 1% of price), the offer needs to be $537k (51.2% below list).
- Recommended offer: $537k (51.2% below list) — sets the bar for 1% rule.
- Cap rate 3.1% vs local median 2.2% in Manhasset — top-decile yield for the area; either an underpriced asset or a hidden risk that comps aren't pricing in. Stress-test before assuming the spread holds.
Location & tenants
- Location reads 82/100 on livability (#78 in NY, #1,199 nationally) — a professional / high-income tenant draw. Strengths: crime A+, commute A+, employment A+; Watch: amenities C-, cost of living F.
- Manhasset Union Free School District (suburban): math 86% / reading 84% proficiency, ranked #8 of 590 in NY (top 1%) — strong family-tenant draw, lease renewals of 3-5y typical; only 4% free/reduced lunch — higher-income household profile.
- Zoned schools: Manhasset Middle School (math 84% / reading 79%, grade A+, #22 of 729 statewide, top 3%, 521 students, 6% FRL); Manhasset Secondary School (math 100% / reading 87%, grade A+, #141 of 1,100 statewide, top 13%, 962 students, 8% FRL) — zoned schools at 7% FRL track the district average.
- Market conditions: 119 active listings in the ZIP; 15 comparable units currently listed for rent nearby; rentals at typical pace (median 27d on market — plan ~3-4 weeks tenant-placement turnaround); 824 units permitted in Nassau County in 2024 (153 in 5+ unit buildings).
Forward outlook
- In year one you build about $67k of equity ($8k loan paydown + $59k appreciation (5.4% local appreciation)).
- Nassau County population projected at +7% by 2050 — modest demand growth; plan on rents tracking national, not racing it.
- By year 2, paydown + projected appreciation supports a ~$107k cash-out refi (75% LTV) — recoverable capital for the next deal without selling this one.
Negotiation context
- It's been on market 32 days — a 3% lower offer ($1.07M) is reasonable based on typical stale-listing flexibility.
- Current owner paid $399k; list at $1.10M implies a 176% gain — meaningful room to come down on a strong offer.
Risks & watch-outs
- Watch-outs: built in 1893 — expect roof / HVAC / electrical / plumbing capex.
- Climate carrying-cost: major wind risk, 27% chance of damaging wind over 30y; extreme-heat days projected 7→16/yr by 2055 (HVAC capex compounding) — expect insurance premiums to compound above CPI over the hold.
Questions for the listing agent
- What do current leases actually rent for vs. the listed asking? Can we see a recent rent roll and the last 12 months of T-12 income?
- It's been on market 32 days. Have you received any prior offers? Is the seller open to a 51% concession, seller financing, or rate buy-down credit?
- Built in 1893 — when were the roof, HVAC, electrical panel, plumbing, and water heater last replaced?
- Is there a deadline driving the sale (1031 exchange, divorce, estate, relocation)? That informs how much negotiation room exists.
- Schools are A-rated — typically a magnet for longer-tenancy family renters. What's the average tenant stay here, and is there a school-zone premium baked into asking?
- The area grade is low — what's the realistic commute time and amenity access for the typical tenant pool here? Any planned neighborhood developments (good or bad) we should know about?
- What's the average days-on-market for RENTAL listings here right now (not sales)? A rising rental-DOM trend means longer vacancies and softer asking-rent achievability than the comps imply.
- What's the recent tenant-quality profile in this submarket — average credit score on applications, eviction rate, late-payment / NSF rate, and stable-employment percentage? A property-management company in the area should have these aggregated.
- How much new for-sale + rental construction is in the pipeline within 1–3 miles? Heavy new supply typically softens prices + rents 12–24 months out; constrained supply supports both.
Investment metrics
- 1% rule
- 0.49% ✗
- Cap rate
- 3.07%
- Cash-on-cash
- -11.50%
- DSCR
- 0.49
- GRM
- 17.1
CMA / ARV
- ARV (median comp)
- $1,437,146
- List price
- $1,100,000
- Delta
- -23.46%
- Verdict
- UNDERPRICED
- Comps
- 20 within 1.0 mi
Show comp detail 7 sales within ~0.75 mi
| Address | Dist | Beds/Ba | Sqft | Sold | Price | $/sf | Match |
|---|---|---|---|---|---|---|---|
| 12 Memorial Pl | 0.33mi | 3/1.5 | 1,246 (-2%) | 12mo | $1,320,000 | $1,059 | 72 |
| 145 Manhasset Ave | 0.14mi | 4/2.0 (+1) | 1,188 (-6%) | 7mo | $1,218,000 | $1,025 | 70 |
| 14 Bayview Ct | 0.10mi | 2/2.0 (-1) | 1,237 (-2%) | 23mo | $870,000 | $703 | 66 |
| 27 Bayview Ct | 0.12mi | 2/1.5 (-1) | 1,162 (-8%) | 12mo | $818,800 | $705 | 66 |
| 300 Thompson Shore Rd | 0.35mi | 3/2.0 | 1,390 (+10%) | 4mo | $1,500,000 | $1,079 | 62 |
| 15 Ridge Dr | 0.52mi | 4/1.5 (+1) | 1,250 (-1%) | 18mo | $1,100,000 | $880 | 53 |
| 21 Ravine Rd | 0.68mi | 3/2.0 | 1,220 (-4%) | 9mo | $780,000 | $639 | 53 |
Match score weights: distance 35% · size 25% · config 20% · recency 20%. Top-matched comps best support the ARV.
Projected returns pro-forma
5.38% appreciation · 3.0% rent growth · sell at horizon
- IRR
- 4.4%
- Equity multiple
- 1.29×
- Total profit
- $89,520
- Equity at exit
- $648,979
- IRR
- 7.0%
- Equity multiple
- 2.37×
- Total profit
- $422,230
- Equity at exit
- $1,141,831
Cash invested: $308,000 (down + closing). Projections, not guarantees.
Landlord ↔ Tenant lean methodology
- Overall (STATE)
- 15 Strongly Tenant-Friendly
- State New York
- 15 Strongly Tenant-Friendly · D+10
- County
- — inherits STATE
- City
- — inherits STATE
ZIP-level market 11030
- Home prices YoY
- 1.9%
- Active inventory
- 119
- Price-to-rent
- 17.1×
Monthly cashflow live
- Estimated rent
- $5,370 high interval (Pro) →
- Mortgage (P&I)
- −$5,769
- Tax from tax record
- −$966 /mo · $11,594/yr
- Insurance
- −$458
- HOA
- −$0
- Lot rent
- −$0
- Vacancy / Maint / Mgmt
- −$1,128
- Net cashflow
- $-2,951
Break-even live
Sensitivity live
| Price | -10% $-2,328 | -5% $-2,639 | +0% $-2,951 | +5% $-3,262 | +10% $-3,573 |
|---|---|---|---|---|---|
| Rent | -10% $-3,375 | -5% $-3,163 | +0% $-2,951 | +5% $-2,739 | +10% $-2,526 |
| Rate | -1.0pp $-2,397 | -0.5pp $-2,671 | base $-2,951 | +0.5pp $-3,236 | +1.0pp $-3,526 |
UW: 25.0% down · 7.5% · 30yr · 1.5% tax · 5.0% vac · 8.0% maint · 8.0% mgmt
Financing live
Cash to close
- Down payment
- $275,000
- Closing costs
- $33,000
- Reserves months
- —
- Total cash needed
- —
Loan-product check · same deal, 3 products live
Conventional
25% down · 7.5% · 30yr
- Down + closing
- —
- Monthly P&I
- —
- Monthly cashflow
- —
- DSCR
- —
- Eligible?
- —
Personal DTI + credit; lowest rate.
DSCR
20% down · 8.5% · 30yr
- Down + closing
- —
- Monthly P&I
- —
- Monthly cashflow
- —
- DSCR
- —
- Eligible?
- —
No personal income docs; deal must DSCR.
Hard money
10% down · 12.0% · 12mo
- Down + closing
- —
- Monthly P&I
- —
- Monthly cashflow
- —
- DSCR
- —
- Eligible?
- —
Short-term bridge; refi at stabilization.
Rent comps 15 comps
| Address | Beds | Baths | Sqft | Rent | $/sqft | DOM | Units | Dist |
|---|---|---|---|---|---|---|---|---|
| 6 Highland Ter Manhasset, NY | 3.0 | 3.0 | 1400 | $6,500 | $4.64 | 46d | 1 | 0.04mi |
| 17 Myrtle St Unit 2nd Manhasset, NY | 2.0 | 1.0 | 1650 | $3,500 | $2.12 | 46d | 1 | 0.16mi |
| 71 Orchard St Manhasset, NY | 2.0 | 2.5 | 1596 | $6,600 | $4.14 | 26d | 1 | 0.35mi |
| 240 E Shore Rd Great Neck, NY | 3.0 | 1.0–2.5 | 999 | $5,830 | $5.84 | 0d | 1 | 0.43mi |
| 28 Vista Hill Rd Great Neck, NY | 3.0 | 2.0 | 1700 | $5,500 | $3.24 | 0d | 1 | 0.71mi |
| 267 Schenck Ave Great Neck, NY | 3.0 | 1.5 | 1400 | $3,950 | $2.82 | 26d | 1 | 0.84mi |
| 261 Schenck Ave Unit 1st Floor Great Neck, NY | 2.0 | 1.0 | 975 | $3,700 | $3.79 | 26d | 1 | 0.86mi |
| 261 Schenck Ave Unit 2nd Floor Great Neck, NY | 2.0 | 1.0 | 1000 | $3,500 | $3.50 | 26d | 1 | 0.86mi |
| 109 Chase Rd Manhasset, NY | 3.0 | 1.5 | 1392 | $7,350 | $5.28 | 46d | 1 | 0.87mi |
| 15 Prospect St Unit 2FL Great Neck, NY | 3.0 | 3.0 | 1350 | $4,950 | $3.67 | 19d | 1 | 1.04mi |
| 37 Spruce St Unit 2 Great Neck, NY | 2.0 | 1.0 | 900 | $3,500 | $3.89 | 46d | 1 | 1.06mi |
| 130 S Middle Neck Rd #2 Great Neck, NY | 3.0 | 2.0 | 1500 | $4,300 | $2.87 | 0d | 1 | 1.34mi |
| 55 S Middle Neck Rd Unit 4C Great Neck, NY | 2.0 | 2.0 | 1200 | $4,600 | $3.83 | 46d | 1 | 1.35mi |
| 59 Radnor Rd Great Neck, NY | 3.0 | 3.5 | 1862 | $6,500 | $3.49 | 26d | 1 | 1.46mi |
| 15 Maple Grove St Great Neck, NY | 4.0 | 2.0 | 1383 | $5,300 | $3.83 | 24d | 1 | 1.50mi |
Listing history 10 events
-
2026-06-07days on market $1,100,000 Active 32 DOM
-
2026-06-04days on market $1,100,000 Active 29 DOM
-
2026-06-03days on market $1,100,000 Active 28 DOM
-
2026-06-02days on market $1,100,000 Active 27 DOM
-
2026-06-01days on market $1,100,000 Active 26 DOM
-
2026-05-31days on market $1,100,000 Active 25 DOM
-
2026-05-06$1,100,000 Active 562-char remark
-
2001-10-10soldstatus $399,000
-
1992-06-12soldstatus $194,500
-
1984-03-01soldstatus $124,000
ⓘ Source: listings_history table (triggers on properties + properties_extension) + one-shot
backfill from property_details.listing_events for pre-trigger history.
Tax reassessment forecast NY · Partial reset (capped growth)
- Current annual tax
- $11,594 · $966/mo
- Projected year-2 tax
- $15,092 · $1,258/mo
- Expected delta
- +$3,498/yr (+$292/mo · 30.2%)
ⓘ Screening estimate from a state-policy table — verify with the county assessor before closing.
Climate risk First Street
- Flood 3/10 Moderate FEMA zone X (unshaded) · 20% chance over 30 yrs
- Wildfire 4/10 Moderate
- Heat 6/10 Major 7 d/yr ≥98°F today · 16 d/yr by 30 yrs out
- Wind 6/10 Major 27% chance of damaging wind over 30 yrs
- Air quality 4/10 Moderate 6 unhealthy d/yr today · 7 by 30 yrs out
Nearby sold comps map
Loading sold comps map…
Walkable amenities ~0.75 mi
Loading nearby amenities…
Taxation est. · year 1
- Rental income
- $64,441
- − Mortgage interest
- −$61,617
- − Property taxes
- −$11,594
- − Insurance
- −$5,500
- − Repairs & maintenance
- −$5,155
- − Management
- −$5,155
- − Depreciation
- −$32,000
- Taxable loss
- −$56,581
- Est. tax savings @ 24.0%
- +$13,579
- After-tax cash flow
- $-21,829/yr
For passive investors: Depreciation is non-cash, so a rental often shows a tax loss while cash-flowing — sheltering income. Rental losses are passive: they offset passive income freely, and up to $25,000/yr can offset ordinary (W-2) income if you actively participate and your MAGI is under $100k (phasing out to $0 by $150k); unused losses carry forward. On sale, claimed depreciation is recaptured at up to 25%, and gains may owe capital-gains tax (a 1031 exchange can defer both). Figures are a year-1 estimate at your 24.0% rate — not tax advice; consult a CPA.
Schools (NCES district)
- District
- Manhasset Union Free School District
- NCES district ID
- 3618270
- Math proficiency
- 86% ▬ 0.00%
- Reading proficiency
- 84% ▲ 2.00%
- Median HH income
- $166,795
- Composite
- 82.99/100
- National rank
- #17
- State rank
- #8 of 590 in NY
Livability — Manhasset
- Score
- 82/100
- State rank
- #78
- US rank
- #1199
Category grades
Schools grade is shown separately in the Schools card above.
Census & demographics
- Census place
- Manhasset, NY
- City population
- 17,703
- Population (ZIP)
- 17,703
Population outlook (Nassau County) Hauer SSP2
- Today (2025)
- 1,409,302 people
- By 2030
- 1,431,482 · +1.6%
- By 2040
- 1,471,607 · +4.4%
- By 2050
- 1,502,845 · +6.6%
- By 2075
- 1,575,403 · +11.8%
- By 2100
- 1,554,356 · +10.3%
Race, ethnicity, and origin ACS 2023
- Neighborhood character
- Predominantly White (67%)
- Race & ethnicity
- White 67% Asian 20% Hispanic / Latino 8% Two or more races 7% Black 1%
- Hispanic origin (detail)
- Puerto Rican 2% Cuban 1%
- Common ancestry
- Romanian 5% Scotch-Irish 3% Italian 2%
- Foreign-born
- 18% · China, South Korea, Canada
- Languages at home
- 74% English-only · Chinese 9% Other Indo-European 8% Korean 3%
Political lean MEDSL · Nassau
- 2024 margin
- Toss-up / Even · D 47.9% · R 52.1%
- 2008→2024 swing
- -12.6pp toward R · 2008: 8.4pp · 2024: -4.2pp
- All cycles
- 2024: R+4.2 2020: D+9.5 2016: D+5.3 2012: D+6.7 2008: D+8.4
Not yet ingested
- Civics
- —
Market trends
- HPI YoY
- ▲ 5.38%
- Current HPI
- 288.8947
- Rent YoY
- —
- Metro
- —
- State GDP YoY
- ▲ 2.60%
- F500 in state
- 92
Industry mix (Fortune 500 HQ in NY)
| Industry | F500 HQs | Revenue |
|---|---|---|
| Financial Services | 10 | $950B |
|
||
| Consumer Goods | 9 | $162B |
|
||
| Insurance | 4 | $225B |
|
||
| Telecommunications | 2 | $144B |
|
||
| Pharmaceuticals | 2 | $112B |
|
||
| Media / Entertainment | 2 | $69B |
|
||
Price history
+787.1% since first listed4 events — show timeline
- 2026-05-06 Listed $1,100,000 OneKey® MLS as Distributed by MLS Grid
- 2001-10-10 Sold (Public Records) $399,000 Public Records
- 1992-06-12 Sold (Public Records) $194,500 Public Records
- 1984-03-01 Sold (Public Records) $124,000 Public Records
Property tax history
+2.4%/yrLatest (2024): $11,594 · +11.9% YoY. Source: county tax records.
Cash-flow waterfall
monthlySold comps — $/sqft
last 12 mo · ≤1 miLoading sold comps…