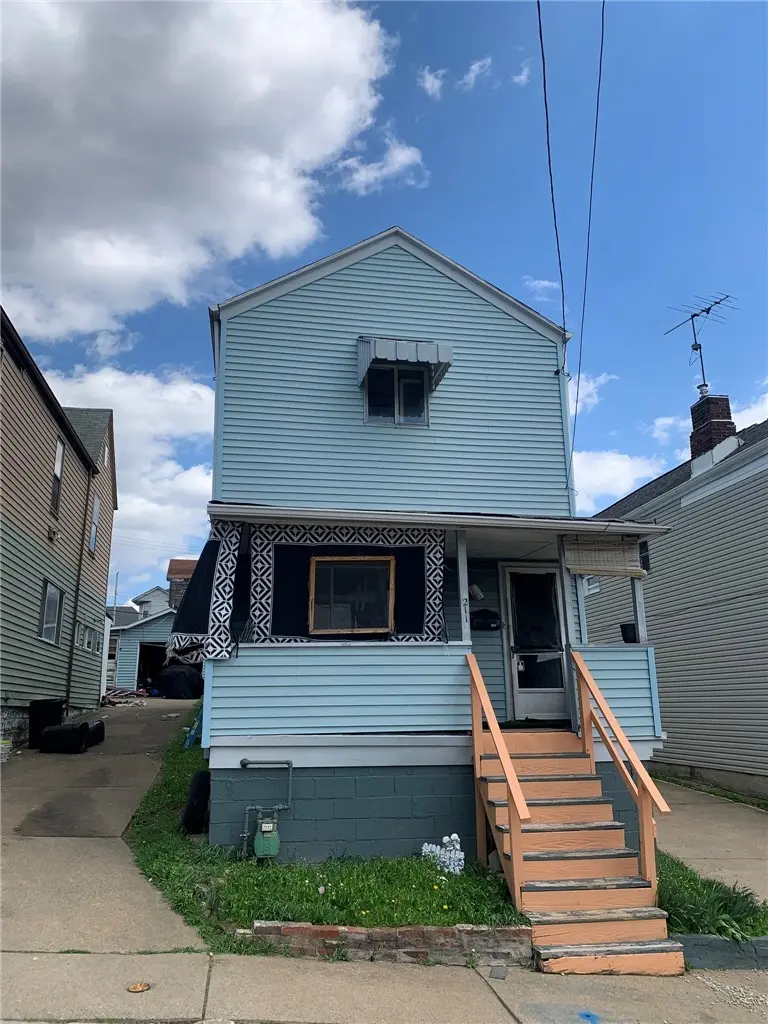
211 Short St · Whitaker, PA
Flood risk 6/10 · Moderate
- FEMA flood zone
- X (unshaded)
- Chance of flooding over 30 yrs
- 0.75%
- Est. flood insurance / yr
- $473 – $860
Fire risk 1/10 · Minimal
- Est. fire insurance / yr
- $511 – $949
Heat risk 4/10 · Minor
- Hot days now (above 97°F)
- 7 days/yr
- Hot days in 30 yrs
- 17 days/yr
Wind risk 2/10 · Minimal
- Chance of severe wind over 30 yrs
- 0.0%
Air-quality risk 4/10 · Minor
- Unhealthy air days now
- 4 days/yr
- Unhealthy air days in 30 yrs
- 5 days/yr
Risk factors via First Street. Map © Google.
Why this score? — see what drove the B grade
The composite is a weighted blend of 9 inputs, each scored 0–100. Each bar is that input's sub-score; the figure is the points it added to the 100-point composite (weight × sub-score).
- Cash flow +30.0/30.0
- 1% rule +10.0/10.0
- DSCR +10.0/10.0
- ARV discount +7.5/15.0
- Livability +4.0/5.0
- Rent growth +3.5/5.0
- Schools +2.6/10.0
- Condition / age +2.5/5.0
- Appreciation +0.0/10.0
$44,000
🖨 Deal sheet (PDF) 📄 Offer letter ✓ Due diligence
Listing remarks
Calling all Investors! This Handyman special is in need of some TLC. This house will make a great addition to a portfolio with minor cosmetic updates. This is an As-Is Sale, buyer is responsible for their own due diligence.
Key facts
- 3,001 sq ft lot
- Garage
- Built 1900
Property features AI
Exterior
- Parking: Detached garage (1 parking space)
- Utilities: Public water; Public sewer
- Home design: Two-story frame home; Resale property
- Construction: Frame construction; Asphalt roof
- Exterior features: Small lot (approx. 0.069 acres)
Interior
- Bedrooms: Three bedrooms on the upper level
- Bathrooms: One full bathroom; One half bathroom
- Heating & cooling: Forced air heating (gas); Wall/window cooling units
- Interior features: Unfinished basement
Neighborhood map
What this means for you Summary
Snapshot
- This is a 3-bed/1.5-bath single-family listed at $44k.
Deal economics
- At list price, monthly cash flow is $832 ($10k/yr) — positive.
- The deal already cash-flows at list — no discount required.
- Meets the 1% rule at list price ($2k rent vs $44k).
- Recommended offer: $43k (1.5% below list) — sets the bar for market timing.
Location & tenants
- Location reads 79/100 on livability (#256 in PA, #2,232 nationally) — a middle-class / working-renter tenant base. Strengths: crime A+, commute A+, cost of living A+; Watch: health & safety D+, amenities F.
- West Mifflin Area SD (suburban): math 19% / reading 41% proficiency, ranked #443 of 539 in PA (top 82%) — families likely to look elsewhere, expect single-tenant / working-renter base with shorter leases.
- Zoned schools: West Mifflin Area Ms (math 11% / reading 42%, grade F, #410 of 512 statewide, top 80%, 803 students, 100% FRL); West Mifflin Area Hs (math 52% / reading 24%, grade F, #281 of 437 statewide, top 65%, 936 students, 87% FRL) — zoned schools average 94% FRL vs 44% district-wide (50 pts higher); higher-poverty schools than district average — tighter screening recommended.
- Market conditions: Rents rising fast (+4.1%/yr); 93 active listings in the ZIP; 16 comparable units currently listed for rent nearby; rentals at typical pace (median 26d on market — plan ~3-4 weeks tenant-placement turnaround); 2,996 units permitted in Allegheny County in 2024 (1,588 in 5+ unit buildings).
- This rent runs 34% of the median local income ($56k/yr) — at the standard rent-burdened threshold; future hikes will face affordability resistance.
Forward outlook
- Local home prices are declining (-3.0%/yr); year-one equity from $304 of loan paydown is wiped out by about $1k of value loss. Plan a longer hold.
- At projected returns (-3.0% appreciation + 4.1% rent growth), your $12k cash investment doubles in ~2 years — after that, you're playing with house money.
Negotiation context
- It's been on market 22 days — a 2% lower offer ($43k) is reasonable based on typical stale-listing flexibility.
Risks & watch-outs
- Watch-outs: property tax is 4.2% of price; built in 1900 — expect roof / HVAC / electrical / plumbing capex.
- Climate carrying-cost: major flood risk — expect insurance premiums to compound above CPI over the hold.
Questions for the listing agent
- Built in 1900 — when were the roof, HVAC, electrical panel, plumbing, and water heater last replaced?
- Property tax is high relative to price — has the assessment been appealed recently, and will the sale trigger a re-assessment?
- Is there a deadline driving the sale (1031 exchange, divorce, estate, relocation)? That informs how much negotiation room exists.
- Schools are F-rated, which usually means shorter tenancies and higher turnover. Who's the typical renter profile here, and what's been the actual vacancy rate?
- What's the average days-on-market for RENTAL listings here right now (not sales)? A rising rental-DOM trend means longer vacancies and softer asking-rent achievability than the comps imply.
- What's the recent tenant-quality profile in this submarket — average credit score on applications, eviction rate, late-payment / NSF rate, and stable-employment percentage? A property-management company in the area should have these aggregated.
- How much new for-sale + rental construction is in the pipeline within 1–3 miles? Heavy new supply typically softens prices + rents 12–24 months out; constrained supply supports both.
Investment metrics
- 1% rule
- 3.55% ✓
- Cap rate
- 28.97%
- Cash-on-cash
- 81.01%
- DSCR
- 4.60
- GRM
- 2.3
CMA / ARV
- ARV (median comp)
- $166,505
- List price
- $44,000
- Delta
- -73.57%
- Verdict
- UNDERPRICED
- Comps
- 20 within 1.0 mi
Show comp detail 12 sales within ~0.75 mi
| Address | Dist | Beds/Ba | Sqft | Sold | Price | $/sf | Match |
|---|---|---|---|---|---|---|---|
| 144 W Schwab Ave | 0.19mi | 4/1.5 (+1) | 1,540 (-7%) | 3mo | $150,000 | $97 | 72 |
| 3418 Duquesne Ave | 0.59mi | 3/1.5 | 1,688 (+2%) | 1mo | $219,900 | $130 | 69 |
| 156 Dahlia St | 0.43mi | 3/1.0 | 1,560 (-6%) | 6mo | $191,900 | $123 | 63 |
| 403 Oak St | 0.29mi | 3/2.0 | 1,450 (-12%) | 1mo | $250,000 | $172 | 63 |
| 3134 Virginia Ave | 0.49mi | 3/2.5 | 1,589 (-4%) | 8mo | $159,900 | $101 | 60 |
| 615 School St | 0.44mi | 4/2.0 (+1) | 1,604 (-3%) | 10mo | $195,960 | $122 | 59 |
| 255 W Schwab Ave | 0.35mi | 3/2.0 | 1,476 (-11%) | 6mo | $193,000 | $131 | 59 |
| 238 E 19th | 0.74mi | 3/1.5 | 1,600 (-3%) | 3mo | $45,000 | $28 | 57 |
| 122 Whitaker St | 0.07mi | 4/2.0 (+1) | 1,414 (-15%) | 11mo | $207,000 | $146 | 57 |
| 109 Vine St | 0.33mi | 2/1.5 (-1) | 1,444 (-13%) | 4mo | $110,000 | $76 | 54 |
| 147 Lea St | 0.75mi | 3/2.0 | 1,836 (+11%) | 6mo | $90,000 | $49 | 40 |
| 891 Munn St | 0.73mi | 2/1.0 (-1) | 1,464 (-12%) | 9mo | $10,000 | $7 | 32 |
Match score weights: distance 35% · size 25% · config 20% · recency 20%. Top-matched comps best support the ARV.
Projected returns pro-forma
-3.0% appreciation · 4.06% rent growth · sell at horizon
- IRR
- 82.6%
- Equity multiple
- 4.86×
- Total profit
- $47,610
- Equity at exit
- $6,561
- IRR
- 86.2%
- Equity multiple
- 10.50×
- Total profit
- $117,074
- Equity at exit
- $3,804
Cash invested: $12,320 (down + closing). Projections, not guarantees.
Landlord ↔ Tenant lean methodology
- Overall (STATE)
- 62 Landlord-Friendly
- State Pennsylvania
- 62 Landlord-Friendly · EVEN
- County
- — inherits STATE
- City
- — inherits STATE
ZIP-level market 15120
- Home prices YoY
- -16.9%
- Rents YoY
- 4.1%
- Active inventory
- 93
- Price-to-rent
- 2.3×
Monthly cashflow live
- Estimated rent
- $1,563 high interval (Pro) →
- Mortgage (P&I)
- −$231
- Tax from tax record
- −$154 /mo · $1,853/yr
- Insurance
- −$18
- HOA
- −$0
- Vacancy / Maint / Mgmt
- −$328
- Net cashflow
- $832
Break-even live
Sensitivity live
| Price | -10% $857 | -5% $844 | +0% $832 | +5% $819 | +10% $807 |
|---|---|---|---|---|---|
| Rent | -10% $708 | -5% $770 | +0% $832 | +5% $893 | +10% $955 |
| Rate | -1.0pp $854 | -0.5pp $843 | base $832 | +0.5pp $820 | +1.0pp $809 |
UW: 25.0% down · 7.5% · 30yr · 1.5% tax · 5.0% vac · 8.0% maint · 8.0% mgmt
Financing live
Cash to close
- Down payment
- $11,000
- Closing costs
- $1,320
- Reserves months
- —
- Total cash needed
- —
Loan-product check · same deal, 3 products live
Conventional
25% down · 7.5% · 30yr
- Down + closing
- —
- Monthly P&I
- —
- Monthly cashflow
- —
- DSCR
- —
- Eligible?
- —
Personal DTI + credit; lowest rate.
DSCR
20% down · 8.5% · 30yr
- Down + closing
- —
- Monthly P&I
- —
- Monthly cashflow
- —
- DSCR
- —
- Eligible?
- —
No personal income docs; deal must DSCR.
Hard money
10% down · 12.0% · 12mo
- Down + closing
- —
- Monthly P&I
- —
- Monthly cashflow
- —
- DSCR
- —
- Eligible?
- —
Short-term bridge; refi at stabilization.
Rent comps 16 comps
| Address | Beds | Baths | Sqft | Rent | $/sqft | DOM | Units | Dist |
|---|---|---|---|---|---|---|---|---|
| 931 Hilltop St Homestead, PA | 3.0 | 1.5 | 1312 | $1,500 | $1.14 | 16d | 1 | 0.56mi |
| 308 Lea St Homestead, PA | 4.0 | 2.0 | 1480 | $1,490 | $1.01 | 5d | 1 | 0.68mi |
| 218 Mary St Homestead, PA | 3.0 | 1.0 | 1776 | $1,400 | $0.79 | 23d | 1 | 0.69mi |
| 623 E 18th Ave Homestead, PA | 2.0 | 1.0 | 1156 | $1,600 | $1.38 | 45d | 1 | 0.72mi |
| 212 Kenmawr Ave Braddock, PA | 2.0 | 1.5 | 1417 | $1,300 | $0.92 | 45d | 1 | 0.88mi |
| 621 E 9th Ave Homestead, PA | 2.0 | 2.0 | 1400 | $1,425 | $1.02 | 25d | 1 | 0.98mi |
| 537 6th St Braddock, PA | 3.0 | 1.0 | 1360 | $1,400 | $1.03 | 45d | 1 | 1.17mi |
| 300 W 13th Ave Unit 302 Homestead, PA | 2.0 | 1.0 | 1088 | $1,150 | $1.06 | 18d | 1 | 1.22mi |
| 300 W 13th Ave Homestead, PA | 2.0 | 1.0 | 1088 | $1,125 | $1.03 | 18d | 1 | 1.22mi |
| 335 Commonwealth Ave West Mifflin, PA | 2.0 | 2.0 | 1536 | $2,500 | $1.63 | 45d | 1 | 1.29mi |
| 3305 W Run Rd Munhall, PA | 2.0 | 1.0 | 1100 | $1,365 | $1.24 | 25d | 1 | 1.34mi |
| 611 E Waterfront Dr Homestead, PA | 1.0–2.0 | 1.0–2.5 | 1149 | $2,605 | $2.27 | 0d | 9 | 1.38mi |
| 1254 Edgewood Dr Homestead, PA | 3.0 | 1.0 | 1144 | $1,725 | $1.51 | 45d | 1 | 1.41mi |
| 7645 Highland Ave Pittsburgh, PA | 3.0 | 1.0 | 1161 | $1,325 | $1.14 | 9d | 1 | 1.41mi |
| 7009 Church St Pittsburgh, PA | 3.0 | 2.0 | 1800 | $1,550 | $0.86 | 45d | 1 | 1.46mi |
| 2219 Manor Ave Pittsburgh, PA | 3.0 | 1.0 | 1638 | $1,600 | $0.98 | 25d | 1 | 1.47mi |
Listing history 4 events
-
2026-05-12status Pending 223-char remark
-
2026-04-27price $44,000 223-char remark
-
2026-04-22price $49,000 223-char remark
-
2026-04-20$59,000 Active 223-char remark
ⓘ Source: listings_history table (triggers on properties + properties_extension) + one-shot
backfill from property_details.listing_events for pre-trigger history.
Tax reassessment forecast PA · Partial reset (capped growth)
- Current annual tax
- $1,853 · $154/mo
- Projected year-2 tax
- $1,853 · $154/mo
- Expected delta
- $0/yr ($0/mo · 0.0%)
ⓘ Screening estimate from a state-policy table — verify with the county assessor before closing.
Climate risk First Street
- Flood 6/10 Major FEMA zone X (unshaded) · 75% chance over 30 yrs
- Wildfire 1/10 Low
- Heat 4/10 Moderate 7 d/yr ≥97°F today · 17 d/yr by 30 yrs out
- Wind 2/10 Low 0% chance of damaging wind over 30 yrs
- Air quality 4/10 Moderate 4 unhealthy d/yr today · 5 by 30 yrs out
Nearby sold comps map
Loading sold comps map…
Walkable amenities ~0.75 mi
Loading nearby amenities…
Taxation est. · year 1
- Rental income
- $18,762
- − Mortgage interest
- −$2,465
- − Property taxes
- −$1,853
- − Insurance
- −$220
- − Repairs & maintenance
- −$1,501
- − Management
- −$1,501
- − Depreciation
- −$1,280
- Taxable income
- $9,942
- Est. tax owed @ 24.0%
- −$2,386
- After-tax cash flow
- $7,594/yr
For passive investors: Depreciation is non-cash, so a rental often shows a tax loss while cash-flowing — sheltering income. Rental losses are passive: they offset passive income freely, and up to $25,000/yr can offset ordinary (W-2) income if you actively participate and your MAGI is under $100k (phasing out to $0 by $150k); unused losses carry forward. On sale, claimed depreciation is recaptured at up to 25%, and gains may owe capital-gains tax (a 1031 exchange can defer both). Figures are a year-1 estimate at your 24.0% rate — not tax advice; consult a CPA.
Schools (NCES district)
- District
- West Mifflin Area SD
- NCES district ID
- 4225680
- Math proficiency
- 19% ▼ -19.00%
- Reading proficiency
- 41% ▼ -14.00%
- Median HH income
- $46,532
- Composite
- 25.78/100
- National rank
- #7371
- State rank
- #443 of 539 in PA
Livability — Whitaker
- Score
- 79/100
- State rank
- #256
- US rank
- #2232
Category grades
Schools grade is shown separately in the Schools card above.
Census & demographics
- Census place
- Whitaker, PA
- County
- Allegheny County · 1,022,028 people
- Metro
- Pittsburgh, PA
- Population (ZIP)
- 18,029
- Household income
- $55,714
- Rent vs Own
- Severe rent burden
- 669.0
Population outlook (Allegheny County) Hauer SSP2
- Today (2025)
- 1,250,282 people
- By 2030
- 1,256,482 · +0.5%
- By 2040
- 1,256,318 · +0.5%
- By 2050
- 1,244,169 · -0.5%
- By 2075
- 1,197,693 · -4.2%
- By 2100
- 1,093,187 · -12.6%
Race, ethnicity, and origin ACS 2023
- Neighborhood character
- Predominantly White (74%)
- Race & ethnicity
- White 74% Black 20% Two or more races 4% Hispanic / Latino 2%
- Common ancestry
- Romanian 6% Lithuanian 1% Scotch-Irish 1%
- Foreign-born
- 3% · South Korea, Canada
- Languages at home
- 95% English-only · Spanish 3% Russian/Polish/Slavic 1%
Political lean MEDSL · Allegheny
- 2024 margin
- Strong D (+20.3) · D 59.7% · R 39.4%
- 2008→2024 swing
- +4.8pp toward D · 2008: 15.5pp · 2024: 20.3pp
- All cycles
- 2024: D+20.3 2020: D+20.4 2016: D+16.4 2012: D+14.4 2008: D+15.5
Not yet ingested
- Civics
- —
Market trends
- HPI YoY
- ▼ -59.52%
- Current HPI
- 292.5607
- Rent YoY
- ▲ 4.06%
- Metro
- Pittsburgh, PA
- State GDP YoY
- ▲ 1.68%
- F500 in state
- 34
Industry mix (Fortune 500 HQ in PA)
| Industry | F500 HQs | Revenue |
|---|---|---|
| Healthcare | 2 | $309B |
|
||
| Insurance | 2 | $27B |
|
||
| Telecommunications / Media | 1 | $124B |
|
||
| Industrial Distribution | 1 | $22B |
|
||
| Financial Services | 1 | $20B |
|
||
| Chemicals / Materials | 1 | $18B |
|
||
Price history
-25.4% since first listed4 events — show timeline
- 2026-05-12 Pending — West Penn MLS
- 2026-04-27 Price Changed $44,000 West Penn MLS
- 2026-04-22 Price Changed $49,000 West Penn MLS
- 2026-04-20 Listed $59,000 West Penn MLS
Property tax history
+1.4%/yrLatest (2026): $1,853 · +1.6% YoY. Source: county tax records.
Cash-flow waterfall
monthlySold comps — $/sqft
last 12 mo · ≤1 miLoading sold comps…