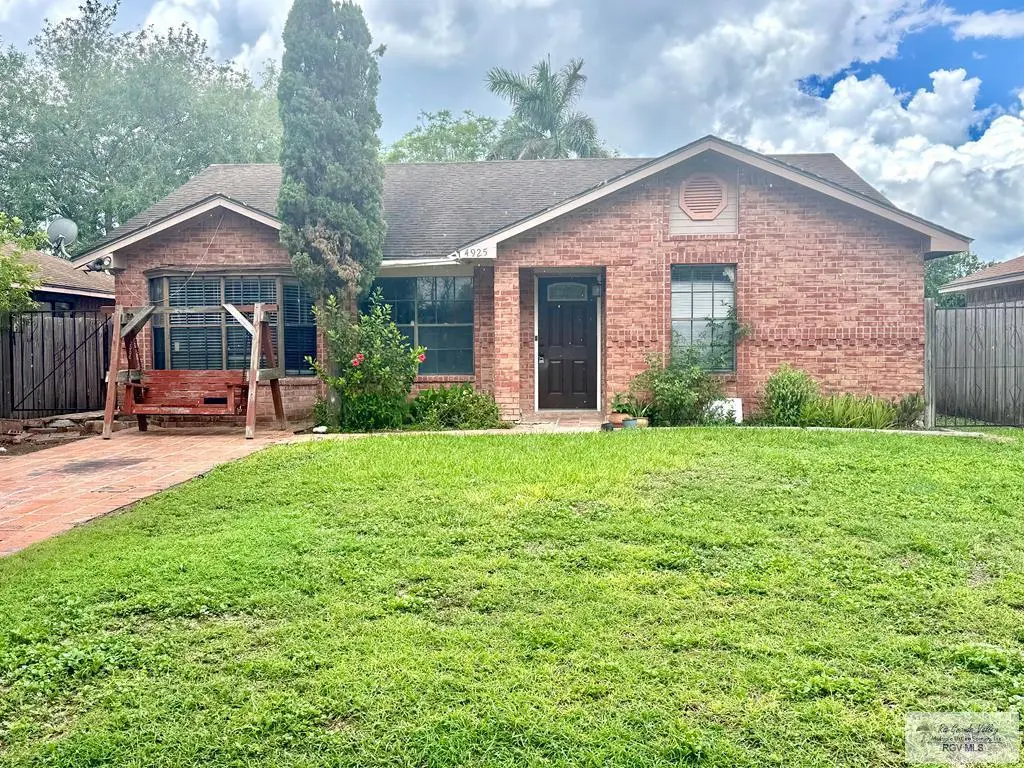
4925 Paseo Del Rey Dr · Brownsville, TX
Flood risk 3/10 · Minor
- FEMA flood zone
- X (unshaded)
- Chance of flooding over 30 yrs
- 0.2%
- Est. flood insurance / yr
- $507 – $1,088
Fire risk 4/10 · Minor
- Est. fire insurance / yr
- $1,222 – $2,270
Heat risk 9/10 · Severe
- Hot days now (above 110°F)
- 7 days/yr
- Hot days in 30 yrs
- 24 days/yr
Wind risk 9/10 · Severe
- Chance of severe wind over 30 yrs
- 99.0%
Air-quality risk 2/10 · Minimal
- Unhealthy air days now
- 1 days/yr
- Unhealthy air days in 30 yrs
- 1 days/yr
Risk factors via First Street. Map © Google.
Why this score? — see what drove the C+ grade
The composite is a weighted blend of 9 inputs, each scored 0–100. Each bar is that input's sub-score; the figure is the points it added to the 100-point composite (weight × sub-score).
- Cash flow +21.8/30.0
- ARV discount +14.3/15.0
- DSCR +7.0/10.0
- 1% rule +5.4/10.0
- Livability +4.0/5.0
- Rent growth +3.2/5.0
- Condition / age +2.5/5.0
- Schools +2.2/10.0
- Appreciation +0.0/10.0
$190,000
🖨 Deal sheet (PDF) 📄 Offer letter ✓ Due diligence
Listing remarks
This 3-bedroom, 2-bathroom property is the perfect project for investors or handy homeowners looking to build immediate equity. Situated just minutes from the Pablo Kisel Blvd, schools, and hospital. This home combines an unbeatable location with immense upside potential.
Key facts
- 6,000 sq ft lot
- Built 1986
- Listed 17 days
Property features AI
Finance
- Other: Located in the El Chaparral subdivision
Exterior
- Utilities: Public water; Public sewer
- Home design: Single-family residence; One story
- Construction: Brick veneer exterior; Composition roof; Slab foundation; Built as a house
- Exterior features: Covered patio/porch
Interior
- Flooring: Tile
- Bathrooms: 2 full bathrooms
- Heating & cooling: Central heating; Central air conditioning
- Interior features: Electric water heater; Tile flooring
Neighborhood map
What this means for you Summary
Snapshot
- This is a 3-bed/2.0-bath single-family listed at $190k.
Deal economics
- At list price, monthly cash flow is $295 ($4k/yr) — positive.
- The deal already cash-flows at list — no discount required.
- Meets the 1% rule at list price ($2k rent vs $190k).
- Recommended offer: $187k (1.5% below list) — sets the bar for market timing.
- Cap rate 8.2% vs local median 5.0% in Brownsville — top-decile yield for the area; either an underpriced asset or a hidden risk that comps aren't pricing in. Stress-test before assuming the spread holds.
Location & tenants
- Location reads 79/100 on livability (#62 in TX, #2,311 nationally) — a middle-class / working-renter tenant base. Strengths: commute A+, cost of living A+, housing A+; Watch: amenities D, crime D-, employment F.
- Brownsville ISD (urban): math 20% / reading 34% proficiency, ranked #710 of 826 in TX (top 86%) — low school quality limits family demand, transient renter base, plan for 1-2y turnover; 83% free/reduced lunch — lower-income household profile, screen leases tightly.
- Zoned schools: Burns El (math 22% / reading 27%, grade F, #3,052 of 4,322 statewide, top 74%, 604 students, 92% FRL); Vela Middle (math 19% / reading 37%, grade F, #1,143 of 1,662 statewide, top 69%, 638 students, 82% FRL); Hanna Early College H S (math 24% / reading 49%, grade F, #924 of 1,632 statewide, top 57%, 2,246 students, 88% FRL) — zoned schools at 87% FRL track the district average.
- Market conditions: Rents rising (+2.8%/yr); 416 active listings in the ZIP; 28 comparable units currently listed for rent nearby; rentals at typical pace (median 23d on market — plan ~3-4 weeks tenant-placement turnaround); 2,326 units permitted in Cameron County in 2024 (503 in 5+ unit buildings).
- This rent runs 34% of the median local income ($71k/yr) — at the standard rent-burdened threshold; future hikes will face affordability resistance.
Forward outlook
- Local home prices are declining (-3.0%/yr); year-one equity from $1k of loan paydown is wiped out by about $6k of value loss. Plan a longer hold.
- Cameron County population projected at +3% by 2050 — modest demand growth; plan on rents tracking national, not racing it.
Negotiation context
- It's been on market 17 days — a 2% lower offer ($187k) is reasonable based on typical stale-listing flexibility.
Risks & watch-outs
- Climate carrying-cost: severe wind risk, 99% chance of damaging wind over 30y; extreme-heat days projected 7→24/yr by 2055 (HVAC capex compounding) — expect insurance premiums to compound above CPI over the hold.
Questions for the listing agent
- Is there a deadline driving the sale (1031 exchange, divorce, estate, relocation)? That informs how much negotiation room exists.
- Crime grade is D in this area — have there been break-ins, vandalism, or insurance claims at this property in the last 3 years? What carrier currently insures it and at what premium?
- What's the average days-on-market for RENTAL listings here right now (not sales)? A rising rental-DOM trend means longer vacancies and softer asking-rent achievability than the comps imply.
- What's the recent tenant-quality profile in this submarket — average credit score on applications, eviction rate, late-payment / NSF rate, and stable-employment percentage? A property-management company in the area should have these aggregated.
- How much new for-sale + rental construction is in the pipeline within 1–3 miles? Heavy new supply typically softens prices + rents 12–24 months out; constrained supply supports both.
Investment metrics
- 1% rule
- 1.04% ✓
- Cap rate
- 8.16%
- Cash-on-cash
- 6.65%
- DSCR
- 1.30
- GRM
- 8.0
CMA / ARV
- ARV (on-the-fly)
- $223,568
- Comps found
- 4
Show comp detail 4 sales within ~0.75 mi
| Address | Dist | Beds/Ba | Sqft | Sold | Price | $/sf | Match |
|---|---|---|---|---|---|---|---|
| 987 Paso Del Rio Dr | 0.24mi | 3/2.0 | 1,457 (+2%) | 21mo | $199,999 | $137 | 68 |
| 4951 Daffodil Dr | 0.59mi | 3/2.0 | 1,498 (+5%) | 16mo | $239,500 | $160 | 50 |
| 1558 Guadalajara Ave | 0.49mi | 3/2.0 | 1,581 (+11%) | 17mo | $249,000 | $157 | 45 |
| 4840 Larkspur Dr | 0.72mi | 3/2.0 | 1,591 (+12%) | 6mo | $245,500 | $154 | 42 |
Match score weights: distance 35% · size 25% · config 20% · recency 20%. Top-matched comps best support the ARV.
Projected returns pro-forma
-3.0% appreciation · 2.77% rent growth · sell at horizon
- IRR
- -6.3%
- Equity multiple
- 0.77×
- Total profit
- $-12,457
- Equity at exit
- $28,330
- IRR
- 3.0%
- Equity multiple
- 1.22×
- Total profit
- $11,490
- Equity at exit
- $16,428
Cash invested: $53,200 (down + closing). Projections, not guarantees.
Landlord ↔ Tenant lean methodology
- Overall (STATE)
- 87 Strongly Landlord-Friendly
- State Texas
- 87 Strongly Landlord-Friendly · R+5
- County
- — inherits STATE
- City
- — inherits STATE
ZIP-level market 78526
- Home prices YoY
- -12.1%
- Rents YoY
- 2.8%
- Active inventory
- 416
- Price-to-rent
- 8.0×
Monthly cashflow live
- Estimated rent
- $1,984 high interval (Pro) →
- Mortgage (P&I)
- −$996
- Tax from tax record
- −$197 /mo · $2,361/yr
- Insurance
- −$79
- HOA
- −$0
- Vacancy / Maint / Mgmt
- −$417
- Net cashflow
- $295
Break-even live
Sensitivity live
| Price | -10% $402 | -5% $349 | +0% $295 | +5% $241 | +10% $187 |
|---|---|---|---|---|---|
| Rent | -10% $138 | -5% $217 | +0% $295 | +5% $373 | +10% $452 |
| Rate | -1.0pp $391 | -0.5pp $343 | base $295 | +0.5pp $246 | +1.0pp $196 |
UW: 25.0% down · 7.5% · 30yr · 1.5% tax · 5.0% vac · 8.0% maint · 8.0% mgmt
Financing live
Cash to close
- Down payment
- $47,500
- Closing costs
- $5,700
- Reserves months
- —
- Total cash needed
- —
Loan-product check · same deal, 3 products live
Conventional
25% down · 7.5% · 30yr
- Down + closing
- —
- Monthly P&I
- —
- Monthly cashflow
- —
- DSCR
- —
- Eligible?
- —
Personal DTI + credit; lowest rate.
DSCR
20% down · 8.5% · 30yr
- Down + closing
- —
- Monthly P&I
- —
- Monthly cashflow
- —
- DSCR
- —
- Eligible?
- —
No personal income docs; deal must DSCR.
Hard money
10% down · 12.0% · 12mo
- Down + closing
- —
- Monthly P&I
- —
- Monthly cashflow
- —
- DSCR
- —
- Eligible?
- —
Short-term bridge; refi at stabilization.
Rent comps 28 comps
| Address | Beds | Baths | Sqft | Rent | $/sqft | DOM | Units | Dist |
|---|---|---|---|---|---|---|---|---|
| 1124 Sierra Grande Dr Brownsville, TX | 3.0 | 2.0 | 1308 | $1,599 | $1.22 | 23d | 1 | 0.10mi |
| 4883 Camino Verde Dr Brownsville, TX | 3.0 | 2.0 | 1302 | $1,800 | $1.38 | 23d | 1 | 0.10mi |
| 1044 Alta Mesa Blvd Brownsville, TX | 3.0 | 2.0 | 1276 | $1,700 | $1.33 | 15d | 1 | 0.15mi |
| 1315 Pinion Dr Brownsville, TX | 3.0 | 2.0 | 1600 | $1,950 | $1.22 | 45d | 1 | 0.22mi |
| 944 Alta Mesa Blvd Brownsville, TX | 3.0 | 2.0 | 1582 | $1,900 | $1.20 | 23d | 1 | 0.27mi |
| 1587 Pinion Dr Brownsville, TX | 3.0 | 2.0 | 1226 | $1,750 | $1.43 | 45d | 1 | 0.50mi |
| 1683 Artemisa Ave Brownsville, TX | 3.0 | 2.0 | 1717 | $1,950 | $1.14 | 23d | 1 | 0.55mi |
| 1653 W San Marcelo Blvd Brownsville, TX | 3.0 | 2.0 | 1212 | $1,700 | $1.40 | 23d | 1 | 0.58mi |
| 4951 Daffodil Dr Brownsville, TX | 3.0 | 2.0 | 1498 | $2,400 | $1.60 | 23d | 1 | 0.61mi |
| 4951 Daffodil Dr Brownsville, TX | 3.0 | 2.0 | 1498 | $2,400 | $1.60 | 45d | 1 | 0.61mi |
| 2066 Saketa Ln Brownsville, TX | 3.0 | 2.0 | 1184 | $1,700 | $1.44 | 15d | 1 | 0.84mi |
| 2043 Saketa Ln Unit A Brownsville, TX | 3.0 | 2.0 | 910 | $1,700 | $1.87 | 23d | 1 | 0.88mi |
| 2018 Diamond Dr Unit A Brownsville, TX | 2.0 | 2.5 | 1465 | $1,750 | $1.19 | 45d | 1 | 0.90mi |
| 2019 Diamond Dr Unit B Brownsville, TX | 3.0 | 2.5 | 1565 | $1,950 | $1.25 | 23d | 1 | 0.91mi |
| 2011 Diamond Dr Unit A Brownsville, TX | 2.0 | 2.5 | 1465 | $2,900 | $1.98 | 23d | 1 | 0.92mi |
| 6732 Stone Oak Brownsville, TX | 3.0 | 2.0 | 1786 | $2,300 | $1.29 | 15d | 1 | 1.05mi |
| 2107 Carlos Ave Unit A Brownsville, TX | 3.0 | 2.0 | 1500 | $1,500 | $1.00 | 15d | 1 | 1.15mi |
| 6601 Garden Woods Ave Brownsville, TX | 3.0 | 2.0 | 1291 | $1,600 | $1.24 | 45d | 1 | 1.15mi |
| 15 Valles Ct Brownsville, TX | 3.0 | 2.0 | 1715 | $2,350 | $1.37 | 15d | 1 | 1.17mi |
| 5871 Greenwood Dr Brownsville, TX | 3.0 | 2.5 | 1820 | $1,950 | $1.07 | 15d | 1 | 1.18mi |
| 2100 W San Marcelo Blvd Apt 185 Brownsville, TX | 2.0 | 2.0 | 1024 | $1,500 | $1.46 | 23d | 1 | 1.24mi |
| 124 Barcelona Ave Brownsville, TX | 3.0 | 2.0 | 1708 | $2,900 | $1.70 | 23d | 1 | 1.29mi |
| 2100 W San Marcelo Blvd Brownsville, TX | 2.0–3.0 | 2.0–2.5 | 1069 | $1,500 | $1.40 | 45d | 2 | 1.32mi |
| 6978 Heritage Oak Dr Brownsville, TX | 3.0 | 2.0 | 1476 | $2,250 | $1.52 | 23d | 1 | 1.37mi |
| 2034 Toluca Dr Brownsville, TX | 3.0 | 2.0 | 1669 | $2,000 | $1.20 | 23d | 1 | 1.38mi |
| 184 Stars Ave Unit 7 Brownsville, TX | 3.0 | 2.0 | 1450 | $1,900 | $1.31 | 23d | 1 | 1.44mi |
| 35 La Paz Ct Brownsville, TX | 3.0 | 2.5 | 1660 | $1,900 | $1.14 | 15d | 1 | 1.47mi |
| 6705 Garden Woods Ave Unit B Brownsville, TX | 3.0 | 2.0 | 1350 | $1,550 | $1.15 | 15d | 1 | 1.50mi |
Listing history 13 events
-
2026-06-22days on market $190,000 Active 17 DOM
-
2026-06-18days on market $190,000 Active 14 DOM
-
2026-06-17days on market $190,000 Active 13 DOM
-
2026-06-16days on market $190,000 Active 12 DOM
-
2026-06-15days on market $190,000 Active 11 DOM
-
2026-06-14days on market $190,000 Active 9 DOM
-
2026-06-13days on market $190,000 Active 8 DOM
-
2026-06-10days on market $190,000 Active 6 DOM
-
2026-06-09days on market $190,000 Active 5 DOM
-
2026-06-08days on market $190,000 Active 4 DOM
-
2026-06-07days on market $190,000 Active 3 DOM
-
2026-06-05remarks 272-char remark
-
2026-06-05$190,000 Active 1 DOM
ⓘ Source: listings_history table (triggers on properties + properties_extension) + one-shot
backfill from property_details.listing_events for pre-trigger history.
Tax reassessment forecast TX · Resets to sale price
- Current annual tax
- $2,361 · $197/mo
- Projected year-2 tax
- $3,477 · $290/mo
- Expected delta
- +$1,116/yr (+$93/mo · 47.3%)
ⓘ Screening estimate from a state-policy table — verify with the county assessor before closing.
Climate risk First Street
- Flood 3/10 Moderate FEMA zone X (unshaded) · 20% chance over 30 yrs
- Wildfire 4/10 Moderate
- Heat 9/10 Extreme 7 d/yr ≥110°F today · 24 d/yr by 30 yrs out
- Wind 9/10 Extreme 99% chance of damaging wind over 30 yrs
- Air quality 2/10 Low 1 unhealthy d/yr today · 1 by 30 yrs out
Nearby sold comps map
Loading sold comps map…
Walkable amenities ~0.75 mi
Loading nearby amenities…
Taxation est. · year 1
- Rental income
- $23,806
- − Mortgage interest
- −$10,643
- − Property taxes
- −$2,361
- − Insurance
- −$950
- − Repairs & maintenance
- −$1,904
- − Management
- −$1,904
- − Depreciation
- −$5,527
- Taxable income
- $516
- Est. tax owed @ 24.0%
- −$124
- After-tax cash flow
- $3,415/yr
For passive investors: Depreciation is non-cash, so a rental often shows a tax loss while cash-flowing — sheltering income. Rental losses are passive: they offset passive income freely, and up to $25,000/yr can offset ordinary (W-2) income if you actively participate and your MAGI is under $100k (phasing out to $0 by $150k); unused losses carry forward. On sale, claimed depreciation is recaptured at up to 25%, and gains may owe capital-gains tax (a 1031 exchange can defer both). Figures are a year-1 estimate at your 24.0% rate — not tax advice; consult a CPA.
Schools (NCES district)
- District
- Brownsville ISD
- NCES district ID
- 4811680
- Math proficiency
- 20% ▼ -36.00%
- Reading proficiency
- 34% ▼ -13.00%
- Median HH income
- $30,490
- Composite
- 21.8/100
- National rank
- #8249
- State rank
- #710 of 826 in TX
Livability — Brownsville
- Score
- 79/100
- State rank
- #62
- US rank
- #2311
Category grades
Schools grade is shown separately in the Schools card above.
Census & demographics
- Census place
- Brownsville, TX
- County
- Cameron County · 310,734 people
- City population
- 212,132
- Metro
- Brownsville-Harlingen, TX
- Population (ZIP)
- 60,012
- Household income
- $70,565
- Rent vs Own
- Severe rent burden
- 1063.0
Population outlook (Cameron County) Hauer SSP2
- Today (2025)
- 441,603 people
- By 2030
- 448,113 · +1.5%
- By 2040
- 456,385 · +3.3%
- By 2050
- 456,294 · +3.3%
- By 2075
- 423,851 · -4.0%
- By 2100
- 342,787 · -22.4%
Race, ethnicity, and origin ACS 2023
- Neighborhood character
- Predominantly Hispanic (93%)
- Race & ethnicity
- Hispanic / Latino 93% Two or more races 45% White 4% Asian 2%
- Hispanic origin (detail)
- Mexican 87%
- Foreign-born
- 25% · Canada, Vietnam
- Languages at home
- 19% English-only · Spanish 79% Tagalog/Filipino 1%
Political lean MEDSL · Cameron
- 2024 margin
- Lean R (+5.8) · D 46.7% · R 52.5%
- 2008→2024 swing
- -34.6pp toward R · 2008: 28.8pp · 2024: -5.8pp
- All cycles
- 2024: R+5.8 2020: D+13.2 2016: D+32.5 2012: D+32.4 2008: D+28.8
Not yet ingested
- Civics
- —
Market trends
- HPI YoY
- ▼ -30.28%
- Current HPI
- 220.5233
- Rent YoY
- ▲ 2.77%
- Metro
- Brownsville-Harlingen, TX
- State GDP YoY
- ▲ 3.95%
- F500 in state
- 110
Industry mix (Fortune 500 HQ in TX)
| Industry | F500 HQs | Revenue |
|---|---|---|
| Energy | 16 | $1,198B |
|
||
| Technology | 5 | $198B |
|
||
| Engineering / Construction | 4 | $72B |
|
||
| Energy Services | 3 | $60B |
|
||
| Utilities | 3 | $41B |
|
||
| Healthcare | 2 | $330B |
|
||
Price history
1 event — show timeline
- 2026-06-04 Listed $190,000 RGVMLS
Property tax history
+1.4%/yrLatest (2025): $2,361 · +0.2% YoY. Source: county tax records.
Cash-flow waterfall
monthlySold comps — $/sqft
last 12 mo · ≤1 miLoading sold comps…