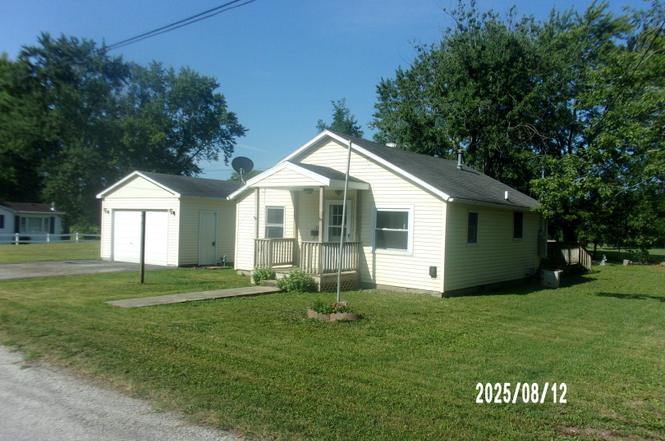
110 N Mansfield Ave · Milford, IL
Flood risk 1/10 · Minimal
- FEMA flood zone
- X (unshaded)
- Chance of flooding over 30 yrs
- 0.0%
- Est. flood insurance / yr
- $473 – $860
Fire risk 1/10 · Minimal
- Est. fire insurance / yr
- $804 – $1,492
Heat risk 3/10 · Minor
- Hot days now (above 104°F)
- 7 days/yr
- Hot days in 30 yrs
- 17 days/yr
Wind risk 2/10 · Minimal
- Chance of severe wind over 30 yrs
- 1.0%
Air-quality risk 2/10 · Minimal
- Unhealthy air days now
- 1 days/yr
- Unhealthy air days in 30 yrs
- 1 days/yr
Risk factors via First Street. Map © Google.
Why this score? — see what drove the B grade
The composite is a weighted blend of 9 inputs, each scored 0–100. Each bar is that input's sub-score; the figure is the points it added to the 100-point composite (weight × sub-score).
- Cash flow +30.0/30.0
- DSCR +10.0/10.0
- 1% rule +9.0/10.0
- ARV discount +7.5/15.0
- Appreciation +5.9/10.0
- Livability +3.1/5.0
- Rent growth +2.5/5.0
- Condition / age +2.5/5.0
- Schools +2.4/10.0
$62,500
🖨 Deal sheet (PDF) 📄 Offer letter ✓ Due diligence
Listing remarks
Great location on a dead end street, the home has some new updates, it is two bedrooms, one bathroom, nice kitchen with ne cabinets, large utility room, large back porch leading to large deck on rear of the home, nice 1.5 car garage and an extra lot for your special use or build a second garage.
Key facts
- Large deck
- Extra lot
- Large back porch
Tags
Property features AI
Finance
- Other: Living area source: assessor; Property age estimated 51–60 years
- Financial info: No special service area
- HOA & community: No master association fee required
Exterior
- Parking: Detached garage (garage owned) — approximately 1.5 garage/parking spaces
- Utilities: Public water; Public sewer
- Home design: Detached single-family home; One-story; Fee simple ownership; Built before 1978; Frame construction
- Construction: Frame construction; Not rebuilt or rehabbed
- Exterior features: Lot dimensions approximately 150 x 117; Lot between 0.50 and 0.99 acre; Zoned single-family
Interior
- Kitchen: Kitchen (12 x 12)
- Bedrooms: Main level master bedroom (12 x 12); Main level second bedroom (12 x 11)
- Bathrooms: 1 full bathroom
- Heating & cooling: Natural gas heating
- Interior features: Enclosed porch; Crawl space basement; 4 total rooms
- Laundry & utility: Main level laundry (12 x 10)
Neighborhood map
What this means for you Summary
Snapshot
- This is a 2-bed/1.0-bath single-family listed at $62k.
Deal economics
- At list price, monthly cash flow is $235 ($3k/yr) — positive.
- The deal already cash-flows at list — no discount required.
- Meets the 1% rule at list price ($874 rent vs $62k).
- Recommended offer: $55k (12.0% below list) — sets the bar for market timing.
Location & tenants
- Location reads 62/100 on livability (#854 in IL) — a middle-class / working-renter tenant base. Strengths: cost of living A+, crime A, housing A-; Watch: employment D, amenities F, commute F.
- Milford Area PSD 124 (rural): math 30% / reading 26% proficiency, ranked #278 of 620 in IL (top 45%) — low school quality limits family demand, transient renter base, plan for 1-2y turnover.
- Zoned schools: Milford Grade School West Campus (math 32% / reading 22%, grade F, #749 of 2,056 statewide, top 40%, 356 students, 0% FRL); Milford High School Campus (math 34% / reading 34%, grade F, #126 of 693 statewide, top 21%, 163 students, 0% FRL) — zoned schools average 0% FRL vs 47% district-wide (47 pts lower); this property's tenant base skews higher-income than the district average.
- Market conditions: 10 active listings in the ZIP; 14 units permitted in Iroquois County in 2024 (0 in 5+ unit buildings).
Forward outlook
- In year one you build about $2k of equity ($432 loan paydown + $1k appreciation (1.9% local appreciation)).
- Iroquois County population projected at -20% by 2050 — secular population decline; favor cash flow + early exit over multi-decade hold.
- At projected returns (1.9% appreciation + 3.0% rent growth), your $18k cash investment doubles in ~4 years — after that, you're playing with house money.
Negotiation context
- It's been on market 287 days — a 12% lower offer ($55k) is reasonable based on typical stale-listing flexibility.
- 2 sale attempts; this cycle's ask has dropped $8k (11%) from the opening price — seller is motivated, your offer sets the floor, not the list.
Questions for the listing agent
- It's been on market 287 days. Have you received any prior offers? Is the seller open to a 12% concession, seller financing, or rate buy-down credit?
- Why hasn't it sold? Are there any deal-killer items the seller is aware of (foundation, flood, title, zoning, code violations)?
- Is there a deadline driving the sale (1031 exchange, divorce, estate, relocation)? That informs how much negotiation room exists.
- Schools are D-rated, which usually means shorter tenancies and higher turnover. Who's the typical renter profile here, and what's been the actual vacancy rate?
- What's the average days-on-market for RENTAL listings here right now (not sales)? A rising rental-DOM trend means longer vacancies and softer asking-rent achievability than the comps imply.
- What's the recent tenant-quality profile in this submarket — average credit score on applications, eviction rate, late-payment / NSF rate, and stable-employment percentage? A property-management company in the area should have these aggregated.
- How much new for-sale + rental construction is in the pipeline within 1–3 miles? Heavy new supply typically softens prices + rents 12–24 months out; constrained supply supports both.
Investment metrics
- 1% rule
- 1.40% ✓
- Cap rate
- 10.81%
- Cash-on-cash
- 16.14%
- DSCR
- 1.72
- GRM
- 6.0
CMA / ARV
No comps found within radius.
Projected returns pro-forma
1.87% appreciation · 3.0% rent growth · sell at horizon
- IRR
- 20.2%
- Equity multiple
- 2.08×
- Total profit
- $18,891
- Equity at exit
- $24,211
- IRR
- 22.4%
- Equity multiple
- 3.92×
- Total profit
- $51,056
- Equity at exit
- $34,529
Cash invested: $17,500 (down + closing). Projections, not guarantees.
Landlord ↔ Tenant lean methodology
- Overall (STATE)
- 43 Moderately Tenant-Leaning
- State Illinois
- 43 Moderately Tenant-Leaning · D+7
- County
- — inherits STATE
- City
- — inherits STATE
ZIP-level market 60953
- Home prices YoY
- 1.2%
- Active inventory
- 10
- Price-to-rent
- 6.0×
Monthly cashflow live
- Estimated rent
- $874 medium interval (Pro) →
- Mortgage (P&I)
- −$328
- Tax from tax record
- −$101 /mo · $1,217/yr
- Insurance
- −$26
- HOA
- −$0
- Vacancy / Maint / Mgmt
- −$184
- Net cashflow
- $235
Break-even live
Sensitivity live
| Price | -10% $271 | -5% $253 | +0% $235 | +5% $218 | +10% $200 |
|---|---|---|---|---|---|
| Rent | -10% $166 | -5% $201 | +0% $235 | +5% $270 | +10% $304 |
| Rate | -1.0pp $267 | -0.5pp $251 | base $235 | +0.5pp $219 | +1.0pp $203 |
UW: 25.0% down · 7.5% · 30yr · 1.5% tax · 5.0% vac · 8.0% maint · 8.0% mgmt
Financing live
Cash to close
- Down payment
- $15,625
- Closing costs
- $1,875
- Reserves months
- —
- Total cash needed
- —
Loan-product check · same deal, 3 products live
Conventional
25% down · 7.5% · 30yr
- Down + closing
- —
- Monthly P&I
- —
- Monthly cashflow
- —
- DSCR
- —
- Eligible?
- —
Personal DTI + credit; lowest rate.
DSCR
20% down · 8.5% · 30yr
- Down + closing
- —
- Monthly P&I
- —
- Monthly cashflow
- —
- DSCR
- —
- Eligible?
- —
No personal income docs; deal must DSCR.
Hard money
10% down · 12.0% · 12mo
- Down + closing
- —
- Monthly P&I
- —
- Monthly cashflow
- —
- DSCR
- —
- Eligible?
- —
Short-term bridge; refi at stabilization.
Listing history 17 events
-
2026-06-16status $62,500 Pending 287 DOM
-
2026-06-15days on market $62,500 Active 287 DOM
-
2026-06-13days on market $62,500 Active 285 DOM
-
2026-06-12days on market $62,500 Active 284 DOM
-
2026-06-09days on market $62,500 Active 281 DOM
-
2026-06-08days on market $62,500 Active 280 DOM
-
2026-06-07days on market $62,500 Active 279 DOM
-
2026-06-05days on market $62,500 Active 277 DOM
-
2026-06-04days on market $62,500 Active 275 DOM
-
2026-06-02days on market $62,500 Active 274 DOM
-
2026-06-01days on market $62,500 Active 273 DOM
-
2026-05-31days on market $62,500 Active 272 DOM
-
2026-05-31days on market $62,500 Active 271 DOM
-
2026-05-08price $62,500
-
2026-03-02status Active
-
2026-02-10status Pending
-
2025-08-12$70,000 Active
ⓘ Source: listings_history table (triggers on properties + properties_extension) + one-shot
backfill from property_details.listing_events for pre-trigger history.
Tax reassessment forecast IL · Partial reset (capped growth)
- Current annual tax
- $1,217 · $101/mo
- Projected year-2 tax
- $1,318 · $110/mo
- Expected delta
- +$101/yr (+$8/mo · 8.3%)
ⓘ Screening estimate from a state-policy table — verify with the county assessor before closing.
Climate risk First Street
- Flood 1/10 Low FEMA zone X (unshaded) · 0% chance over 30 yrs
- Wildfire 1/10 Low
- Heat 3/10 Moderate 7 d/yr ≥104°F today · 17 d/yr by 30 yrs out
- Wind 2/10 Low 100% chance of damaging wind over 30 yrs
- Air quality 2/10 Low 1 unhealthy d/yr today · 1 by 30 yrs out
Nearby sold comps map
Loading sold comps map…
Walkable amenities ~0.75 mi
Loading nearby amenities…
Taxation est. · year 1
- Rental income
- $10,490
- − Mortgage interest
- −$3,501
- − Property taxes
- −$1,217
- − Insurance
- −$312
- − Repairs & maintenance
- −$839
- − Management
- −$839
- − Depreciation
- −$1,818
- Taxable income
- $1,963
- Est. tax owed @ 24.0%
- −$471
- After-tax cash flow
- $2,354/yr
For passive investors: Depreciation is non-cash, so a rental often shows a tax loss while cash-flowing — sheltering income. Rental losses are passive: they offset passive income freely, and up to $25,000/yr can offset ordinary (W-2) income if you actively participate and your MAGI is under $100k (phasing out to $0 by $150k); unused losses carry forward. On sale, claimed depreciation is recaptured at up to 25%, and gains may owe capital-gains tax (a 1031 exchange can defer both). Figures are a year-1 estimate at your 24.0% rate — not tax advice; consult a CPA.
Schools (NCES district)
- District
- Milford Area PSD 124
- NCES district ID
- 1701416
- Math proficiency
- 30% ▲ 2.00%
- Reading proficiency
- 26% ▼ -11.00%
- Median HH income
- $44,333
- Composite
- 24.03/100
- National rank
- #7767
- State rank
- #278 of 620 in IL
Livability — Milford
- Score
- 62/100
- State rank
- #854
- US rank
- #16734
Category grades
Schools grade is shown separately in the Schools card above.
Census & demographics
- Census place
- Milford, IL
- City population
- 2,141
- Population (ZIP)
- 2,141
Population outlook (Iroquois County) Hauer SSP2
- Today (2025)
- 26,826 people
- By 2030
- 25,771 · -3.9%
- By 2040
- 23,589 · -12.1%
- By 2050
- 21,523 · -19.8%
- By 2075
- 17,998 · -32.9%
- By 2100
- 14,979 · -44.2%
Race, ethnicity, and origin ACS 2023
- Neighborhood character
- Predominantly White (98%)
- Race & ethnicity
- White 98% Hispanic / Latino 2%
- Common ancestry
- Lithuanian 2% Italian 2% Iranian 2%
- Foreign-born
- 2%
Political lean MEDSL · Iroquois
- 2024 margin
- Solid R (+57.3) · D 20.6% · R 78.0% · Other 1.4%
- 2008→2024 swing
- -27.5pp toward R · 2008: -29.8pp · 2024: -57.3pp
- All cycles
- 2024: R+57.3 2020: R+56.7 2016: R+56.0 2012: R+44.7 2008: R+29.8
Not yet ingested
- Civics
- —
Market trends
- HPI YoY
- ▲ 1.87%
- Current HPI
- 156.755
- Rent YoY
- —
- Metro
- —
- State GDP YoY
- ▲ 1.59%
- F500 in state
- 60
Industry mix (Fortune 500 HQ in IL)
| Industry | F500 HQs | Revenue |
|---|---|---|
| Insurance | 4 | $201B |
|
||
| Consumer Goods | 4 | $87B |
|
||
| Industrial Machinery | 3 | $64B |
|
||
| Healthcare | 2 | $55B |
|
||
| Retail / Pharmacy | 1 | $148B |
|
||
| Agriculture / Food | 1 | $86B |
|
||
Price history
-10.7% since first listed4 events — show timeline
- 2026-05-08 Price Changed $62,500 MRED as Distributed by MLS Grid
- 2026-03-02 Relisted — MRED as Distributed by MLS Grid
- 2026-02-10 Pending — MRED as Distributed by MLS Grid
- 2025-08-12 Listed $70,000 MRED as Distributed by MLS Grid
Property tax history
+2.3%/yrLatest (2023): $1,217 · +7.8% YoY. Source: county tax records.
Cash-flow waterfall
monthlySold comps — $/sqft
last 12 mo · ≤1 miLoading sold comps…