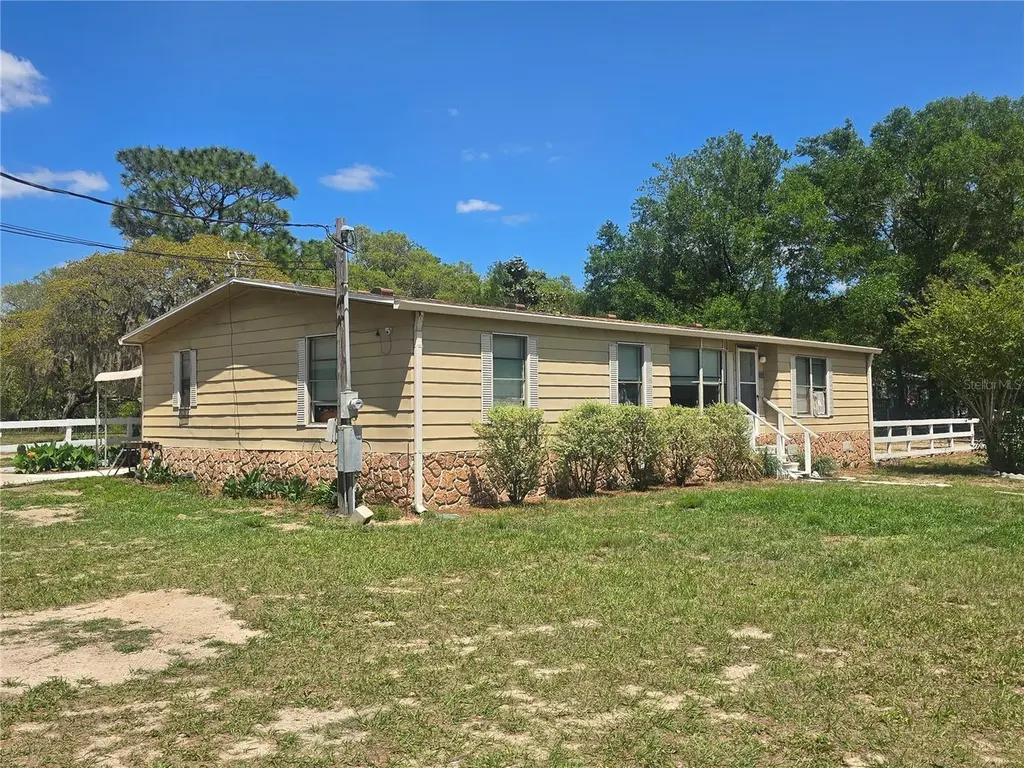
1099 E LA Salle St · Hernando, FL
Flood risk 1/10 · Minimal
- FEMA flood zone
- X (unshaded)
- Chance of flooding over 30 yrs
- 0.0%
- Est. flood insurance / yr
- $507 – $1,088
Fire risk 5/10 · Moderate
- Est. fire insurance / yr
- $947 – $1,759
Heat risk 9/10 · Severe
- Hot days now (above 108°F)
- 7 days/yr
- Hot days in 30 yrs
- 24 days/yr
Wind risk 9/10 · Severe
- Chance of severe wind over 30 yrs
- 99.0%
Air-quality risk 1/10 · Minimal
- Unhealthy air days now
- 0 days/yr
- Unhealthy air days in 30 yrs
- 0 days/yr
Risk factors via First Street. Map © Google.
Why this score? — see what drove the B+ grade
The composite is a weighted blend of 9 inputs, each scored 0–100. Each bar is that input's sub-score; the figure is the points it added to the 100-point composite (weight × sub-score).
- Cash flow +30.0/30.0
- ARV discount +15.0/15.0
- DSCR +10.0/10.0
- 1% rule +9.2/10.0
- Schools +4.1/10.0
- Livability +3.6/5.0
- Rent growth +2.5/5.0
- Condition / age +2.5/5.0
- Appreciation +0.0/10.0
$152,000
🖨 Deal sheet 📄 Offer letter ✓ Due diligence
Listing remarks MLS
An opportunity you don’t want to miss to build real equity on the Nature Coast. Sitting on 1.25 acres, this 3 bedroom, 2 bathroom home is ready for its next owner to step in and create value. The lot is cleared and usable with a fenced backyard for kids and pets, plus a detached two car garage for all your tools, toys, and projects. Inside offers a solid starting point with tile flooring, newer cabinetry, a wood burning fireplace, bay windows bringing in great natural light, and a split floor plan with the space buyers are looking for. Located in Hernando near the Withlacoochee State Trail and the Tsala Apopka Chain of Lakes, you get quick access to biking, fishing, and the outdoor lifestyle that makes this area so desirable. Whether you’re looking for a home to make your own or an investment with upside, this one checks the boxes.
Key facts
- Split floor plan
- Tile flooring
- Bay windows
Tags
Property features AI
Finance
- Other: Property is on approximately 1.25 acres (lot dimensions ~181 x 300); Additional workshop structure on the property; Homestead exempt; One well and one septic on site; Zoned LDRMH (low-density residential/manufactured housing)
- HOA & community: No homeowners association indicated
Exterior
- Parking: Driveway; 2-car garage
- Utilities: Well water; Septic tank; Cable connected; Electricity connected
- Home design: Manufactured double-wide home; Single-story (one level); Home faces south
- Construction: Vinyl siding; Shingle roof; Block and pier/pillar/post foundation; Built as a manufactured home (double wide)
- Exterior features: Rear porch; Private mailbox; Outdoor storage; Wire and wood fencing; Cleared, private, paved lot
Interior
- Kitchen: Dishwasher; Range; Refrigerator
- Bedrooms: 3 bedrooms
- Flooring: Ceramic tile
- Bathrooms: 2 full bathrooms
- Heating & cooling: No central heating specified; No central cooling specified
- Interior features: Ceiling fans; Open floor plan; Split bedroom layout; Wood-burning fireplace
- Laundry & utility: Dedicated laundry room
Neighborhood map
What this means for you Summary
Snapshot
- This is a 3-bed/2.0-bath manufactured listed at $152k.
Deal economics
- At list price, monthly cash flow is $794 ($10k/yr) — positive.
- The deal already cash-flows at list — no discount required.
- Meets the 1% rule at list price ($2k rent vs $152k).
- Recommended offer: $147k (3.0% below list) — sets the bar for market timing.
- Cap rate 12.6% vs local median 5.6% in Hernando — top-decile yield for the area; either an underpriced asset or a hidden risk that comps aren't pricing in. Stress-test before assuming the spread holds.
Location & tenants
- Location reads 71/100 on livability (#402 in FL) — a middle-class / working-renter tenant base. Strengths: cost of living A+, housing A+, health & safety A+; Watch: amenities F, commute F, employment D-.
- Citrus (rural): math 49% / reading 50% proficiency, ranked #44 of 73 in FL (top 60%) — families likely to look elsewhere, expect single-tenant / working-renter base with shorter leases.
- Zoned schools: Central Ridge Elementary School (math 41% / reading 44%, grade F, #1,383 of 2,144 statewide, top 65%, 723 students, 64% FRL); Lecanto High School (math 46% / reading 53%, grade D, #179 of 667 statewide, top 29%, 1,630 students, 46% FRL) — zoned schools at 55% FRL track the district average.
- Market conditions: 444 active listings in the ZIP; 3 comparable units currently listed for rent nearby; rentals at typical pace (median 21d on market — plan ~3-4 weeks tenant-placement turnaround); 2,443 units permitted in Citrus County in 2024 (0 in 5+ unit buildings).
- At $2,162/mo this rent would consume 45% of the median local household income ($57k/yr) (locally 314% of renters already pay >50% of income on rent) — very limited rent-growth headroom before tenants either downsize or default.
Forward outlook
- Local home prices are declining (-3.0%/yr); year-one equity from $1k of loan paydown is wiped out by about $5k of value loss. Plan a longer hold.
- Citrus County population projected to shrink 10% by 2050 — rents likely to lag national; underwrite the cash flow, not the appreciation.
- At projected returns (-3.0% appreciation + 3.0% rent growth), your $43k cash investment doubles in ~6 years — after that, you're playing with house money.
Negotiation context
- It's been on market 58 days — a 3% lower offer ($147k) is reasonable based on typical stale-listing flexibility.
- 2 sale attempts; this cycle's ask has dropped $17k (10%) from the opening price — seller is motivated, your offer sets the floor, not the list.
- Current owner paid $105k; 45% above their basis — modest negotiation headroom, anchor on the comps not their cost.
Risks & watch-outs
- Climate carrying-cost: severe wind risk, 99% chance of damaging wind over 30y; moderate wildfire risk; extreme-heat days projected 7→24/yr by 2055 (HVAC capex compounding) — expect insurance premiums to compound above CPI over the hold.
Questions for the listing agent
- It's been on market 58 days. Have you received any prior offers? Is the seller open to a 3% concession, seller financing, or rate buy-down credit?
- Is there a deadline driving the sale (1031 exchange, divorce, estate, relocation)? That informs how much negotiation room exists.
- What's the average days-on-market for RENTAL listings here right now (not sales)? A rising rental-DOM trend means longer vacancies and softer asking-rent achievability than the comps imply.
- What's the recent tenant-quality profile in this submarket — average credit score on applications, eviction rate, late-payment / NSF rate, and stable-employment percentage? A property-management company in the area should have these aggregated.
- How much new for-sale + rental construction is in the pipeline within 1–3 miles? Heavy new supply typically softens prices + rents 12–24 months out; constrained supply supports both.
Investment metrics
- 1% rule
- 1.42% ✓
- Cap rate
- 12.56%
- Cash-on-cash
- 22.38%
- DSCR
- 2.00
- GRM
- 5.9
CMA / ARV
- ARV (on-the-fly)
- $274,666
- Comps found
- 6
Show comp detail 6 sales within ~0.75 mi
| Address | Dist | Beds/Ba | Sqft | Sold | Price | $/sf | Match |
|---|---|---|---|---|---|---|---|
| 5471 N Highland Park Dr | 0.52mi | 3/2.0 | 1,680 (-2%) | 0mo | $315,000 | $188 | 73 |
| 1180 E Winnetka St | 0.20mi | 4/2.0 (+1) | 1,760 (+3%) | 15mo | $227,500 | $129 | 67 |
| 5272 N Western Dr | 0.35mi | 3/2.0 | 1,800 (+6%) | 10mo | $290,000 | $161 | 66 |
| 1308 E Winnetka St | 0.29mi | 3/2.0 | 1,568 (-8%) | 14mo | $259,900 | $166 | 62 |
| 617 E Winnetka St | 0.51mi | 4/2.0 (+1) | 1,782 (+4%) | 11mo | $220,000 | $123 | 54 |
| 5755 N Highland Park Dr | 0.66mi | 4/2.0 (+1) | 1,512 (-11%) | 1mo | $210,000 | $139 | 44 |
Match score weights: distance 35% · size 25% · config 20% · recency 20%. Top-matched comps best support the ARV.
Projected returns pro-forma
-3.0% appreciation · 3.0% rent growth · sell at horizon
- IRR
- 15.2%
- Equity multiple
- 1.61×
- Total profit
- $25,863
- Equity at exit
- $22,664
- IRR
- 23.8%
- Equity multiple
- 3.05×
- Total profit
- $87,399
- Equity at exit
- $13,142
Cash invested: $42,560 (down + closing). Projections, not guarantees.
Landlord ↔ Tenant lean methodology
- Overall (STATE)
- 87 Strongly Landlord-Friendly
- State Florida
- 87 Strongly Landlord-Friendly · R+3
- County
- — inherits STATE
- City
- — inherits STATE
ZIP-level market 34442
- Home prices YoY
- -21.9%
- Active inventory
- 444
- Price-to-rent
- 5.9×
Monthly cashflow live
- Estimated rent
- $2,162 medium interval (Pro) →
- Mortgage (P&I)
- −$797
- Tax from tax record
- −$54 /mo · $646/yr
- Insurance
- −$63
- HOA
- −$0
- Vacancy / Maint / Mgmt
- −$454
- Net cashflow
- $794
Break-even live
UW: 25.0% down · 7.5% · 30yr · 1.5% tax · 5.0% vac · 8.0% maint · 8.0% mgmt
Financing live
Cash to close
- Down payment
- $38,000
- Closing costs
- $4,560
- Reserves months
- —
- Total cash needed
- —
Loan-product check · same deal, 3 products live
Conventional
25% down · 7.5% · 30yr
- Down + closing
- —
- Monthly P&I
- —
- Monthly cashflow
- —
- DSCR
- —
- Eligible?
- —
Personal DTI + credit; lowest rate.
DSCR
20% down · 8.5% · 30yr
- Down + closing
- —
- Monthly P&I
- —
- Monthly cashflow
- —
- DSCR
- —
- Eligible?
- —
No personal income docs; deal must DSCR.
Hard money
10% down · 12.0% · 12mo
- Down + closing
- —
- Monthly P&I
- —
- Monthly cashflow
- —
- DSCR
- —
- Eligible?
- —
Short-term bridge; refi at stabilization.
Rent comps 3 comps
| Address | Beds | Baths | Sqft | Rent | $/sqft | DOM | Units | Dist |
|---|---|---|---|---|---|---|---|---|
| 5135 N Western Dr Hernando, FL | 3.0 | 2.0 | 1512 | $1,825 | $1.21 | 21d | 1 | 0.52mi |
| 174 W Romany Loop Beverly Hills, FL | 2.0 | 2.0 | 1748 | $2,200 | $1.26 | 21d | 1 | 1.26mi |
| 262 W Romany Loop Beverly Hills, FL | 2.0 | 2.0 | 1981 | $2,750 | $1.39 | 21d | 1 | 1.41mi |
Listing history 17 events
-
2026-06-15days on market $152,000 Active 58 DOM
-
2026-06-14days on market $152,000 Active 56 DOM
-
2026-06-13statusdays on market $152,000 Active 55 DOM
-
2026-06-07statusdays on market $152,000 Pending 54 DOM
-
2026-06-03days on market $152,000 Active 50 DOM
-
2026-06-03price $152,000 Active 49 DOM
-
2026-06-02days on market $169,000 Active 49 DOM
-
2026-06-01days on market $169,000 Active 48 DOM
-
2026-05-31days on market $169,000 Active 47 DOM
-
2026-05-30days on market $169,000 Active 46 DOM
-
2026-04-14$169,000 Active
Show marketing remark (855 chars)
An opportunity you don’t want to miss to build real equity on the Nature Coast. Sitting on 1.25 acres, this 3 bedroom, 2 bathroom home is ready for its next owner to step in and create value. The lot is cleared and usable with a fenced backyard for kids and pets, plus a detached two car garage for all your tools, toys, and projects. Inside offers a solid starting point with tile flooring, newer cabinetry, a wood burning fireplace, bay windows bringing in great natural light, and a split floor plan with the space buyers are looking for. Located in Hernando near the Withlacoochee State Trail and the Tsala Apopka Chain of Lakes, you get quick access to biking, fishing, and the outdoor lifestyle that makes this area so desirable. Whether you’re looking for a home to make your own or an investment with upside, this one checks the boxes.
-
2026-04-14$169,000 Active 855-char remark
Show marketing remark (855 chars)
An opportunity you don’t want to miss to build real equity on the Nature Coast. Sitting on 1.25 acres, this 3 bedroom, 2 bathroom home is ready for its next owner to step in and create value. The lot is cleared and usable with a fenced backyard for kids and pets, plus a detached two car garage for all your tools, toys, and projects. Inside offers a solid starting point with tile flooring, newer cabinetry, a wood burning fireplace, bay windows bringing in great natural light, and a split floor plan with the space buyers are looking for. Located in Hernando near the Withlacoochee State Trail and the Tsala Apopka Chain of Lakes, you get quick access to biking, fishing, and the outdoor lifestyle that makes this area so desirable. Whether you’re looking for a home to make your own or an investment with upside, this one checks the boxes.
-
2019-06-04soldstatus $105,000
-
1999-02-17soldstatus $53,000
-
1996-01-04soldstatus $44,000
-
1995-12-01soldstatus $44,000
-
1992-09-01soldstatus $47,500
ⓘ Source: listings_history table (triggers on properties + properties_extension) + one-shot
backfill from property_details.listing_events for pre-trigger history.
Tax reassessment forecast FL · Resets to sale price
- Current annual tax
- $646 · $54/mo
- Projected year-2 tax
- $1,262 · $105/mo
- Expected delta
- +$615/yr (+$51/mo · 95.2%)
ⓘ Screening estimate from a state-policy table — verify with the county assessor before closing.
Climate risk First Street
- Flood 1/10 Low FEMA zone X (unshaded) · 0% chance over 30 yrs
- Wildfire 5/10 Major
- Heat 9/10 Extreme 7 d/yr ≥108°F today · 24 d/yr by 30 yrs out
- Wind 9/10 Extreme 99% chance of damaging wind over 30 yrs
- Air quality 1/10 Low 0 unhealthy d/yr today · 0 by 30 yrs out
Nearby sold comps map
Loading sold comps map…
Walkable amenities ~0.75 mi
Loading nearby amenities…
Taxation est. · year 1
- Rental income
- $25,943
- − Mortgage interest
- −$8,514
- − Property taxes
- −$646
- − Insurance
- −$760
- − Repairs & maintenance
- −$2,075
- − Management
- −$2,075
- − Depreciation
- −$4,422
- Taxable income
- $7,449
- Est. tax owed @ 24.0%
- −$1,788
- After-tax cash flow
- $7,735/yr
For passive investors: Depreciation is non-cash, so a rental often shows a tax loss while cash-flowing — sheltering income. Rental losses are passive: they offset passive income freely, and up to $25,000/yr can offset ordinary (W-2) income if you actively participate and your MAGI is under $100k (phasing out to $0 by $150k); unused losses carry forward. On sale, claimed depreciation is recaptured at up to 25%, and gains may owe capital-gains tax (a 1031 exchange can defer both). Figures are a year-1 estimate at your 24.0% rate — not tax advice; consult a CPA.
Schools (NCES district)
- District
- Citrus
- NCES district ID
- 1200270
- Math proficiency
- 49% ▼ -10.00%
- Reading proficiency
- 50% ▼ -6.00%
- Median HH income
- $38,618
- Composite
- 41.28/100
- National rank
- #3519
- State rank
- #44 of 73 in FL
Livability — Hernando
- Score
- 71/100
- State rank
- #402
- US rank
- #7137
Category grades
Schools grade is shown separately in the Schools card above.
Census & demographics
- Census place
- Hernando, FL
- County
- Citrus County · 111,314 people
- City population
- 17,281
- Metro
- Homosassa Springs, FL
- Population (ZIP)
- 17,281
- Household income
- $57,259
- Rent vs Own
- Severe rent burden
- 314.0
Population outlook (Citrus County) Hauer SSP2
- Today (2025)
- 138,622 people
- By 2030
- 136,886 · -1.3%
- By 2040
- 132,009 · -4.8%
- By 2050
- 125,196 · -9.7%
- By 2075
- 108,570 · -21.7%
- By 2100
- 84,454 · -39.1%
Race, ethnicity, and origin ACS 2023
- Neighborhood character
- Predominantly White (90%)
- Race & ethnicity
- White 90% Hispanic / Latino 4% Two or more races 3% Asian 2% Black 2%
- Common ancestry
- Romanian 4% Slovak 4% Lithuanian 3%
- Foreign-born
- 8% · Canada, China, South Korea
- Languages at home
- 93% English-only · Spanish 3% German/W. Germanic 2% Tagalog/Filipino 1%
Political lean MEDSL · Citrus
- 2024 margin
- Solid R (+45.9) · D 26.8% · R 72.6%
- 2008→2024 swing
- -29.8pp toward R · 2008: -16.1pp · 2024: -45.9pp
- All cycles
- 2024: R+45.9 2020: R+41.0 2016: R+39.7 2012: R+21.9 2008: R+16.1
Not yet ingested
- Civics
- —
Market trends
- HPI YoY
- ▼ -76.70%
- Current HPI
- 273.3262
- Rent YoY
- —
- Metro
- Homosassa Springs, FL
- State GDP YoY
- ▲ 3.28%
- F500 in state
- 36
Industry mix (Fortune 500 HQ in FL)
| Industry | F500 HQs | Revenue |
|---|---|---|
| Industrial Technology | 2 | $29B |
|
||
| Insurance | 2 | $17B |
|
||
| Retail | 1 | $60B |
|
||
| Technology Distribution | 1 | $58B |
|
||
| Homebuilding | 1 | $35B |
|
||
| Technology Manufacturing | 1 | $35B |
|
||
Price history
+255.8% since first listed7 events — show timeline
- 2026-04-14 Listed $169,000 RACC
- 2026-04-14 Listed $169,000 Stellar MLS as Distributed by MLS Grid
- 2019-06-04 Sold (Public Records) $105,000 Public Records
- 1999-02-17 Sold (Public Records) $53,000 Public Records
- 1996-01-04 Sold (Public Records) $44,000 Public Records
- 1995-12-01 Sold (Public Records) $44,000 Public Records
- 1992-09-01 Sold (Public Records) $47,500 Public Records
Property tax history
+11.3%/yrLatest (2025): $646 · +9.4% YoY. Source: county tax records.
Cash-flow waterfall
monthlySold comps — $/sqft
last 12 mo · ≤1 miLoading sold comps…