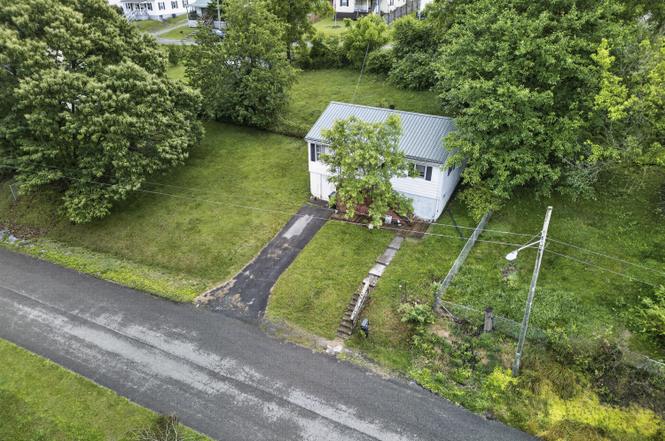
221 Mumpower Dr · Bristol, VA
Flood risk 9/10 · Severe
- FEMA flood zone
- X (unshaded)
- Chance of flooding over 30 yrs
- 0.99%
- Est. flood insurance / yr
- $473 – $860
Fire risk 3/10 · Minor
- Est. fire insurance / yr
- $666 – $1,236
Heat risk 4/10 · Minor
- Hot days now (above 98°F)
- 7 days/yr
- Hot days in 30 yrs
- 21 days/yr
Wind risk 2/10 · Minimal
- Chance of severe wind over 30 yrs
- —
Air-quality risk 2/10 · Minimal
- Unhealthy air days now
- 1 days/yr
- Unhealthy air days in 30 yrs
- 2 days/yr
Risk factors via First Street. Map © Google.
Why this score? — see what drove the D+ grade
The composite is a weighted blend of 9 inputs, each scored 0–100. Each bar is that input's sub-score; the figure is the points it added to the 100-point composite (weight × sub-score).
- Cash flow +22.4/30.0
- DSCR +7.2/10.0
- Schools +5.2/10.0
- 1% rule +4.7/10.0
- Livability +3.7/5.0
- Rent growth +2.5/5.0
- Condition / age +2.5/5.0
- ARV discount +0.0/15.0
- Appreciation +0.0/10.0
$139,900
🖨 Deal sheet 📄 Offer letter ✓ Due diligence
Listing remarks MLS
Great Location! Minutes to Downtown Bristol! PRICED TO SELL! This 3- Bedroom 1 Bath. Cozy Living room functional kitchen. Perfect for first-time home buyer or investor. Newer Roof. Schedule Your Showing Today!
Key facts
- Newer roof
- 0.3 acre lot
- Built 1959
Tags
Property features AI
Exterior
- Parking: Driveway with asphalt surface
- Security: Smoke detector(s)
- Utilities: Public water; Public sewer; Natural gas available; Electricity connected; Water connected; Sewer connected
- Home design: Single family residence; Two levels; Residential property in fixer condition; Facing information not provided
- Construction: Aluminum siding; Block foundation; Metal roof; Built with block basement
- Exterior features: Front porch; Back yard fencing; Cleared topography; Has a view
Interior
- Kitchen: Electric range; Microwave; Refrigerator
- Flooring: Hardwood; Laminate
- Bathrooms: 1 full bathroom
- Heating & cooling: Central heating; Central air; Ceiling fan(s)
- Interior features: Laminate counters; Hardwood and laminate flooring; Basement with block construction; Total of 5 rooms
- Laundry & utility: Electric dryer hookup
Neighborhood map
What this means for you Summary
Snapshot
- This is a 3-bed/1.0-bath single-family listed at $140k.
Deal economics
- At list price, monthly cash flow is $177 ($2k/yr) — positive.
- The deal already cash-flows at list — no discount required.
- To meet the 1% rule (rent ≥ 1% of price), the offer needs to be $136k (2.9% below list).
- Recommended offer: $136k (2.9% below list) — sets the bar for 1% rule.
- Cap rate 8.3% vs local median 4.9% in Bristol — top-decile yield for the area; either an underpriced asset or a hidden risk that comps aren't pricing in. Stress-test before assuming the spread holds.
Location & tenants
- Location reads 74/100 on livability (#140 in VA, #4,544 nationally) — a middle-class / working-renter tenant base. Strengths: cost of living A+, housing A+, health & safety A+; Watch: crime F, commute F, employment F.
- Bristol City Public School District (urban): math 57% / reading 70% proficiency, ranked #53 of 131 in VA (top 40%) — acceptable for families but not a draw, mixed tenant base, ~2y average lease.
- Zoned schools: Highland View Elementary (math 42% / reading 62%, grade C-, #696 of 1,108 statewide, top 66%, 175 students, 98% FRL); Virginia Middle (math 56% / reading 71%, grade B+, #128 of 342 statewide, top 39%, 487 students, 101% FRL); Virginia High (math 62% / reading 77%, grade B, #159 of 319 statewide, top 53%, 637 students, 100% FRL) — zoned schools average 100% FRL vs 58% district-wide (42 pts higher); higher-poverty schools than district average — tighter screening recommended.
- Market conditions: 156 active listings in the ZIP; 3 comparable units currently listed for rent nearby; rentals leasing fast (median 13d on market — plan ~1-2 weeks tenant-placement turnaround); 15 units permitted in Bristol city in 2024 (5 in 5+ unit buildings).
Forward outlook
- Local home prices are declining (-3.0%/yr); year-one equity from $967 of loan paydown is wiped out by about $4k of value loss. Plan a longer hold.
- Bristol County population projected at -20% by 2050 — secular population decline; favor cash flow + early exit over multi-decade hold.
Negotiation context
- Only 4 days on market — expect competitive offers; lowballing is unlikely to land.
- 2 sale attempts with the ask held roughly flat each time — persistent listings suggest the price (not the market) is what's stuck; bring a comps-based counter.
- Current owner paid $69k; list at $140k implies a 103% gain — meaningful room to come down on a strong offer.
Risks & watch-outs
- Watch-outs: flood insurance adds $56/mo; built in 1959 — expect roof / HVAC / electrical / plumbing capex.
- Climate carrying-cost: severe flood risk — expect insurance premiums to compound above CPI over the hold.
Questions for the listing agent
- Built in 1959 — when were the roof, HVAC, electrical panel, plumbing, and water heater last replaced?
- What's the actual annual flood-insurance premium (NFIP or private), and is the property in a SFHA with mandatory coverage?
- Is there a deadline driving the sale (1031 exchange, divorce, estate, relocation)? That informs how much negotiation room exists.
- Schools are A-rated — typically a magnet for longer-tenancy family renters. What's the average tenant stay here, and is there a school-zone premium baked into asking?
- Crime grade is F in this area — have there been break-ins, vandalism, or insurance claims at this property in the last 3 years? What carrier currently insures it and at what premium?
- The area grade is low — what's the realistic commute time and amenity access for the typical tenant pool here? Any planned neighborhood developments (good or bad) we should know about?
- What's the average days-on-market for RENTAL listings here right now (not sales)? A rising rental-DOM trend means longer vacancies and softer asking-rent achievability than the comps imply.
- What's the recent tenant-quality profile in this submarket — average credit score on applications, eviction rate, late-payment / NSF rate, and stable-employment percentage? A property-management company in the area should have these aggregated.
- How much new for-sale + rental construction is in the pipeline within 1–3 miles? Heavy new supply typically softens prices + rents 12–24 months out; constrained supply supports both.
Investment metrics
- 1% rule
- 0.97% ✗
- Cap rate
- 8.29%
- Cash-on-cash
- 7.14%
- DSCR
- 1.32
- GRM
- 8.6
CMA / ARV
- ARV (on-the-fly)
- $114,972
- Comps found
- 12
Show comp detail 12 sales within ~0.75 mi
| Address | Dist | Beds/Ba | Sqft | Sold | Price | $/sf | Match |
|---|---|---|---|---|---|---|---|
| 136 Beaver St #1 | 0.06mi | 2/1.0 (-1) | 816 (+2%) | 2mo | $140,000 | $172 | 88 |
| 1002 Massachusetts Ave | 0.28mi | 2/1.0 (-1) | 804 (0%) | 8mo | $115,000 | $143 | 75 |
| 174 Beaver St | 0.03mi | 2/1.0 (-1) | 772 (-4%) | 18mo | $142,700 | $185 | 72 |
| 165 Hughes St | 0.40mi | 2/1.0 (-1) | 804 (0%) | 10mo | $148,000 | $184 | 68 |
| 540 Madison St | 0.23mi | 2/1.0 (-1) | 870 (+8%) | 4mo | $35,000 | $40 | 67 |
| 1507 Massachusetts Ave | 0.44mi | 2/1.0 (-1) | 789 (-2%) | 9mo | $119,700 | $152 | 64 |
| 159 Hillside Ave | 0.48mi | 2/1.0 (-1) | 809 (+1%) | 11mo | $109,000 | $135 | 62 |
| 624 Maple St | 0.51mi | 2/1.0 (-1) | 728 (-10%) | 1mo | $40,000 | $55 | 54 |
| 129 Hillside Ave | 0.49mi | 2/1.0 (-1) | 784 (-2%) | 17mo | $99,900 | $127 | 54 |
| 158 Fuller St | 0.71mi | 2/1.0 (-1) | 864 (+8%) | 0mo | $75,000 | $87 | 49 |
| 617 Dixie St | 0.71mi | 2/1.0 (-1) | 842 (+5%) | 9mo | $65,500 | $78 | 47 |
| 650 Suffolk Ave | 0.65mi | 2/1.0 (-1) | 768 (-4%) | 16mo | $145,000 | $189 | 44 |
Match score weights: distance 35% · size 25% · config 20% · recency 20%. Top-matched comps best support the ARV.
Projected returns pro-forma
-3.0% appreciation · 3.0% rent growth · sell at horizon
- IRR
- -7.9%
- Equity multiple
- 0.71×
- Total profit
- $-11,393
- Equity at exit
- $20,860
- IRR
- 1.6%
- Equity multiple
- 1.12×
- Total profit
- $4,536
- Equity at exit
- $12,096
Cash invested: $39,172 (down + closing). Projections, not guarantees.
Landlord ↔ Tenant lean methodology
- Overall (STATE)
- 55 Moderately Landlord-Leaning
- State Virginia
- 55 Moderately Landlord-Leaning · D+2
- County
- — inherits STATE
- City
- — inherits STATE
ZIP-level market 24201
- Active inventory
- 156
- Price-to-rent
- 8.6×
Monthly cashflow live
- Estimated rent
- $1,358 medium interval (Pro) →
- Mortgage (P&I)
- −$734
- Tax from tax record
- −$48 /mo · $575/yr
- Insurance
- −$58
- Flood insurance flood zone
- −$56 /mo · $666/yr
- HOA
- −$0
- Vacancy / Maint / Mgmt
- −$285
- Net cashflow
- $177
Break-even live
UW: 25.0% down · 7.5% · 30yr · 1.5% tax · 5.0% vac · 8.0% maint · 8.0% mgmt
Financing live
Cash to close
- Down payment
- $34,975
- Closing costs
- $4,197
- Reserves months
- —
- Total cash needed
- —
Loan-product check · same deal, 3 products live
Conventional
25% down · 7.5% · 30yr
- Down + closing
- —
- Monthly P&I
- —
- Monthly cashflow
- —
- DSCR
- —
- Eligible?
- —
Personal DTI + credit; lowest rate.
DSCR
20% down · 8.5% · 30yr
- Down + closing
- —
- Monthly P&I
- —
- Monthly cashflow
- —
- DSCR
- —
- Eligible?
- —
No personal income docs; deal must DSCR.
Hard money
10% down · 12.0% · 12mo
- Down + closing
- —
- Monthly P&I
- —
- Monthly cashflow
- —
- DSCR
- —
- Eligible?
- —
Short-term bridge; refi at stabilization.
Rent comps 3 comps
| Address | Beds | Baths | Sqft | Rent | $/sqft | DOM | Units | Dist |
|---|---|---|---|---|---|---|---|---|
| 135 Kingsolver St Bristol, VA | 2.0 | 1.0 | 1000 | $1,400 | $1.40 | 21d | 1 | 0.07mi |
| 1733 Dunlap St Bristol, VA | 3.0 | 1.0 | 900 | $1,250 | $1.39 | 13d | 1 | 0.56mi |
| 1225 Carriage Cir #203 Bristol, VA | 2.0 | 2.0 | 968 | $1,150 | $1.19 | 13d | 1 | 1.04mi |
Listing history 5 events
-
2026-06-19days on market $139,900 Active 4 DOM
-
2026-06-18days on market $139,900 Active 3 DOM
-
2026-06-17days on market $139,900 Active 2 DOM
-
2026-06-15remarks 221-char remark
Show marketing remark (210 chars)
Great Location! Minutes to Downtown Bristol! PRICED TO SELL! This 3- Bedroom 1 Bath. Cozy Living room functional kitchen. Perfect for first-time home buyer or investor. Newer Roof. Schedule Your Showing Today!
-
2026-06-15$139,900 Active 1 DOM
Show marketing remark (210 chars)
Great Location! Minutes to Downtown Bristol! PRICED TO SELL! This 3- Bedroom 1 Bath. Cozy Living room functional kitchen. Perfect for first-time home buyer or investor. Newer Roof. Schedule Your Showing Today!
ⓘ Source: listings_history table (triggers on properties + properties_extension) + one-shot
backfill from property_details.listing_events for pre-trigger history.
Tax reassessment forecast VA · Resets to sale price
- Current annual tax
- $575 · $48/mo
- Projected year-2 tax
- $1,147 · $96/mo
- Expected delta
- +$572/yr (+$48/mo · 99.4%)
ⓘ Screening estimate from a state-policy table — verify with the county assessor before closing.
Climate risk First Street
- Flood 9/10 Extreme FEMA zone X (unshaded) · 99% chance over 30 yrs
- Wildfire 3/10 Moderate
- Heat 4/10 Moderate 7 d/yr ≥98°F today · 21 d/yr by 30 yrs out
- Wind 2/10 Low
- Air quality 2/10 Low 1 unhealthy d/yr today · 2 by 30 yrs out
Nearby sold comps map
Loading sold comps map…
Walkable amenities ~0.75 mi
Loading nearby amenities…
Taxation est. · year 1
- Rental income
- $16,296
- − Mortgage interest
- −$7,837
- − Property taxes
- −$575
- − Insurance
- −$1,366
- − Repairs & maintenance
- −$1,304
- − Management
- −$1,304
- − Depreciation
- −$4,070
- Taxable loss
- −$159
- Est. tax savings @ 24.0%
- +$38
- After-tax cash flow
- $2,167/yr
For passive investors: Depreciation is non-cash, so a rental often shows a tax loss while cash-flowing — sheltering income. Rental losses are passive: they offset passive income freely, and up to $25,000/yr can offset ordinary (W-2) income if you actively participate and your MAGI is under $100k (phasing out to $0 by $150k); unused losses carry forward. On sale, claimed depreciation is recaptured at up to 25%, and gains may owe capital-gains tax (a 1031 exchange can defer both). Figures are a year-1 estimate at your 24.0% rate — not tax advice; consult a CPA.
Schools (NCES district)
- District
- Bristol City Public School District
- NCES district ID
- 5100450
- Math proficiency
- 57% ▼ -24.00%
- Reading proficiency
- 70% ▼ -6.00%
- Median HH income
- $33,978
- Composite
- 52.4/100
- National rank
- #1579
- State rank
- #53 of 131 in VA
Livability — Bristol
- Score
- 74/100
- State rank
- #140
- US rank
- #4544
Category grades
Schools grade is shown separately in the Schools card above.
Census & demographics
- Census place
- Bristol, VA
- City population
- 16,039
- Population (ZIP)
- 16,039
Population outlook (Bristol County) Hauer SSP2
- Today (2025)
- 16,113 people
- By 2030
- 15,510 · -3.7%
- By 2040
- 14,121 · -12.4%
- By 2050
- 12,847 · -20.3%
- By 2075
- 9,870 · -38.7%
- By 2100
- 7,883 · -51.1%
Race, ethnicity, and origin ACS 2023
- Neighborhood character
- Predominantly White (85%)
- Race & ethnicity
- White 85% Black 7% Two or more races 6% Hispanic / Latino 3%
- Common ancestry
- Slovak 4% Serbian 1% Iranian 0%
- Foreign-born
- 1% · Canada
- Languages at home
- 98% English-only · Spanish 2%
Political lean MEDSL · Bristol
- 2024 margin
- Solid R (+39.7) · D 29.8% · R 69.5%
- 2008→2024 swing
- -13.6pp toward R · 2008: -26.0pp · 2024: -39.7pp
- All cycles
- 2024: R+39.7 2020: R+38.9 2016: R+43.8 2012: R+31.1 2008: R+26.0
Not yet ingested
- Civics
- —
Market trends
- HPI YoY
- ▼ -206.40%
- Current HPI
- 196.2099
- Rent YoY
- —
- Metro
- —
- State GDP YoY
- ▲ 2.40%
- F500 in state
- 50
Industry mix (Fortune 500 HQ in VA)
| Industry | F500 HQs | Revenue |
|---|---|---|
| Aerospace / Defense | 4 | $236B |
|
||
| Technology / Defense | 3 | $32B |
|
||
| Financial Services | 2 | $176B |
|
||
| Utilities | 2 | $27B |
|
||
| Insurance | 2 | $25B |
|
||
| Technology | 2 | $15B |
|
||
Price history
+102.8% since first listed3 events — show timeline
- 2026-06-15 Listed $139,900 TVRMLS
- 2026-06-15 Listed $139,900 SWVAR
- 2007-08-24 Sold (Public Records) $69,000 Public Records
Cash-flow waterfall
monthlySold comps — $/sqft
last 12 mo · ≤1 miLoading sold comps…