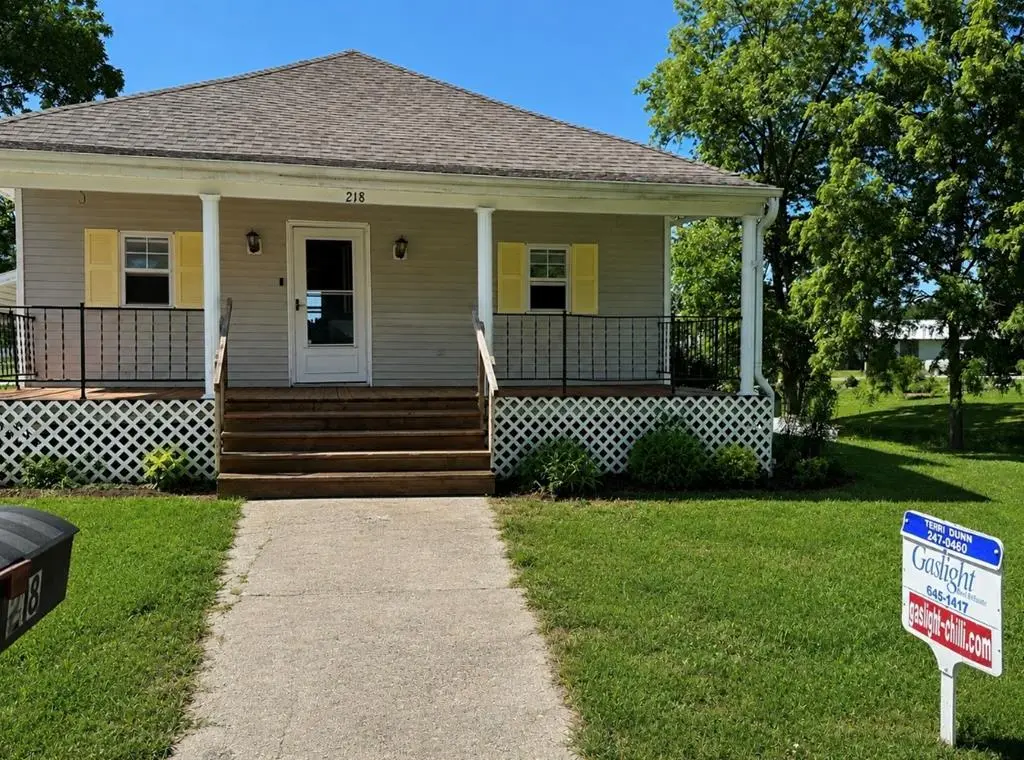
218 E Jackson St · Linneus, MO
Flood risk 1/10 · Minimal
- FEMA flood zone
- X (unshaded)
- Chance of flooding over 30 yrs
- 0.0%
- Est. flood insurance / yr
- $473 – $860
Fire risk 3/10 · Minor
- Est. fire insurance / yr
- $1,054 – $1,958
Heat risk 3/10 · Minor
- Hot days now (above 106°F)
- 7 days/yr
- Hot days in 30 yrs
- 16 days/yr
Wind risk 2/10 · Minimal
- Chance of severe wind over 30 yrs
- —
Air-quality risk 2/10 · Minimal
- Unhealthy air days now
- 1 days/yr
- Unhealthy air days in 30 yrs
- 1 days/yr
Risk factors via First Street. Map © Google.
Why this score? — see what drove the C- grade
The composite is a weighted blend of 9 inputs, each scored 0–100. Each bar is that input's sub-score; the figure is the points it added to the 100-point composite (weight × sub-score).
- Cash flow +18.1/30.0
- ARV discount +7.5/15.0
- Appreciation +6.5/10.0
- DSCR +5.7/10.0
- Schools +4.0/10.0
- 1% rule +3.7/10.0
- Livability +2.9/5.0
- Rent growth +2.5/5.0
- Condition / age +2.5/5.0
$135,000
🖨 Deal sheet 📄 Offer letter ✓ Due diligence
Listing remarks MLS
Cozy and well kept 3-4 BR 2 Full Bath, Updates throughout! Lots of kitchen space! Fully finished basement. Walk out basement. Oversized lot! Close to ballparks, playground & tennis courts! Located in Linneus MO.
Key facts
- Covered front porch
- Newer roof
- Finished basement
Tags
Property features AI
Exterior
- Utilities: Public water; Public sewer
- Home design: Single-family residence; Residential property
- Construction: Vinyl siding; Asphalt roof
- Exterior features: Deck; Storm doors
Interior
- Bathrooms: 2 full bathrooms
- Heating & cooling: Central air conditioning
- Interior features: Electric water heater; Full walk-out basement
Neighborhood map
What this means for you Summary
Snapshot
- This is a 3-bed/2.0-bath single-family listed at $135k.
Deal economics
- At list price, monthly cash flow is $119 ($1k/yr) — positive.
- The deal already cash-flows at list — no discount required.
- To meet the 1% rule (rent ≥ 1% of price), the offer needs to be $118k (12.8% below list).
- Recommended offer: $118k (12.8% below list) — sets the bar for 1% rule.
Location & tenants
- Location reads 58/100 on livability (#609 in MO) — a working-class tenant base; expect higher turnover. Strengths: cost of living A+, housing A+; Watch: employment D+, schools F, crime F.
- Linn County R-I (rural): math 40% / reading 50% proficiency, ranked #213 of 535 in MO (top 40%) — families likely to look elsewhere, expect single-tenant / working-renter base with shorter leases.
- Market conditions: 4 active listings in the ZIP; 4 units permitted in Linn County in 2024 (0 in 5+ unit buildings).
Forward outlook
- In year one you build about $5k of equity ($933 loan paydown + $4k appreciation (2.9% local appreciation)).
- Linn County population projected at -21% by 2050 — secular population decline; favor cash flow + early exit over multi-decade hold.
- At projected returns (2.9% appreciation + 3.0% rent growth), your $38k cash investment doubles in ~6 years — after that, you're playing with house money.
- By year 7, paydown + projected appreciation supports a ~$31k cash-out refi (75% LTV) — recoverable capital for the next deal without selling this one.
Negotiation context
- Only 6 days on market — expect competitive offers; lowballing is unlikely to land.
- 2 sale attempts since 5y ago with the ask held roughly flat each time — persistent listings suggest the price (not the market) is what's stuck; bring a comps-based counter.
- Current owner paid $35k; list at $135k implies a 286% gain — meaningful room to come down on a strong offer.
Risks & watch-outs
- Watch-outs: built in 1920 — expect roof / HVAC / electrical / plumbing capex.
Questions for the listing agent
- Built in 1920 — when were the roof, HVAC, electrical panel, plumbing, and water heater last replaced?
- Is there a deadline driving the sale (1031 exchange, divorce, estate, relocation)? That informs how much negotiation room exists.
- Schools are F-rated, which usually means shorter tenancies and higher turnover. Who's the typical renter profile here, and what's been the actual vacancy rate?
- Crime grade is F in this area — have there been break-ins, vandalism, or insurance claims at this property in the last 3 years? What carrier currently insures it and at what premium?
- What's the average days-on-market for RENTAL listings here right now (not sales)? A rising rental-DOM trend means longer vacancies and softer asking-rent achievability than the comps imply.
- What's the recent tenant-quality profile in this submarket — average credit score on applications, eviction rate, late-payment / NSF rate, and stable-employment percentage? A property-management company in the area should have these aggregated.
- How much new for-sale + rental construction is in the pipeline within 1–3 miles? Heavy new supply typically softens prices + rents 12–24 months out; constrained supply supports both.
Investment metrics
- 1% rule
- 0.87% ✗
- Cap rate
- 7.35%
- Cash-on-cash
- 3.77%
- DSCR
- 1.17
- GRM
- 9.6
CMA / ARV
No comps found within radius.
Projected returns pro-forma
2.92% appreciation · 3.0% rent growth · sell at horizon
- IRR
- 10.8%
- Equity multiple
- 1.61×
- Total profit
- $23,223
- Equity at exit
- $60,125
- IRR
- 13.1%
- Equity multiple
- 2.92×
- Total profit
- $72,695
- Equity at exit
- $92,215
Cash invested: $37,800 (down + closing). Projections, not guarantees.
Landlord ↔ Tenant lean methodology
- Overall (STATE)
- 81 Strongly Landlord-Friendly
- State Missouri
- 81 Strongly Landlord-Friendly · R+10
- County
- — inherits STATE
- City
- — inherits STATE
ZIP-level market 64653
- Home prices YoY
- 1.0%
- Active inventory
- 4
- Price-to-rent
- 9.6×
Monthly cashflow live
- Estimated rent
- $1,177 medium interval (Pro) →
- Mortgage (P&I)
- −$708
- Tax from tax record
- −$47 /mo · $559/yr
- Insurance
- −$56
- HOA
- −$0
- Vacancy / Maint / Mgmt
- −$247
- Net cashflow
- $119
Break-even live
UW: 25.0% down · 7.5% · 30yr · 1.5% tax · 5.0% vac · 8.0% maint · 8.0% mgmt
Financing live
Cash to close
- Down payment
- $33,750
- Closing costs
- $4,050
- Reserves months
- —
- Total cash needed
- —
Loan-product check · same deal, 3 products live
Conventional
25% down · 7.5% · 30yr
- Down + closing
- —
- Monthly P&I
- —
- Monthly cashflow
- —
- DSCR
- —
- Eligible?
- —
Personal DTI + credit; lowest rate.
DSCR
20% down · 8.5% · 30yr
- Down + closing
- —
- Monthly P&I
- —
- Monthly cashflow
- —
- DSCR
- —
- Eligible?
- —
No personal income docs; deal must DSCR.
Hard money
10% down · 12.0% · 12mo
- Down + closing
- —
- Monthly P&I
- —
- Monthly cashflow
- —
- DSCR
- —
- Eligible?
- —
Short-term bridge; refi at stabilization.
Listing history 6 events
-
2026-06-18days on market $135,000 Active 6 DOM
-
2026-06-17days on market $135,000 Active 5 DOM
-
2026-06-16days on market $135,000 Active 4 DOM
-
2026-06-15days on market $135,000 Active 3 DOM
-
2026-06-13remarks 417-char remark
-
2026-06-13$135,000 Active 1 DOM
ⓘ Source: listings_history table (triggers on properties + properties_extension) + one-shot
backfill from property_details.listing_events for pre-trigger history.
Tax reassessment forecast MO · Resets to sale price
- Current annual tax
- $559 · $47/mo
- Projected year-2 tax
- $1,310 · $109/mo
- Expected delta
- +$750/yr (+$63/mo · 134.2%)
ⓘ Screening estimate from a state-policy table — verify with the county assessor before closing.
Climate risk First Street
- Flood 1/10 Low FEMA zone X (unshaded) · 0% chance over 30 yrs
- Wildfire 3/10 Moderate
- Heat 3/10 Moderate 7 d/yr ≥106°F today · 16 d/yr by 30 yrs out
- Wind 2/10 Low
- Air quality 2/10 Low 1 unhealthy d/yr today · 1 by 30 yrs out
Nearby sold comps map
Loading sold comps map…
Walkable amenities ~0.75 mi
Loading nearby amenities…
Taxation est. · year 1
- Rental income
- $14,119
- − Mortgage interest
- −$7,562
- − Property taxes
- −$559
- − Insurance
- −$675
- − Repairs & maintenance
- −$1,130
- − Management
- −$1,130
- − Depreciation
- −$3,927
- Taxable loss
- −$864
- Est. tax savings @ 24.0%
- +$207
- After-tax cash flow
- $1,632/yr
For passive investors: Depreciation is non-cash, so a rental often shows a tax loss while cash-flowing — sheltering income. Rental losses are passive: they offset passive income freely, and up to $25,000/yr can offset ordinary (W-2) income if you actively participate and your MAGI is under $100k (phasing out to $0 by $150k); unused losses carry forward. On sale, claimed depreciation is recaptured at up to 25%, and gains may owe capital-gains tax (a 1031 exchange can defer both). Figures are a year-1 estimate at your 24.0% rate — not tax advice; consult a CPA.
Schools (NCES district)
- District
- Linn County R-I
- NCES district ID
- 2906000
- Math proficiency
- 40% ▬ 0.00%
- Reading proficiency
- 50% ▬ 0.00%
- Median HH income
- $38,428
- Composite
- 39.74/100
- National rank
- #7995
- State rank
- #213 of 535 in MO
Livability — Linneus
- Score
- 58/100
- State rank
- #609
- US rank
- #21250
Category grades
Schools grade is shown separately in the Schools card above.
Census & demographics
- Census place
- Linneus, MO
- Population (ZIP)
- 533
Population outlook (Linn County) Hauer SSP2
- Today (2025)
- 11,437 people
- By 2030
- 10,946 · -4.3%
- By 2040
- 9,969 · -12.8%
- By 2050
- 9,056 · -20.8%
- By 2075
- 7,342 · -35.8%
- By 2100
- 5,656 · -50.5%
Race, ethnicity, and origin ACS 2023
- Neighborhood character
- Predominantly White (96%)
- Race & ethnicity
- White 96% Two or more races 2% Hispanic / Latino 2%
- Common ancestry
- Lithuanian 2% Iranian 1% Italian 1%
- Foreign-born
- 0% · Canada
- Languages at home
- 93% English-only · German/W. Germanic 7% Spanish 1%
Political lean MEDSL · Linn
- 2024 margin
- Solid R (+57.2) · D 20.8% · R 78.1% · Other 1.1%
- 2008→2024 swing
- -48.8pp toward R · 2008: -8.5pp · 2024: -57.2pp
- All cycles
- 2024: R+57.2 2020: R+53.9 2016: R+51.1 2012: R+23.5 2008: R+8.5
Not yet ingested
- Civics
- —
Market trends
- HPI YoY
- ▲ 2.92%
- Current HPI
- 288.3026
- Rent YoY
- —
- Metro
- —
- State GDP YoY
- ▲ 1.84%
- F500 in state
- 20
Industry mix (Fortune 500 HQ in MO)
| Industry | F500 HQs | Revenue |
|---|---|---|
| Healthcare | 1 | $163B |
|
||
| Insurance | 1 | $21B |
|
||
| Industrial Technology | 1 | $17B |
|
||
| Retail | 1 | $16B |
|
||
| Industrial Distribution | 1 | $10B |
|
||
| Utilities | 1 | $9B |
|
||
Price history
+285.7% since first listed6 events — show timeline
- 2026-06-12 Listed $135,000 NECAR
- 2021-08-05 Sold (Public Records) — Public Records
- 2021-08-04 Sold (MLS) — NECAR
- 2021-06-01 Listed $80,000 NECAR
- 2014-08-04 Sold (Public Records) $35,000 Public Records
- 1999-01-22 Sold (Public Records) — Public Records
Property tax history
+2.6%/yrLatest (2025): $559 · +2.0% YoY. Source: county tax records.
Cash-flow waterfall
monthlySold comps — $/sqft
last 12 mo · ≤1 miLoading sold comps…