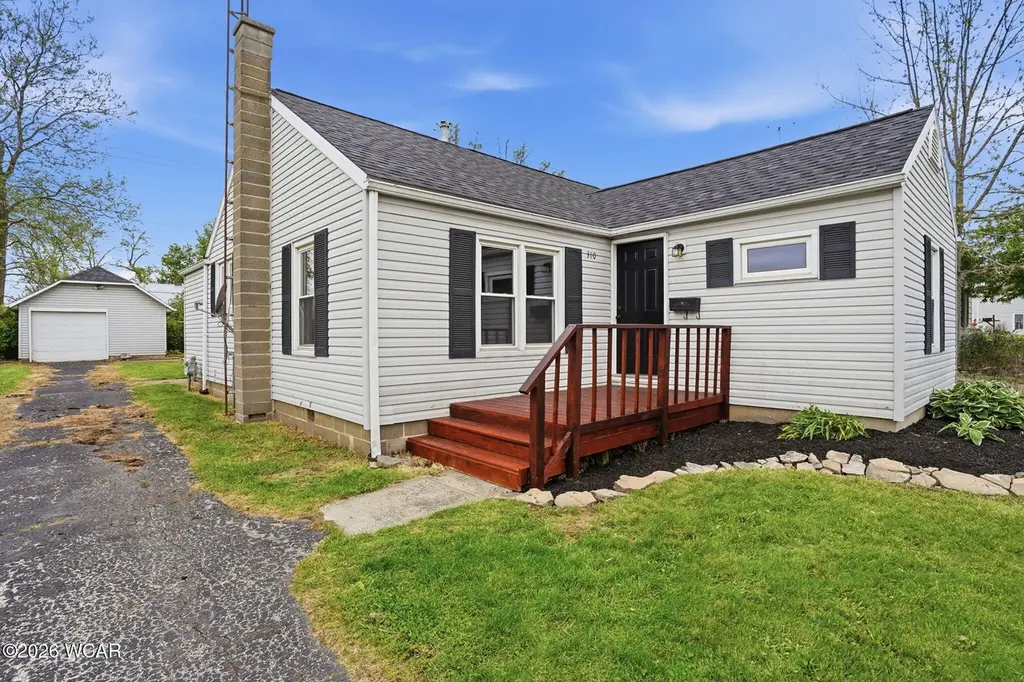
310 S High St · Kenton, OH
Flood risk 1/10 · Minimal
- FEMA flood zone
- X
- Chance of flooding over 30 yrs
- 0.0%
- Est. flood insurance / yr
- $473 – $860
Fire risk 2/10 · Minimal
- Est. fire insurance / yr
- $713 – $1,323
Heat risk 3/10 · Minor
- Hot days now (above 99°F)
- 7 days/yr
- Hot days in 30 yrs
- 18 days/yr
Wind risk 2/10 · Minimal
- Chance of severe wind over 30 yrs
- —
Air-quality risk 2/10 · Minimal
- Unhealthy air days now
- 1 days/yr
- Unhealthy air days in 30 yrs
- 3 days/yr
Risk factors via First Street. Map © Google.
Why this score? — see what drove the D grade
The composite is a weighted blend of 9 inputs, each scored 0–100. Each bar is that input's sub-score; the figure is the points it added to the 100-point composite (weight × sub-score).
- Cash flow +12.9/30.0
- ARV discount +9.1/15.0
- Schools +4.0/10.0
- DSCR +3.9/10.0
- Livability +3.7/5.0
- 1% rule +3.3/10.0
- Rent growth +2.5/5.0
- Condition / age +2.5/5.0
- Appreciation +0.0/10.0
$125,000
🖨 Deal sheet 📄 Offer letter ✓ Due diligence
Listing remarks
Affordable, updated, and move-in ready! This well-maintained 3-bedroom home is one of the best values currently on the market in Kenton. Situated on a quiet in-town street, this property offers comfort, convenience, and major updates already completed for the next owner. Enjoy a spacious yard perfect for entertaining, pets, or outdoor activities, along with a detached one-car garage for extra storage and parking. Inside, you'll find a remodeled bathroom, beautiful hardwood and vinyl flooring, and a functional layout that feels warm and inviting. Recent improvements include a brand new shingle roof installed this year, plus gas furnace and central air for year-round comfort and efficiency. W
Key facts
- Spacious yard
- Gas furnace
- Remodeled bathroom
Tags
Property features AI
Finance
- Other: Property listed by Century 21 Sunway Realty-Kenton
Exterior
- Parking: Attached garage (1 car)
- Utilities: Public water; Public sewer; Electricity connected; Natural gas connected
- Home design: Single-family residence; One-story
- Construction: Vinyl siding; Block foundation
- Exterior features: Front porch
Interior
- Kitchen: Oven; Refrigerator; No additional kitchen details provided
- Bedrooms: Total of 8 rooms (bedroom breakdown not provided)
- Bathrooms: 1 full bathroom
- Heating & cooling: Central air conditioning; Forced air heating with natural gas
- Interior features: Updated/remodeled interior; Dryer, Oven, Refrigerator, Washer
- Laundry & utility: Washer and Dryer included
Neighborhood map
What this means for you Summary
Snapshot
- This is a 3-bed/1.0-bath single-family listed at $125k.
Deal economics
- At list price, monthly cash flow is $-8 ($-97/yr) — negative.
- To cash-flow at today's rent, offer at most $124k (1.1% below list).
- To meet the 1% rule (rent ≥ 1% of price), the offer needs to be $103k (17.5% below list).
- Recommended offer: $103k (17.5% below list) — sets the bar for 1% rule.
- Cap rate 6.2% vs local median 5.1% in Kenton — meaningfully above typical; check what's discounted (condition, days-on-market, listing class) to confirm the premium yield is real.
Location & tenants
- Location reads 73/100 on livability (#339 in OH) — a middle-class / working-renter tenant base. Strengths: cost of living A+, housing A+, health & safety A+; Watch: schools C-, amenities F, commute F.
- Kenton City (town): math 46% / reading 50% proficiency, ranked #479 of 656 in OH (top 73%) — families likely to look elsewhere, expect single-tenant / working-renter base with shorter leases.
- Market conditions: 53 active listings in the ZIP; 18 units permitted in Hardin County in 2024 (0 in 5+ unit buildings).
Forward outlook
- Local home prices are declining (-3.0%/yr); year-one equity from $864 of loan paydown is wiped out by about $4k of value loss. Plan a longer hold.
- Hardin County population projected at -18% by 2050 — secular population decline; favor cash flow + early exit over multi-decade hold.
Negotiation context
- It's been on market 28 days — a 2% lower offer ($123k) is reasonable based on typical stale-listing flexibility.
- Current owner paid $55k; list at $125k implies a 127% gain — meaningful room to come down on a strong offer.
Risks & watch-outs
- Watch-outs: built in 1940 — expect roof / HVAC / electrical / plumbing capex.
Questions for the listing agent
- What do current leases actually rent for vs. the listed asking? Can we see a recent rent roll and the last 12 months of T-12 income?
- Built in 1940 — when were the roof, HVAC, electrical panel, plumbing, and water heater last replaced?
- Is there a deadline driving the sale (1031 exchange, divorce, estate, relocation)? That informs how much negotiation room exists.
- The area grade is low — what's the realistic commute time and amenity access for the typical tenant pool here? Any planned neighborhood developments (good or bad) we should know about?
- What's the average days-on-market for RENTAL listings here right now (not sales)? A rising rental-DOM trend means longer vacancies and softer asking-rent achievability than the comps imply.
- What's the recent tenant-quality profile in this submarket — average credit score on applications, eviction rate, late-payment / NSF rate, and stable-employment percentage? A property-management company in the area should have these aggregated.
- How much new for-sale + rental construction is in the pipeline within 1–3 miles? Heavy new supply typically softens prices + rents 12–24 months out; constrained supply supports both.
Investment metrics
- 1% rule
- 0.83% ✗
- Cap rate
- 6.22%
- Cash-on-cash
- -0.28%
- DSCR
- 0.99
- GRM
- 10.1
CMA / ARV
- ARV (median comp)
- $129,538
- List price
- $125,000
- Delta
- -3.50%
- Verdict
- FAIR
- Comps
- 20 within 1.0 mi
Show comp detail 12 sales within ~0.75 mi
| Address | Dist | Beds/Ba | Sqft | Sold | Price | $/sf | Match |
|---|---|---|---|---|---|---|---|
| 501 East St | 0.54mi | 3/1.0 | 1,008 (+1%) | 2mo | $169,000 | $168 | 71 |
| 635 Stevens St | 0.36mi | 3/1.0 | 972 (-2%) | 11mo | $80,000 | $82 | 70 |
| 319 W Lynn St | 0.41mi | 2/1.0 (-1) | 960 (-3%) | 6mo | $115,000 | $120 | 65 |
| 727 S Detroit St | 0.43mi | 3/1.0 | 1,124 (+13%) | 3mo | $125,000 | $111 | 55 |
| 330 Superior St. St | 0.53mi | 3/1.0 | 1,078 (+8%) | 9mo | $150,000 | $139 | 54 |
| 609 W North St | 0.68mi | 2/1.5 (-1) | 960 (-3%) | 4mo | $87,000 | $91 | 52 |
| 920 Cooper St | 0.49mi | 2/1.0 (-1) | 884 (-11%) | 3mo | $124,000 | $140 | 52 |
| 809 King St | 0.38mi | 2/1.0 (-1) | 888 (-11%) | 10mo | $92,000 | $104 | 52 |
| 407 Smith Ave | 0.59mi | 3/1.5 | 1,092 (+10%) | 7mo | $117,500 | $108 | 48 |
| 10 Champion Court Ct | 0.67mi | 2/1.0 (-1) | 1,052 (+6%) | 7mo | $143,000 | $136 | 48 |
| 1 C Court Ct | 0.64mi | 2/1.0 (-1) | 1,127 (+13%) | 6mo | $137,000 | $122 | 38 |
| 336 Letson Ave. Ave | 0.74mi | 2/1.0 (-1) | 884 (-11%) | 7mo | $109,900 | $124 | 36 |
Match score weights: distance 35% · size 25% · config 20% · recency 20%. Top-matched comps best support the ARV.
Projected returns pro-forma
-3.0% appreciation · 3.0% rent growth · sell at horizon
- IRR
- -16.8%
- Equity multiple
- 0.41×
- Total profit
- $-20,781
- Equity at exit
- $18,638
- IRR
- -8.6%
- Equity multiple
- 0.46×
- Total profit
- $-18,799
- Equity at exit
- $10,808
Cash invested: $35,000 (down + closing). Projections, not guarantees.
Landlord ↔ Tenant lean methodology
- Overall (STATE)
- 73 Landlord-Friendly
- State Ohio
- 73 Landlord-Friendly · R+6
- County
- — inherits STATE
- City
- — inherits STATE
ZIP-level market 43326
- Home prices YoY
- -21.0%
- Active inventory
- 53
- Price-to-rent
- 10.1×
Monthly cashflow live
- Estimated rent
- $1,032 medium interval (Pro) →
- Mortgage (P&I)
- −$656
- Tax from tax record
- −$116 /mo · $1,387/yr
- Insurance
- −$52
- HOA
- −$0
- Vacancy / Maint / Mgmt
- −$217
- Net cashflow
- $-8
Break-even live
UW: 25.0% down · 7.5% · 30yr · 1.5% tax · 5.0% vac · 8.0% maint · 8.0% mgmt
Financing live
Cash to close
- Down payment
- $31,250
- Closing costs
- $3,750
- Reserves months
- —
- Total cash needed
- —
Loan-product check · same deal, 3 products live
Conventional
25% down · 7.5% · 30yr
- Down + closing
- —
- Monthly P&I
- —
- Monthly cashflow
- —
- DSCR
- —
- Eligible?
- —
Personal DTI + credit; lowest rate.
DSCR
20% down · 8.5% · 30yr
- Down + closing
- —
- Monthly P&I
- —
- Monthly cashflow
- —
- DSCR
- —
- Eligible?
- —
No personal income docs; deal must DSCR.
Hard money
10% down · 12.0% · 12mo
- Down + closing
- —
- Monthly P&I
- —
- Monthly cashflow
- —
- DSCR
- —
- Eligible?
- —
Short-term bridge; refi at stabilization.
Listing history 12 events
-
2026-06-09status $125,000 Pending 28 DOM
-
2026-06-08days on market $125,000 Active Under Contract 28 DOM
-
2026-06-08days on market $125,000 Active Under Contract 27 DOM
-
2026-06-07days on market $125,000 Active Under Contract 26 DOM
-
2026-06-04days on market $125,000 Active Under Contract 23 DOM
-
2026-06-02days on market $125,000 Active Under Contract 22 DOM
-
2026-06-01days on market $125,000 Active Under Contract 21 DOM
-
2026-05-31days on market $125,000 Active Under Contract 20 DOM
-
2026-05-18historical Active Under Contract 828-char remark
-
2026-05-11$125,000 Active 828-char remark
-
2016-04-20soldstatus $55,000
-
1997-04-25soldstatus $48,500
ⓘ Source: listings_history table (triggers on properties + properties_extension) + one-shot
backfill from property_details.listing_events for pre-trigger history.
Tax reassessment forecast OH · Partial reset (capped growth)
- Current annual tax
- $1,387 · $116/mo
- Projected year-2 tax
- $1,669 · $139/mo
- Expected delta
- +$281/yr (+$23/mo · 20.3%)
ⓘ Screening estimate from a state-policy table — verify with the county assessor before closing.
Climate risk First Street
- Flood 1/10 Low FEMA zone X · 0% chance over 30 yrs
- Wildfire 2/10 Low
- Heat 3/10 Moderate 7 d/yr ≥99°F today · 18 d/yr by 30 yrs out
- Wind 2/10 Low
- Air quality 2/10 Low 1 unhealthy d/yr today · 3 by 30 yrs out
Nearby sold comps map
Loading sold comps map…
Walkable amenities ~0.75 mi
Loading nearby amenities…
Taxation est. · year 1
- Rental income
- $12,381
- − Mortgage interest
- −$7,002
- − Property taxes
- −$1,387
- − Insurance
- −$625
- − Repairs & maintenance
- −$990
- − Management
- −$990
- − Depreciation
- −$3,636
- Taxable loss
- −$2,250
- Est. tax savings @ 24.0%
- +$540
- After-tax cash flow
- $443/yr
For passive investors: Depreciation is non-cash, so a rental often shows a tax loss while cash-flowing — sheltering income. Rental losses are passive: they offset passive income freely, and up to $25,000/yr can offset ordinary (W-2) income if you actively participate and your MAGI is under $100k (phasing out to $0 by $150k); unused losses carry forward. On sale, claimed depreciation is recaptured at up to 25%, and gains may owe capital-gains tax (a 1031 exchange can defer both). Figures are a year-1 estimate at your 24.0% rate — not tax advice; consult a CPA.
Schools (NCES district)
- District
- Kenton City
- NCES district ID
- 3910025
- Math proficiency
- 46% ▼ -17.00%
- Reading proficiency
- 50% ▼ -9.00%
- Median HH income
- $40,297
- Composite
- 40.19/100
- National rank
- #3786
- State rank
- #479 of 656 in OH
Livability — Kenton
- Score
- 73/100
- State rank
- #339
- US rank
- #5545
Category grades
Schools grade is shown separately in the Schools card above.
Census & demographics
- Census place
- Kenton, OH
- County
- Hardin · 33,287 people
- City population
- 12,594
- Population (ZIP)
- 12,594
- Household income
- $54,325
- Rent vs Own
- Severe rent burden
- 4.8
Population outlook (Hardin County) Hauer SSP2
- Today (2025)
- 31,000 people
- By 2030
- 30,031 · -3.1%
- By 2040
- 27,500 · -11.3%
- By 2050
- 25,265 · -18.5%
- By 2075
- 20,485 · -33.9%
- By 2100
- 16,031 · -48.3%
Race, ethnicity, and origin ACS 2023
- Neighborhood character
- Predominantly White (95%)
- Race & ethnicity
- White 95% Two or more races 3%
- Common ancestry
- Iranian 3% Serbian 1% Italian 1%
- Foreign-born
- 0%
- Languages at home
- 96% English-only · German/W. Germanic 2% Spanish 1%
Political lean MEDSL · Hardin
- 2024 margin
- Solid R (+54.7) · D 22.2% · R 76.9%
- 2008→2024 swing
- -33.8pp toward R · 2008: -20.9pp · 2024: -54.7pp
- All cycles
- 2024: R+54.7 2020: R+52.0 2016: R+47.2 2012: R+23.5 2008: R+20.9
Not yet ingested
- Civics
- —
Market trends
- HPI YoY
- ▼ -56.32%
- Current HPI
- 211.5705
- Rent YoY
- —
- Metro
- —
- State GDP YoY
- ▲ 1.98%
- F500 in state
- 48
Industry mix (Fortune 500 HQ in OH)
| Industry | F500 HQs | Revenue |
|---|---|---|
| Insurance | 3 | $145B |
|
||
| Industrial Machinery | 3 | $49B |
|
||
| Financial Services | 3 | $24B |
|
||
| Consumer Goods | 2 | $93B |
|
||
| Aerospace / Defense | 2 | $47B |
|
||
| Utilities | 2 | $33B |
|
||
Price history
+157.7% since first listed5 events — show timeline
- 2026-06-08 Pending — WCARE
- 2026-05-18 Contingent — WCARE
- 2026-05-11 Listed $125,000 WCARE
- 2016-04-20 Sold (Public Records) $55,000 Public Records
- 1997-04-25 Sold (Public Records) $48,500 Public Records
Property tax history
+4.7%/yrLatest (2025): $1,387 · -0.6% YoY. Source: county tax records.
Cash-flow waterfall
monthlySold comps — $/sqft
last 12 mo · ≤1 miLoading sold comps…