39 Blueberry Rd · Liverpool, NY
Flood risk 1/10 · Minimal
- FEMA flood zone
- X (unshaded)
- Chance of flooding over 30 yrs
- 0.0%
- Est. flood insurance / yr
- $473 – $860
Fire risk 2/10 · Minimal
- Est. fire insurance / yr
- $691 – $1,283
Heat risk 3/10 · Minor
- Hot days now (above 95°F)
- 7 days/yr
- Hot days in 30 yrs
- 16 days/yr
Wind risk 1/10 · Minimal
- Chance of severe wind over 30 yrs
- 0.0%
Air-quality risk 2/10 · Minimal
- Unhealthy air days now
- 0 days/yr
- Unhealthy air days in 30 yrs
- 1 days/yr
Risk factors via First Street. Map © Google.
Why this score? — see what drove the C- grade
The composite is a weighted blend of 9 inputs, each scored 0–100. Each bar is that input's sub-score; the figure is the points it added to the 100-point composite (weight × sub-score).
- ARV discount +14.7/15.0
- Cash flow +13.3/30.0
- 1% rule +5.1/10.0
- Schools +4.3/10.0
- Livability +4.3/5.0
- DSCR +4.0/10.0
- Rent growth +2.5/5.0
- Condition / age +2.5/5.0
- Appreciation +0.0/10.0
$199,000
🖨 Deal sheet (PDF) 📄 Offer letter ✓ Due diligence
Listing remarks
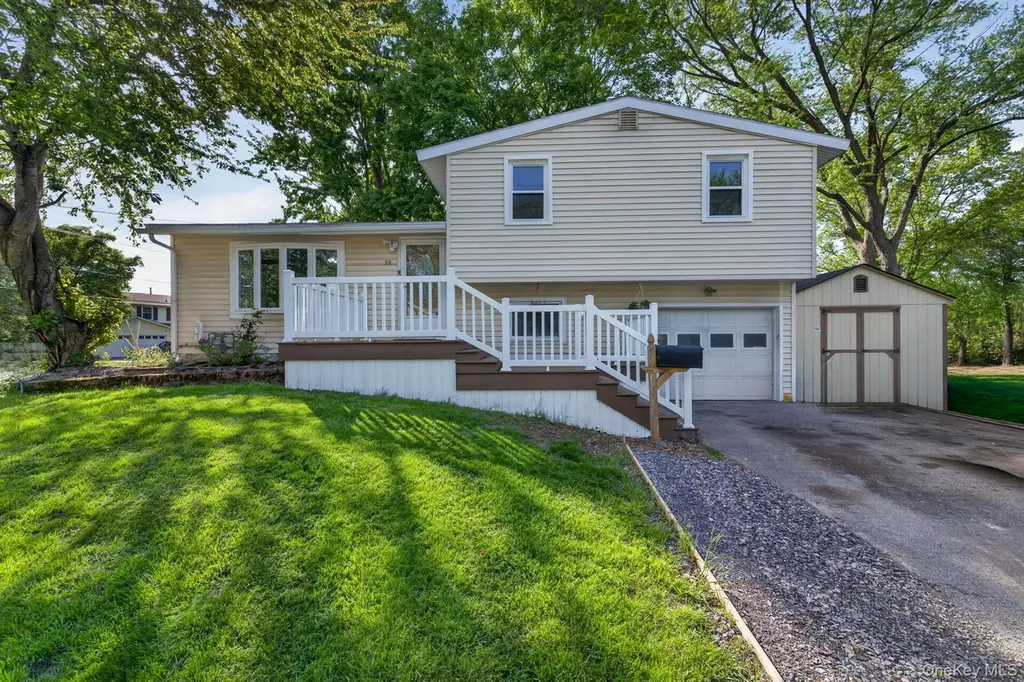
Welcome to this spacious split-level home offering a flexible layout, generous living space, and great indoor-outdoor flow. The main level features a bright living room with hardwood floors, a large front-facing window, and an easy transition into the formal dining room and updated kitchen. The kitchen offers gray shaker-style cabinetry, stone countertops, stainless steel appliances, subway tile backsplash, recessed lighting, and ample storage. Just off the dining area, the sun-filled rear sunroom is surrounded by large windows and provides the perfect space to relax, enjoy morning coffee, or overlook the yard. The upper level includes three bedrooms with hardwood floors, natural light, and
Key facts
- Stone countertops
- Split-level home
- Hardwood floors
Tags
Property features AI
Exterior
- Parking: Driveway parking; 6 total parking spaces; 1-car garage
- Utilities: Public sewer; No additional utilities listed
- Home design: Single family residence; Multi/split levels; Entry includes porch
- Construction: Vinyl siding; Crawl space / crawl attic
- Exterior features: Rain gutters; Shed(s); Back yard; Front yard; Corner lot; Near school
Interior
- Kitchen: Electric range; Microwave; Dishwasher; Disposal; Refrigerator; Stainless steel appliances
- Bedrooms: Bedrooms located on multiple/split levels
- Flooring: Hardwood flooring; Vinyl flooring
- Bathrooms: 1 full bathroom; 1 half bathroom
- Heating & cooling: Forced air heating; Central air conditioning
- Interior features: Formal dining area; Recessed lighting; Interior storage; Bay window(s); Deck and porch
- Laundry & utility: Washer hookup; Washer/dryer connections in basement; Gas water heater
Neighborhood map
What this means for you Summary
Snapshot
- This is a 3-bed/1.5-bath single-family listed at $199k.
Deal economics
- At list price, monthly cash flow is $-1 ($-8/yr) — negative.
- To cash-flow at today's rent, offer at most $199k (0.1% below list).
- Meets the 1% rule at list price ($2k rent vs $199k).
- Recommended offer: $199k (0.1% below list) — sets the bar for cash-flow.
- Cap rate 6.3% vs local median 5.0% in Liverpool — meaningfully above typical; check what's discounted (condition, days-on-market, listing class) to confirm the premium yield is real.
Location & tenants
- Location reads 86/100 on livability (#16 in NY, #363 nationally) — a professional / high-income tenant draw. Strengths: commute A+, housing A+, health & safety A+.
- Liverpool Central School District (suburban): math 49% / reading 49% proficiency, ranked #381 of 590 in NY (top 65%) — families likely to look elsewhere, expect single-tenant / working-renter base with shorter leases.
- Zoned schools: Morgan Road Elementary School (math 54% / reading 60%, grade C+, #842 of 2,108 statewide, top 43%, 433 students, 47% FRL); Liverpool Middle School (math 47% / reading 62%, grade B-, #214 of 729 statewide, top 31%, 313 students, 51% FRL); Liverpool High School (math 94% / reading 54%, grade B+, #658 of 1,100 statewide, top 60%, 2,124 students, 42% FRL) — zoned schools average 47% FRL vs 28% district-wide (19 pts higher); higher-poverty schools than district average — tighter screening recommended.
- Zoned-school proficiency averages 62% at this address vs 49% district-wide (+13 pts) — the actual schools serving this property are materially stronger than the Liverpool Central School District average implies; a family-tenant draw the district grade alone would hide.
- Market conditions: 94 active listings in the ZIP; 3 comparable units currently listed for rent nearby; rentals lingering (median 46d on market — plan ~5-8 weeks vacancy on turnover, expect pricing pressure); 67% of comp listings sitting > 30 days — soft ceiling on asking rent; solid renter incomes; 616 units permitted in Onondaga County in 2024 (256 in 5+ unit buildings).
Forward outlook
- Local home prices are declining (-3.0%/yr); year-one equity from $1k of loan paydown is wiped out by about $6k of value loss. Plan a longer hold.
- Onondaga County population projected to shrink 9% by 2050 — rents likely to lag national; underwrite the cash flow, not the appreciation.
Negotiation context
- Only 9 days on market — expect competitive offers; lowballing is unlikely to land.
- Current owner paid $67k; list at $199k implies a 197% gain — meaningful room to come down on a strong offer.
Risks & watch-outs
- Watch-outs: property tax is 2.8% of price.
Questions for the listing agent
- What do current leases actually rent for vs. the listed asking? Can we see a recent rent roll and the last 12 months of T-12 income?
- Built in 1960 — when were the roof, HVAC, electrical panel, plumbing, and water heater last replaced?
- Property tax is high relative to price — has the assessment been appealed recently, and will the sale trigger a re-assessment?
- Is there a deadline driving the sale (1031 exchange, divorce, estate, relocation)? That informs how much negotiation room exists.
- What's the average days-on-market for RENTAL listings here right now (not sales)? A rising rental-DOM trend means longer vacancies and softer asking-rent achievability than the comps imply.
- What's the recent tenant-quality profile in this submarket — average credit score on applications, eviction rate, late-payment / NSF rate, and stable-employment percentage? A property-management company in the area should have these aggregated.
- How much new for-sale + rental construction is in the pipeline within 1–3 miles? Heavy new supply typically softens prices + rents 12–24 months out; constrained supply supports both.
Investment metrics
- 1% rule
- 1.01% ✓
- Cap rate
- 6.29%
- Cash-on-cash
- -0.01%
- DSCR
- 1.00
- GRM
- 8.2
CMA / ARV
- ARV (on-the-fly)
- $236,928
- Comps found
- 12
Show comp detail 12 sales within ~0.75 mi
| Address | Dist | Beds/Ba | Sqft | Sold | Price | $/sf | Match |
|---|---|---|---|---|---|---|---|
| 2 Ilex Ln | 0.19mi | 3/1.5 | 1,234 (0%) | 7mo | $175,750 | $142 | 85 |
| 13 Ilex Ln | 0.19mi | 4/2.0 (+1) | 1,234 (0%) | 8mo | $210,000 | $170 | 77 |
| 2 Kumquat Ln | 0.06mi | 3/1.5 | 1,188 (-4%) | 20mo | $300,000 | $253 | 74 |
| 10 Mango Ln | 0.09mi | 3/1.5 | 1,332 (+8%) | 18mo | $265,000 | $199 | 67 |
| 6 Quail Path | 0.41mi | 3/1.5 | 1,308 (+6%) | 6mo | $290,000 | $222 | 66 |
| 81 Bayberry Cir | 0.47mi | 3/1.5 | 1,342 (+9%) | 9mo | $255,000 | $190 | 56 |
| 62 Cherry Tree Cir | 0.28mi | 3/2.0 | 1,364 (+10%) | 18mo | $250,000 | $183 | 52 |
| 11 Foxberry Ln | 0.35mi | 3/1.0 | 1,118 (-9%) | 17mo | $214,900 | $192 | 52 |
| 187 Blackberry Rd | 0.74mi | 3/1.5 | 1,234 (0%) | 20mo | $270,000 | $219 | 49 |
| 11 Dove | 0.60mi | 4/1.5 (+1) | 1,330 (+8%) | 11mo | $297,000 | $223 | 44 |
| 4389 Wetzel Rd | 0.69mi | 4/1.5 (+1) | 1,416 (+15%) | 8mo | $257,500 | $182 | 31 |
| 2 Dove | 0.69mi | 4/1.5 (+1) | 1,408 (+14%) | 11mo | $230,000 | $163 | 30 |
Match score weights: distance 35% · size 25% · config 20% · recency 20%. Top-matched comps best support the ARV.
Projected returns pro-forma
-3.0% appreciation · 3.0% rent growth · sell at horizon
- IRR
- -16.2%
- Equity multiple
- 0.42×
- Total profit
- $-32,123
- Equity at exit
- $29,672
- IRR
- -7.8%
- Equity multiple
- 0.51×
- Total profit
- $-27,353
- Equity at exit
- $17,206
Cash invested: $55,720 (down + closing). Projections, not guarantees.
Landlord ↔ Tenant lean methodology
- Overall (STATE)
- 15 Strongly Tenant-Friendly
- State New York
- 15 Strongly Tenant-Friendly · D+10
- County
- — inherits STATE
- City
- — inherits STATE
ZIP-level market 13090
- Active inventory
- 94
- Price-to-rent
- 8.2×
Monthly cashflow live
- Estimated rent
- $2,019 medium interval (Pro) →
- Mortgage (P&I)
- −$1,044
- Tax from tax record
- −$469 /mo · $5,630/yr
- Insurance
- −$83
- HOA
- −$0
- Vacancy / Maint / Mgmt
- −$424
- Net cashflow
- $-1
Break-even live
Sensitivity live
| Price | -10% $112 | -5% $56 | +0% $-1 | +5% $-57 | +10% $-113 |
|---|---|---|---|---|---|
| Rent | -10% $-160 | -5% $-80 | +0% $-1 | +5% $79 | +10% $159 |
| Rate | -1.0pp $100 | -0.5pp $50 | base $-1 | +0.5pp $-52 | +1.0pp $-105 |
UW: 25.0% down · 7.5% · 30yr · 1.5% tax · 5.0% vac · 8.0% maint · 8.0% mgmt
Financing live
Cash to close
- Down payment
- $49,750
- Closing costs
- $5,970
- Reserves months
- —
- Total cash needed
- —
Loan-product check · same deal, 3 products live
Conventional
25% down · 7.5% · 30yr
- Down + closing
- —
- Monthly P&I
- —
- Monthly cashflow
- —
- DSCR
- —
- Eligible?
- —
Personal DTI + credit; lowest rate.
DSCR
20% down · 8.5% · 30yr
- Down + closing
- —
- Monthly P&I
- —
- Monthly cashflow
- —
- DSCR
- —
- Eligible?
- —
No personal income docs; deal must DSCR.
Hard money
10% down · 12.0% · 12mo
- Down + closing
- —
- Monthly P&I
- —
- Monthly cashflow
- —
- DSCR
- —
- Eligible?
- —
Short-term bridge; refi at stabilization.
Rent comps 3 comps
| Address | Beds | Baths | Sqft | Rent | $/sqft | DOM | Units | Dist |
|---|---|---|---|---|---|---|---|---|
| 4314 Wetzel Rd Liverpool, NY | 2.0 | 1.0 | 900 | $1,200 | $1.33 | 45d | 1 | 0.66mi |
| 66 Grampian Rd Liverpool, NY | 1.0–2.0 | 1.0 | 840 | $1,300 | $1.55 | 45d | 1 | 0.77mi |
| 7648 Autumnal Ln Liverpool, NY | 3.0 | 1.5 | 1100 | $2,500 | $2.27 | 15d | 1 | 1.22mi |
Listing history 7 events
-
2026-06-13statusdays on market $199,000 Pending 9 DOM
-
2026-06-10days on market $199,000 Active 8 DOM
-
2026-06-09days on market $199,000 Active 7 DOM
-
2026-06-08days on market $199,000 Active 6 DOM
-
2026-06-07days on market $199,000 Active 5 DOM
-
2026-06-03remarks 699-char remark
-
2026-06-03$199,000 Active 1 DOM
ⓘ Source: listings_history table (triggers on properties + properties_extension) + one-shot
backfill from property_details.listing_events for pre-trigger history.
Tax reassessment forecast NY · Partial reset (capped growth)
- Current annual tax
- $5,630 · $469/mo
- Projected year-2 tax
- $5,630 · $469/mo
- Expected delta
- $0/yr ($0/mo · 0.0%)
ⓘ Screening estimate from a state-policy table — verify with the county assessor before closing.
Climate risk First Street
- Flood 1/10 Low FEMA zone X (unshaded) · 0% chance over 30 yrs
- Wildfire 2/10 Low
- Heat 3/10 Moderate 7 d/yr ≥95°F today · 16 d/yr by 30 yrs out
- Wind 1/10 Low 0% chance of damaging wind over 30 yrs
- Air quality 2/10 Low 0 unhealthy d/yr today · 1 by 30 yrs out
Nearby sold comps map
Loading sold comps map…
Walkable amenities ~0.75 mi
Loading nearby amenities…
Taxation est. · year 1
- Rental income
- $24,228
- − Mortgage interest
- −$11,147
- − Property taxes
- −$5,630
- − Insurance
- −$995
- − Repairs & maintenance
- −$1,938
- − Management
- −$1,938
- − Depreciation
- −$5,789
- Taxable loss
- −$3,210
- Est. tax savings @ 24.0%
- +$770
- After-tax cash flow
- $762/yr
For passive investors: Depreciation is non-cash, so a rental often shows a tax loss while cash-flowing — sheltering income. Rental losses are passive: they offset passive income freely, and up to $25,000/yr can offset ordinary (W-2) income if you actively participate and your MAGI is under $100k (phasing out to $0 by $150k); unused losses carry forward. On sale, claimed depreciation is recaptured at up to 25%, and gains may owe capital-gains tax (a 1031 exchange can defer both). Figures are a year-1 estimate at your 24.0% rate — not tax advice; consult a CPA.
Schools (NCES district)
- District
- Liverpool Central School District
- NCES district ID
- 3617520
- Math proficiency
- 49% ▼ -6.00%
- Reading proficiency
- 49% ▲ 1.00%
- Median HH income
- $59,134
- Composite
- 42.84/100
- National rank
- #3134
- State rank
- #381 of 590 in NY
Livability — Liverpool
- Score
- 86/100
- State rank
- #16
- US rank
- #363
Category grades
Schools grade is shown separately in the Schools card above.
Census & demographics
- County
- Onondaga County · 247,257 people
- City population
- 29,004
- Metro
- Syracuse, NY
- Population (ZIP)
- 29,004
- Household income
- $88,492
- Rent vs Own
- Severe rent burden
- 733.0
Population outlook (Onondaga County) Hauer SSP2
- Today (2025)
- 467,894 people
- By 2030
- 463,381 · -1.0%
- By 2040
- 447,697 · -4.3%
- By 2050
- 426,399 · -8.9%
- By 2075
- 373,661 · -20.1%
- By 2100
- 307,967 · -34.2%
Race, ethnicity, and origin ACS 2023
- Neighborhood character
- Predominantly White (79%)
- Race & ethnicity
- White 79% Two or more races 9% Hispanic / Latino 7% Black 6% Asian 3%
- Hispanic origin (detail)
- Mexican 1% Puerto Rican 4%
- Common ancestry
- Romanian 7% Lithuanian 4% Italian 2%
- Foreign-born
- 6% · Canada, China, South Korea
- Languages at home
- 93% English-only · Other Indo-European 2% Spanish 1% Russian/Polish/Slavic 1%
Political lean MEDSL · Onondaga
- 2024 margin
- D (+17.3) · D 58.6% · R 41.4%
- 2008→2024 swing
- -3.0pp toward R · 2008: 20.3pp · 2024: 17.3pp
- All cycles
- 2024: D+17.3 2020: D+20.6 2016: D+12.8 2012: D+21.1 2008: D+20.3
Not yet ingested
- Civics
- —
Market trends
- HPI YoY
- ▼ -228.53%
- Current HPI
- 320.4989
- Rent YoY
- —
- Metro
- Syracuse, NY
- State GDP YoY
- ▲ 2.60%
- F500 in state
- 92
Industry mix (Fortune 500 HQ in NY)
| Industry | F500 HQs | Revenue |
|---|---|---|
| Financial Services | 10 | $950B |
|
||
| Consumer Goods | 9 | $162B |
|
||
| Insurance | 4 | $225B |
|
||
| Telecommunications | 2 | $144B |
|
||
| Pharmaceuticals | 2 | $112B |
|
||
| Media / Entertainment | 2 | $69B |
|
||
Price history
+197.0% since first listed2 events — show timeline
- 2026-05-11 Listed $199,000 OneKey® MLS as Distributed by MLS Grid
- 1994-05-24 Sold (Public Records) $67,000 Public Records
Property tax history
+4.1%/yrLatest (2025): $5,630 · +12.3% YoY. Source: county tax records.
Cash-flow waterfall
monthlySold comps — $/sqft
last 12 mo · ≤1 miLoading sold comps…