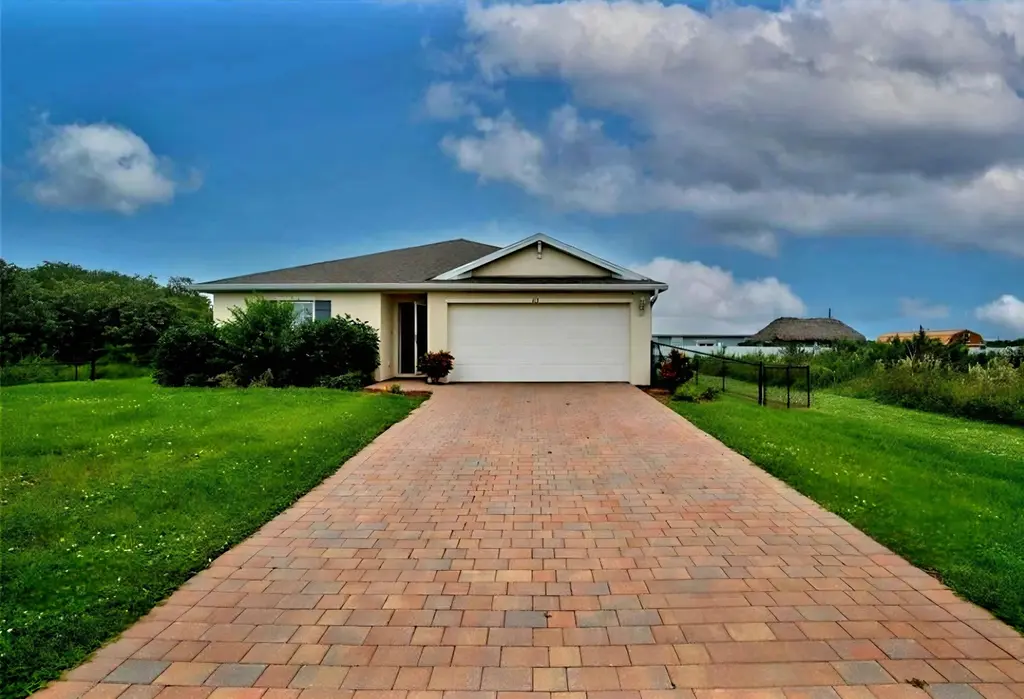
113 Plantation Dr · Pioneer, FL
Flood risk 5/10 · Moderate
- FEMA flood zone
- X (unshaded)
- Chance of flooding over 30 yrs
- 0.54%
- Est. flood insurance / yr
- $507 – $1,088
Fire risk 5/10 · Moderate
- Est. fire insurance / yr
- $947 – $1,759
Heat risk 9/10 · Severe
- Hot days now (above 108°F)
- 7 days/yr
- Hot days in 30 yrs
- 25 days/yr
Wind risk 10/10 · Severe
- Chance of severe wind over 30 yrs
- 99.0%
Air-quality risk 2/10 · Minimal
- Unhealthy air days now
- 1 days/yr
- Unhealthy air days in 30 yrs
- 1 days/yr
Risk factors via First Street. Map © Google.
Why this score? — see what drove the D+ grade
The composite is a weighted blend of 9 inputs, each scored 0–100. Each bar is that input's sub-score; the figure is the points it added to the 100-point composite (weight × sub-score).
- Cash flow +10.2/30.0
- Appreciation +10.0/10.0
- ARV discount +8.1/15.0
- Livability +3.2/5.0
- Schools +3.1/10.0
- 1% rule +2.9/10.0
- DSCR +2.9/10.0
- Rent growth +2.5/5.0
- Condition / age +2.5/5.0
$289,900
🖨 Deal sheet 📄 Offer letter ✓ Due diligence
Listing remarks MLS
Welcome to 113 Plantation Dr, Labelle, FL 33935! This beautiful, newer-built home (2022) offers the perfect blend of modern style and convenience. Step inside to an inviting open floor plan, ideal for entertaining and everyday living. The kitchen is a true highlight, featuring sleek quartz countertops and plenty of space for meal prep and gatherings. Enjoy privacy with a split bedroom floor plan, offering a peaceful retreat in the master suite. Outside, the property is fully enclosed with a chain-link fence, providing security for your pets. The home also comes equipped with an ADT system for even more security. With ample space for RV and boat parking, you'll have room for all your outdoor toys. Best of all, there’s no HOA—giving you freedom to live as you please! This home combines modern living with outdoor flexibility. Don’t miss out on this Labelle gem!
Key facts
- Paver block driveway
- Storm-rated windows
- Adt security system
Tags
Property features AI
Finance
- Other: Pets allowed with no restrictions
Exterior
- Parking: 6 total parking spaces (4 open spaces, 2 covered); Attached 2-car garage; Driveway; Paver block driveway
- Utilities: Public water; Public sewer; Electricity connected (150 amp service)
- Home design: Single-family residence; One story; Resale property; Faces west; City street frontage
- Construction: Built with CBS construction; Metal roof; Slab foundation; 1,485 total living area (builder source)
- Exterior features: Backyard fencing; Paved road frontage; Not waterfront
Interior
- Kitchen: Dishwasher; Electric range; Microwave; Refrigerator; Freezer
- Bedrooms: 4 bedrooms on the main level
- Flooring: Carpet; Tile
- Bathrooms: 2 full bathrooms on the main level
- Heating & cooling: Central heating; Central air conditioning
- Interior features: Split bedroom layout; ENERGY STAR qualified windows
- Laundry & utility: Laundry closet; 220V outlet in laundry
Neighborhood map
What this means for you Summary
Snapshot
- This is a 3-bed/2.0-bath single-family listed at $290k.
Deal economics
- At list price, monthly cash flow is $-166 ($-2k/yr) — negative.
- To cash-flow at today's rent, offer at most $261k (10.1% below list).
- To meet the 1% rule (rent ≥ 1% of price), the offer needs to be $229k (21.0% below list).
- Recommended offer: $229k (21.0% below list) — sets the bar for 1% rule.
Location & tenants
- Location reads 63/100 on livability (#727 in FL) — a middle-class / working-renter tenant base. Strengths: schools A+, cost of living A+, health & safety A+; Watch: amenities F, commute F, employment F.
- Hendry (town): math 35% / reading 40% proficiency, ranked #65 of 73 in FL (top 89%) — families likely to look elsewhere, expect single-tenant / working-renter base with shorter leases; 75% free/reduced lunch — lower-income household profile, screen leases tightly.
- Market conditions: 942 active listings in the ZIP; 3 comparable units currently listed for rent nearby; rentals at typical pace (median 24d on market — plan ~3-4 weeks tenant-placement turnaround); 557 units permitted in Hendry County in 2024 (45 in 5+ unit buildings).
- At $2,291/mo this rent would consume 48% of the median local household income ($57k/yr) (locally 498% of renters already pay >50% of income on rent) — very limited rent-growth headroom before tenants either downsize or default.
Forward outlook
- In year one you build about $31k of equity ($2k loan paydown + $29k appreciation (10.0% local appreciation)).
- Hendry County population projected to shrink 7% by 2050 — rents likely to lag national; underwrite the cash flow, not the appreciation.
- By year 2, paydown + projected appreciation supports a ~$50k cash-out refi (75% LTV) — recoverable capital for the next deal without selling this one.
Negotiation context
- Only 6 days on market — expect competitive offers; lowballing is unlikely to land.
- 2 sale attempts since 2y ago with the ask held roughly flat each time — persistent listings suggest the price (not the market) is what's stuck; bring a comps-based counter.
Risks & watch-outs
- Climate carrying-cost: moderate flood risk; severe wind risk, 99% chance of damaging wind over 30y; moderate wildfire risk; extreme-heat days projected 7→25/yr by 2055 (HVAC capex compounding) — expect insurance premiums to compound above CPI over the hold.
Questions for the listing agent
- What do current leases actually rent for vs. the listed asking? Can we see a recent rent roll and the last 12 months of T-12 income?
- Is there a deadline driving the sale (1031 exchange, divorce, estate, relocation)? That informs how much negotiation room exists.
- Schools are A-rated — typically a magnet for longer-tenancy family renters. What's the average tenant stay here, and is there a school-zone premium baked into asking?
- The area grade is low — what's the realistic commute time and amenity access for the typical tenant pool here? Any planned neighborhood developments (good or bad) we should know about?
- What's the average days-on-market for RENTAL listings here right now (not sales)? A rising rental-DOM trend means longer vacancies and softer asking-rent achievability than the comps imply.
- What's the recent tenant-quality profile in this submarket — average credit score on applications, eviction rate, late-payment / NSF rate, and stable-employment percentage? A property-management company in the area should have these aggregated.
- How much new for-sale + rental construction is in the pipeline within 1–3 miles? Heavy new supply typically softens prices + rents 12–24 months out; constrained supply supports both.
Investment metrics
- 1% rule
- 0.79% ✗
- Cap rate
- 5.61%
- Cash-on-cash
- -2.45%
- DSCR
- 0.89
- GRM
- 10.5
CMA / ARV
- ARV (on-the-fly)
- $294,030
- Comps found
- 12
Show comp detail 12 sales within ~0.75 mi
| Address | Dist | Beds/Ba | Sqft | Sold | Price | $/sf | Match |
|---|---|---|---|---|---|---|---|
| 202 Jubilee Ter | 0.14mi | 3/2.0 | 1,418 (-4%) | 9mo | $310,000 | $219 | 79 |
| 324 Kansas Ter | 0.34mi | 3/2.0 | 1,536 (+3%) | 2mo | $284,900 | $185 | 77 |
| 136 Harley Ter | 0.17mi | 3/2.0 | 1,386 (-7%) | 14mo | $238,000 | $172 | 69 |
| 124 Bethlehem Pl | 0.32mi | 3/2.0 | 1,536 (+3%) | 13mo | $302,900 | $197 | 68 |
| 526 Braelyn St | 0.27mi | 3/2.0 | 1,662 (+12%) | 0mo | $327,000 | $197 | 67 |
| 1207 Andover Dr | 0.55mi | 3/2.0 | 1,662 (+12%) | 1mo | $327,500 | $197 | 54 |
| 1004 Silverfish Dr | 0.67mi | 3/2.0 | 1,536 (+3%) | 14mo | $302,900 | $197 | 52 |
| 1215 Andover Dr | 0.56mi | 3/2.0 | 1,662 (+12%) | 7mo | $329,000 | $198 | 48 |
| 637 Royce Rd | 0.59mi | 3/2.0 | 1,662 (+12%) | 6mo | $329,000 | $198 | 48 |
| 605 Marcella Ave | 0.64mi | 4/2.0 (+1) | 1,662 (+12%) | 4mo | $330,000 | $199 | 42 |
| 1213 Andover Dr | 0.56mi | 4/2.0 (+1) | 1,662 (+12%) | 10mo | $330,000 | $199 | 41 |
| 626 Royce Rd | 0.66mi | 4/2.0 (+1) | 1,662 (+12%) | 7mo | $330,000 | $199 | 39 |
Match score weights: distance 35% · size 25% · config 20% · recency 20%. Top-matched comps best support the ARV.
Projected returns pro-forma
10.0% appreciation · 3.0% rent growth · sell at horizon
- IRR
- 22.5%
- Equity multiple
- 2.82×
- Total profit
- $147,358
- Equity at exit
- $261,165
- IRR
- 20.2%
- Equity multiple
- 6.45×
- Total profit
- $442,273
- Equity at exit
- $563,212
Cash invested: $81,172 (down + closing). Projections, not guarantees.
Landlord ↔ Tenant lean methodology
- Overall (STATE)
- 87 Strongly Landlord-Friendly
- State Florida
- 87 Strongly Landlord-Friendly · R+3
- County
- — inherits STATE
- City
- — inherits STATE
ZIP-level market 33935
- Home prices YoY
- 16.3%
- Active inventory
- 942
- Price-to-rent
- 10.5×
Monthly cashflow live
- Estimated rent
- $2,291 medium interval (Pro) →
- Mortgage (P&I)
- −$1,520
- Tax from tax record
- −$334 /mo · $4,014/yr
- Insurance
- −$121
- HOA
- −$0
- Vacancy / Maint / Mgmt
- −$481
- Net cashflow
- $-166
Break-even live
UW: 25.0% down · 7.5% · 30yr · 1.5% tax · 5.0% vac · 8.0% maint · 8.0% mgmt
Financing live
Cash to close
- Down payment
- $72,475
- Closing costs
- $8,697
- Reserves months
- —
- Total cash needed
- —
Loan-product check · same deal, 3 products live
Conventional
25% down · 7.5% · 30yr
- Down + closing
- —
- Monthly P&I
- —
- Monthly cashflow
- —
- DSCR
- —
- Eligible?
- —
Personal DTI + credit; lowest rate.
DSCR
20% down · 8.5% · 30yr
- Down + closing
- —
- Monthly P&I
- —
- Monthly cashflow
- —
- DSCR
- —
- Eligible?
- —
No personal income docs; deal must DSCR.
Hard money
10% down · 12.0% · 12mo
- Down + closing
- —
- Monthly P&I
- —
- Monthly cashflow
- —
- DSCR
- —
- Eligible?
- —
Short-term bridge; refi at stabilization.
Rent comps 3 comps
| Address | Beds | Baths | Sqft | Rent | $/sqft | DOM | Units | Dist |
|---|---|---|---|---|---|---|---|---|
| 513 Ella Jean Pl Labelle, FL | 4.0 | 2.0 | 1485 | $2,000 | $1.35 | 23d | 1 | 0.56mi |
| 1305 Andover Dr Labelle, FL | 3.0 | 2.0 | 1750 | $2,400 | $1.37 | 23d | 1 | 0.63mi |
| 634 Royce Rd Labelle, FL | 3.0 | 2.0 | 1462 | $2,100 | $1.44 | 14d | 1 | 0.63mi |
Listing history 6 events
-
2026-06-18days on market $289,900 Active 6 DOM
-
2026-06-17days on market $289,900 Active 5 DOM
-
2026-06-16days on market $289,900 Active 4 DOM
-
2026-06-15days on market $289,900 Active 3 DOM
-
2026-06-13remarks 699-char remark
-
2026-06-13$289,900 Active 1 DOM
ⓘ Source: listings_history table (triggers on properties + properties_extension) + one-shot
backfill from property_details.listing_events for pre-trigger history.
Tax reassessment forecast FL · Resets to sale price
- Current annual tax
- $4,014 · $334/mo
- Projected year-2 tax
- $4,014 · $334/mo
- Expected delta
- $0/yr ($0/mo · 0.0%)
ⓘ Screening estimate from a state-policy table — verify with the county assessor before closing.
Climate risk First Street
- Flood 5/10 Major FEMA zone X (unshaded) · 54% chance over 30 yrs
- Wildfire 5/10 Major
- Heat 9/10 Extreme 7 d/yr ≥108°F today · 25 d/yr by 30 yrs out
- Wind 10/10 Extreme 99% chance of damaging wind over 30 yrs
- Air quality 2/10 Low 1 unhealthy d/yr today · 1 by 30 yrs out
Nearby sold comps map
Loading sold comps map…
Walkable amenities ~0.75 mi
Loading nearby amenities…
Taxation est. · year 1
- Rental income
- $27,493
- − Mortgage interest
- −$16,239
- − Property taxes
- −$4,014
- − Insurance
- −$1,450
- − Repairs & maintenance
- −$2,199
- − Management
- −$2,199
- − Depreciation
- −$8,433
- Taxable loss
- −$7,042
- Est. tax savings @ 24.0%
- +$1,690
- After-tax cash flow
- $-297/yr
For passive investors: Depreciation is non-cash, so a rental often shows a tax loss while cash-flowing — sheltering income. Rental losses are passive: they offset passive income freely, and up to $25,000/yr can offset ordinary (W-2) income if you actively participate and your MAGI is under $100k (phasing out to $0 by $150k); unused losses carry forward. On sale, claimed depreciation is recaptured at up to 25%, and gains may owe capital-gains tax (a 1031 exchange can defer both). Figures are a year-1 estimate at your 24.0% rate — not tax advice; consult a CPA.
Schools (NCES district)
- District
- Hendry
- NCES district ID
- 1200780
- Math proficiency
- 35% ▼ -11.00%
- Reading proficiency
- 40% ▼ -4.00%
- Median HH income
- $37,043
- Composite
- 31.16/100
- National rank
- #6054
- State rank
- #65 of 73 in FL
Livability — Pioneer
- Score
- 63/100
- State rank
- #727
- US rank
- #15534
Category grades
Schools grade is shown separately in the Schools card above.
Census & demographics
- County
- Hendry County · 23,186 people
- Metro
- Clewiston, FL
- Population (ZIP)
- 23,186
- Household income
- $57,009
- Rent vs Own
- Severe rent burden
- 498.0
Population outlook (Hendry County) Hauer SSP2
- Today (2025)
- 38,866 people
- By 2030
- 38,558 · -0.8%
- By 2040
- 37,743 · -2.9%
- By 2050
- 36,117 · -7.1%
- By 2075
- 30,070 · -22.6%
- By 2100
- 21,966 · -43.5%
Race, ethnicity, and origin ACS 2023
- Neighborhood character
- Majority Hispanic (56%)
- Race & ethnicity
- Hispanic / Latino 56% White 39% Two or more races 21% Black 2% Native American 2%
- Hispanic origin (detail)
- Mexican 40% Puerto Rican 3% Cuban 5%
- Common ancestry
- Lithuanian 2% Serbian 2% Slovak 1%
- Foreign-born
- 27% · Canada, Jamaica
- Languages at home
- 50% English-only · Spanish 50%
Political lean MEDSL · Hendry
- 2024 margin
- Solid R (+38.3) · D 30.4% · R 68.7%
- 2008→2024 swing
- -31.1pp toward R · 2008: -7.2pp · 2024: -38.3pp
- All cycles
- 2024: R+38.3 2020: R+23.0 2016: R+14.2 2012: R+5.9 2008: R+7.2
Not yet ingested
- Civics
- —
Market trends
- HPI YoY
- ▲ 75.20%
- Current HPI
- 537.4928
- Rent YoY
- —
- Metro
- Clewiston, FL
- State GDP YoY
- ▲ 3.28%
- F500 in state
- 36
Industry mix (Fortune 500 HQ in FL)
| Industry | F500 HQs | Revenue |
|---|---|---|
| Industrial Technology | 2 | $29B |
|
||
| Insurance | 2 | $17B |
|
||
| Retail | 1 | $60B |
|
||
| Technology Distribution | 1 | $58B |
|
||
| Homebuilding | 1 | $35B |
|
||
| Technology Manufacturing | 1 | $35B |
|
||
Price history
-47.3% since first listed6 events — show timeline
- 2026-06-12 Listed $289,900 Beaches MLS
- 2024-11-25 Sold (Public Records) $285,000 Public Records
- 2024-11-20 Sold (MLS) $285,000 Stellar MLS as Distributed by MLS Grid
- 2024-10-23 Pending — Stellar MLS as Distributed by MLS Grid
- 2024-10-15 Listed $290,000 Stellar MLS as Distributed by MLS Grid
- 2003-05-30 Sold (Public Records) $550,000 Public Records
Property tax history
+26.6%/yrLatest (2025): $4,014 · +40.3% YoY. Source: county tax records.
Cash-flow waterfall
monthlySold comps — $/sqft
last 12 mo · ≤1 miLoading sold comps…