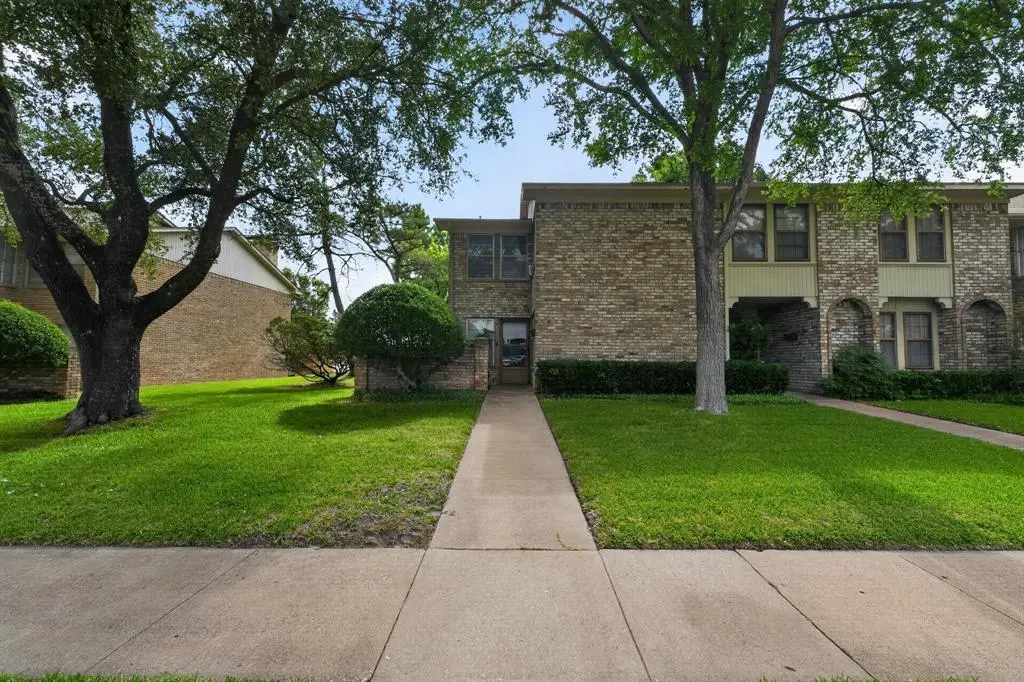
717 Towne House Ln · Richardson, TX
Flood risk 1/10 · Minimal
- FEMA flood zone
- X (unshaded)
- Chance of flooding over 30 yrs
- 0.0%
- Est. flood insurance / yr
- $507 – $1,088
Fire risk 1/10 · Minimal
- Est. fire insurance / yr
- $1,222 – $2,270
Heat risk 7/10 · Major
- Hot days now (above 109°F)
- 7 days/yr
- Hot days in 30 yrs
- 23 days/yr
Wind risk 6/10 · Moderate
- Chance of severe wind over 30 yrs
- 27.0%
Air-quality risk 3/10 · Minor
- Unhealthy air days now
- 3 days/yr
- Unhealthy air days in 30 yrs
- 3 days/yr
Risk factors via First Street. Map © Google.
Why this score? — see what drove the D+ grade
The composite is a weighted blend of 9 inputs, each scored 0–100. Each bar is that input's sub-score; the figure is the points it added to the 100-point composite (weight × sub-score).
- ARV discount +15.0/15.0
- Cash flow +11.9/30.0
- 1% rule +6.4/10.0
- Livability +4.2/5.0
- Schools +3.7/10.0
- DSCR +3.5/10.0
- Rent growth +2.5/5.0
- Condition / age +2.5/5.0
- Appreciation +0.0/10.0
$207,500
🖨 Deal sheet (PDF) 📄 Offer letter ✓ Due diligence
Listing remarks
Welcome to this spacious 3-bedroom, 2-bathroom townhome in the established Woodhaven community of Richardson, Texas. Offering approximately 1,817 square feet of living space across two stories, this home provides a functional layout with generous room sizes and excellent potential for personalization. Located in a convenient North Dallas suburb, the property is just minutes from major highways (I-75, US 75, and George Bush Turnpike), top-rated Richardson schools, shopping, dining, and recreation. Enjoy the low-maintenance lifestyle of a townhome with HOA amenities and easy access to everything the area has to offer. This home is a fantastic opportunity for buyers seeking value and upside. W
Key facts
- Easy access
- Woodhaven community
- North dallas suburb
Tags
Property features AI
Finance
- Other: Possession upon completion
- Financial info: Treat as clear loan type; No second mortgage
- HOA & community: Mandatory association; Association fee $300 monthly; Association fee includes grounds maintenance
Exterior
- Parking: Carport (1 space)
- Security: No accessibility features
- Utilities: Municipal utility district: No; Utilities: Other
- Home design: Residential townhouse; Attached property
- Construction: Built in 1974; Composition/Shingle roof
- Exterior features: Lot less than 0.5 acre; Subdivision: Woodhaven Twnhs Rev
Interior
- Kitchen: No appliances included
- Bedrooms: 3 bedrooms; Primary bedroom on level 2
- Flooring: No flooring details provided
- Bathrooms: 2 full bathrooms; 1 half bathroom
- Heating & cooling: No heating or cooling details provided
- Interior features: Two levels; One living area; One dining area; Living room fireplace; Other interior features
- Laundry & utility: No laundry/utility details provided
Neighborhood map
What this means for you Summary
Snapshot
- This is a 3-bed/2.0-bath townhouse listed at $208k.
Deal economics
- At list price, monthly cash flow is $-53 ($-634/yr) — negative.
- To cash-flow at today's rent, offer at most $198k (4.5% below list).
- Meets the 1% rule at list price ($2k rent vs $208k).
- Recommended offer: $198k (4.5% below list) — sets the bar for cash-flow.
- Cap rate 6.0% vs local median 2.7% in Richardson — top-decile yield for the area; either an underpriced asset or a hidden risk that comps aren't pricing in. Stress-test before assuming the spread holds.
Location & tenants
- Location reads 85/100 on livability (#5 in TX, #551 nationally) — a professional / high-income tenant draw. Strengths: commute A+, employment A+, housing A+; Watch: cost of living D+.
- Richardson ISD (urban): math 40% / reading 44% proficiency, ranked #316 of 826 in TX (top 38%) — families likely to look elsewhere, expect single-tenant / working-renter base with shorter leases.
- Zoned schools: Richardson Terrace El (math 37% / reading 37%, grade F, #1,769 of 4,322 statewide, top 44%, 502 students, 69% FRL); Apollo J H (math 28% / reading 42%, grade F, #842 of 1,662 statewide, top 51%, 639 students, 63% FRL); Berkner H S (math 20% / reading 45%, grade F, #1,029 of 1,632 statewide, top 64%, 2,290 students, 64% FRL).
- Market conditions: Rents flat; 166 active listings in the ZIP; 40 comparable units currently listed for rent nearby; rentals at typical pace (median 21d on market — plan ~3-4 weeks tenant-placement turnaround); solid renter incomes; 12,577 units permitted in Dallas County in 2024 (6,829 in 5+ unit buildings).
- This rent runs 31% of the median local income ($93k/yr) — at the standard rent-burdened threshold; future hikes will face affordability resistance.
Forward outlook
- Local home prices are declining (-3.0%/yr); year-one equity from $1k of loan paydown is wiped out by about $6k of value loss. Plan a longer hold.
- Dallas County population projected at +35% by 2050 — long-run rental-demand tailwind backs the buy-and-hold thesis.
Negotiation context
- Only 4 days on market — expect competitive offers; lowballing is unlikely to land.
Risks & watch-outs
- Watch-outs: property tax is 2.6% of price.
- Climate carrying-cost: major wind risk, 27% chance of damaging wind over 30y; extreme-heat days projected 7→23/yr by 2055 (HVAC capex compounding) — expect insurance premiums to compound above CPI over the hold.
Questions for the listing agent
- What do current leases actually rent for vs. the listed asking? Can we see a recent rent roll and the last 12 months of T-12 income?
- Built in 1974 — when were the roof, HVAC, electrical panel, plumbing, and water heater last replaced?
- Property tax is high relative to price — has the assessment been appealed recently, and will the sale trigger a re-assessment?
- What does the HOA fee cover, when was the last increase, and are there any pending special assessments or reserve-fund shortfalls?
- Is there a deadline driving the sale (1031 exchange, divorce, estate, relocation)? That informs how much negotiation room exists.
- Schools are A-rated — typically a magnet for longer-tenancy family renters. What's the average tenant stay here, and is there a school-zone premium baked into asking?
- The area grade is low — what's the realistic commute time and amenity access for the typical tenant pool here? Any planned neighborhood developments (good or bad) we should know about?
- What's the average days-on-market for RENTAL listings here right now (not sales)? A rising rental-DOM trend means longer vacancies and softer asking-rent achievability than the comps imply.
- What's the recent tenant-quality profile in this submarket — average credit score on applications, eviction rate, late-payment / NSF rate, and stable-employment percentage? A property-management company in the area should have these aggregated.
- How much new for-sale + rental construction is in the pipeline within 1–3 miles? Heavy new supply typically softens prices + rents 12–24 months out; constrained supply supports both.
Investment metrics
- 1% rule
- 1.14% ✓
- Cap rate
- 5.99%
- Cash-on-cash
- -1.09%
- DSCR
- 0.95
- GRM
- 7.3
CMA / ARV
- ARV (on-the-fly)
- $407,008
- Comps found
- 12
Show comp detail 12 sales within ~0.75 mi
| Address | Dist | Beds/Ba | Sqft | Sold | Price | $/sf | Match |
|---|---|---|---|---|---|---|---|
| 531 Towne House Ln | 0.17mi | 4/2.5 (+1) | 1,889 (+4%) | 1mo | $285,000 | $151 | 78 |
| 727 Towne House Ln | 0.02mi | 3/3.0 | 1,817 (0%) | 22mo | $290,000 | $160 | 76 |
| 604 Gray Stone Ln | 0.63mi | 3/2.5 | 1,755 (-3%) | 1mo | $345,000 | $197 | 62 |
| 628 Raford Hill Ln | 0.57mi | 2/2.5 (-1) | 1,779 (-2%) | 2mo | $389,900 | $219 | 62 |
| 845 Rohan Dr | 0.55mi | 3/2.5 | 1,938 (+7%) | 4mo | $434,900 | $224 | 58 |
| 608 Raford Hill Ln | 0.58mi | 3/2.5 | 1,844 (+2%) | 22mo | $409,990 | $222 | 50 |
| 853 Rohan Dr | 0.55mi | 3/2.5 | 1,887 (+4%) | 20mo | $460,000 | $244 | 50 |
| 13303 Daystrom Ct | 0.63mi | 3/2.0 | 1,750 (-4%) | 21mo | $265,000 | $151 | 47 |
| 624 Raford Hill Ln | 0.57mi | 2/3.0 (-1) | 1,835 (+1%) | 21mo | $417,500 | $228 | 45 |
| 938 Dartford Dr | 0.64mi | 3/2.5 | 1,942 (+7%) | 17mo | $445,000 | $229 | 43 |
| 848 Rohan Dr | 0.57mi | 3/2.5 | 1,942 (+7%) | 22mo | $469,900 | $242 | 42 |
| 612 Gray Stone Ln | 0.62mi | 2/2.5 (-1) | 1,755 (-3%) | 23mo | $399,000 | $227 | 39 |
Match score weights: distance 35% · size 25% · config 20% · recency 20%. Top-matched comps best support the ARV.
Projected returns pro-forma
-3.0% appreciation · 0.19% rent growth · sell at horizon
- IRR
- -22.3%
- Equity multiple
- 0.26×
- Total profit
- $-43,167
- Equity at exit
- $30,939
- IRR
- -30.3%
- Equity multiple
- -0.13×
- Total profit
- $-65,822
- Equity at exit
- $17,941
Cash invested: $58,100 (down + closing). Projections, not guarantees.
Landlord ↔ Tenant lean methodology
- Overall (STATE)
- 87 Strongly Landlord-Friendly
- State Texas
- 87 Strongly Landlord-Friendly · R+5
- County
- — inherits STATE
- City
- — inherits STATE
ZIP-level market 75081
- Rents YoY
- 0.2%
- Active inventory
- 166
- Price-to-rent
- 7.3×
Monthly cashflow live
- Estimated rent
- $2,368 high interval (Pro) →
- Mortgage (P&I)
- −$1,088
- Tax from tax record
- −$449 /mo · $5,392/yr
- Insurance
- −$86
- HOA
- −$300
- Vacancy / Maint / Mgmt
- −$497
- Net cashflow
- $-53
Break-even live
Sensitivity live
| Price | -10% $65 | -5% $6 | +0% $-53 | +5% $-112 | +10% $-170 |
|---|---|---|---|---|---|
| Rent | -10% $-240 | -5% $-146 | +0% $-53 | +5% $41 | +10% $134 |
| Rate | -1.0pp $52 | -0.5pp $0 | base $-53 | +0.5pp $-107 | +1.0pp $-161 |
UW: 25.0% down · 7.5% · 30yr · 1.5% tax · 5.0% vac · 8.0% maint · 8.0% mgmt
Financing live
Cash to close
- Down payment
- $51,875
- Closing costs
- $6,225
- Reserves months
- —
- Total cash needed
- —
Loan-product check · same deal, 3 products live
Conventional
25% down · 7.5% · 30yr
- Down + closing
- —
- Monthly P&I
- —
- Monthly cashflow
- —
- DSCR
- —
- Eligible?
- —
Personal DTI + credit; lowest rate.
DSCR
20% down · 8.5% · 30yr
- Down + closing
- —
- Monthly P&I
- —
- Monthly cashflow
- —
- DSCR
- —
- Eligible?
- —
No personal income docs; deal must DSCR.
Hard money
10% down · 12.0% · 12mo
- Down + closing
- —
- Monthly P&I
- —
- Monthly cashflow
- —
- DSCR
- —
- Eligible?
- —
Short-term bridge; refi at stabilization.
Rent comps 40 comps
| Address | Beds | Baths | Sqft | Rent | $/sqft | DOM | Units | Dist |
|---|---|---|---|---|---|---|---|---|
| 625 Woodhaven Pl Richardson, TX | 3.0 | 2.0 | 1666 | $2,050 | $1.23 | 19d | 1 | 0.06mi |
| 524 Towne House Ln Richardson, TX | 3.0 | 2.0 | 1700 | $2,100 | $1.24 | 46d | 1 | 0.16mi |
| 808 Woodway Ln Richardson, TX | 3.0 | 2.0 | 1830 | $2,295 | $1.25 | 46d | 1 | 0.17mi |
| 808 Woodway Ln Richardson, TX | 3.0 | 2.0 | 1830 | $2,299 | $1.26 | 26d | 1 | 0.17mi |
| 811 Oakway Ct Richardson, TX | 3.0 | 2.0 | 1865 | $2,600 | $1.39 | 1d | 1 | 0.17mi |
| 609 Sunningdale Richardson, TX | 3.0 | 2.0 | 2061 | $2,800 | $1.36 | 46d | 1 | 0.20mi |
| 609 Sunningdale Richardson, TX | 3.0 | 2.0 | 2061 | $2,700 | $1.31 | 10d | 1 | 0.20mi |
| 501 Towne House Ln Richardson, TX | 3.0 | 2.5 | 1817 | $2,150 | $1.18 | 5d | 1 | 0.25mi |
| 501 Towne House Ln Richardson, TX | 3.0 | 2.5 | 1817 | $2,150 | $1.18 | 12d | 1 | 0.25mi |
| 613 Palomar Ln Richardson, TX | 4.0 | 3.0 | 2292 | $3,000 | $1.31 | 46d | 1 | 0.48mi |
| 540 Buckingham Rd Richardson, TX | 1.0–3.0 | 1.0–2.0 | 964 | $2,250 | $2.33 | 1d | 31 | 0.50mi |
| 824 Rohan Dr Richardson, TX | 3.0 | 2.5 | 1938 | $2,850 | $1.47 | 46d | 1 | 0.55mi |
| 836 Rohan Dr Richardson, TX | 3.0 | 2.5 | 1887 | $2,950 | $1.56 | 46d | 1 | 0.55mi |
| 856 Rohan Dr Unit 856 Richardson, TX | 3.0 | 2.5 | 1887 | $2,850 | $1.51 | 10d | 1 | 0.56mi |
| 856 Rohan Dr Unit 856 Richardson, TX | 3.0 | 2.5 | 1887 | $2,850 | $1.51 | 46d | 1 | 0.56mi |
| 13339 Fall Manor Dr Dallas, TX | 3.0 | 2.0 | 1616 | $2,000 | $1.24 | 10d | 1 | 0.57mi |
| 530 Buckingham Rd Richardson, TX | 1.0–3.0 | 1.0–2.0 | 995 | $2,503 | $2.52 | 0d | 22 | 0.58mi |
| 514 S Lois Ln Richardson, TX | 3.0 | 2.0 | 1912 | $2,350 | $1.23 | 46d | 1 | 0.59mi |
| 844 Dartford Dr Richardson, TX | 3.0 | 2.5 | 1924 | $2,400 | $1.25 | 46d | 1 | 0.59mi |
| 636 Gray Stone Ln Richardson, TX | 3.0 | 2.5 | 1603 | $2,550 | $1.59 | 26d | 1 | 0.61mi |
| 950 Dartford Dr Richardson, TX | 3.0 | 2.5 | 1924 | $2,700 | $1.40 | 24d | 1 | 0.63mi |
| 923 Whitehall Dr Richardson, TX | 3.0 | 2.5 | 2012 | $3,200 | $1.59 | 26d | 1 | 0.63mi |
| 939 Whitehall Dr Richardson, TX | 3.0 | 2.5 | 1887 | $2,600 | $1.38 | 7d | 1 | 0.64mi |
| 1308 Grinnell Dr Richardson, TX | 4.0 | 2.0 | 1768 | $2,450 | $1.39 | 1d | 1 | 0.71mi |
| 627 Tiffany Trl Richardson, TX | 3.0 | 3.0 | 2340 | $3,900 | $1.67 | 16d | 1 | 0.73mi |
| 10212 Panther Ridge Trl Dallas, TX | 4.0 | 2.5 | 2156 | $2,500 | $1.16 | 46d | 1 | 0.78mi |
| 616 Tiffany Trl Richardson, TX | 4.0 | 3.0 | 2471 | $2,999 | $1.21 | 13d | 1 | 0.79mi |
| 616 Tiffany Trl Richardson, TX | 4.0 | 3.0 | 2471 | $2,999 | $1.21 | 10d | 1 | 0.79mi |
| 411 Buckingham Rd Richardson, TX | 1.0–3.0 | 1.0–2.0 | 1002 | $2,490 | $2.49 | 1d | 29 | 0.80mi |
| 4708 Place One Dr Garland, TX | 4.0 | 2.0 | 1800 | $2,000 | $1.11 | 46d | 1 | 0.82mi |
| 1130 Greencove Ln Richardson, TX | 4.0 | 2.0 | 1398 | $2,295 | $1.64 | 1d | 1 | 0.83mi |
| 4718 Bethany Dr Garland, TX | 3.0 | 2.0 | 1236 | $2,100 | $1.70 | 13d | 1 | 0.96mi |
| 951 Abrams Rd Richardson, TX | 1.0–3.0 | 1.0–2.0 | 1045 | $2,222 | $2.13 | 23d | 1 | 1.05mi |
| 429 Sheffield Dr Richardson, TX | 4.0 | 3.5 | 2545 | $3,100 | $1.22 | 10d | 1 | 1.05mi |
| 532 S Greenville Ave Richardson, TX | 2.0 | 2.5 | 1353 | $2,400 | $1.77 | 26d | 1 | 1.07mi |
| 1234 Briarcove Dr Richardson, TX | 3.0 | 2.0 | 1380 | $2,600 | $1.88 | 26d | 1 | 1.08mi |
| 635 Matthew Pl Richardson, TX | 3.0 | 2.5 | 1956 | $2,600 | $1.33 | 21d | 1 | 1.09mi |
| 10135 Rita Rd Dallas, TX | 3.0 | 2.5 | 2413 | $2,550 | $1.06 | 21d | 1 | 1.19mi |
| 4509 Huntington Dr Garland, TX | 3.0 | 2.0 | 1281 | $2,300 | $1.80 | 46d | 1 | 1.26mi |
| 1111 Abrams Rd Richardson, TX | 1.0–3.0 | 1.0–2.0 | 1046 | $1,590 | $1.52 | 0d | 13 | 1.34mi |
HOA detail
- Monthly dues
- $300 · $3,600/yr
Listing history 3 events
-
2026-06-21days on market $207,500 Active 4 DOM
-
2026-06-18remarks 699-char remark
-
2026-06-18$207,500 Active 1 DOM
ⓘ Source: listings_history table (triggers on properties + properties_extension) + one-shot
backfill from property_details.listing_events for pre-trigger history.
Tax reassessment forecast TX · Resets to sale price
- Current annual tax
- $5,392 · $449/mo
- Projected year-2 tax
- $5,392 · $449/mo
- Expected delta
- $0/yr ($0/mo · 0.0%)
ⓘ Screening estimate from a state-policy table — verify with the county assessor before closing.
Climate risk First Street
- Flood 1/10 Low FEMA zone X (unshaded) · 0% chance over 30 yrs
- Wildfire 1/10 Low
- Heat 7/10 Severe 7 d/yr ≥109°F today · 23 d/yr by 30 yrs out
- Wind 6/10 Major 27% chance of damaging wind over 30 yrs
- Air quality 3/10 Moderate 3 unhealthy d/yr today · 3 by 30 yrs out
Nearby sold comps map
Loading sold comps map…
Walkable amenities ~0.75 mi
Loading nearby amenities…
Taxation est. · year 1
- Rental income
- $28,422
- − Mortgage interest
- −$11,623
- − Property taxes
- −$5,392
- − Insurance
- −$1,038
- − Repairs & maintenance
- −$2,274
- − Management
- −$2,274
- − HOA
- −$3,600
- − Depreciation
- −$6,036
- Taxable loss
- −$3,815
- Est. tax savings @ 24.0%
- +$916
- After-tax cash flow
- $281/yr
For passive investors: Depreciation is non-cash, so a rental often shows a tax loss while cash-flowing — sheltering income. Rental losses are passive: they offset passive income freely, and up to $25,000/yr can offset ordinary (W-2) income if you actively participate and your MAGI is under $100k (phasing out to $0 by $150k); unused losses carry forward. On sale, claimed depreciation is recaptured at up to 25%, and gains may owe capital-gains tax (a 1031 exchange can defer both). Figures are a year-1 estimate at your 24.0% rate — not tax advice; consult a CPA.
Schools (NCES district)
- District
- Richardson ISD
- NCES district ID
- 4837020
- Math proficiency
- 40% ▼ -14.00%
- Reading proficiency
- 44% ▼ -6.00%
- Median HH income
- $54,609
- Composite
- 36.58/100
- National rank
- #4633
- State rank
- #316 of 826 in TX
Livability — Richardson
- Score
- 85/100
- State rank
- #5
- US rank
- #551
Category grades
Schools grade is shown separately in the Schools card above.
Census & demographics
- Census place
- Richardson, TX
- County
- Dallas County · 2,612,404 people
- City population
- 118,731
- Metro
- Dallas-Fort Worth-Arlington, TX
- Population (ZIP)
- 36,544
- Household income
- $93,165
- Rent vs Own
- Severe rent burden
- 1347.0
Population outlook (Dallas County) Hauer SSP2
- Today (2025)
- 2,979,839 people
- By 2030
- 3,191,823 · +7.1%
- By 2040
- 3,619,611 · +21.5%
- By 2050
- 4,026,915 · +35.1%
- By 2075
- 4,957,073 · +66.4%
- By 2100
- 5,508,725 · +84.9%
Race, ethnicity, and origin ACS 2023
- Neighborhood character
- Diverse neighborhood (Simpson 0.70)
- Race & ethnicity
- White 46% Black 21% Hispanic / Latino 18% Asian 11% Two or more races 8%
- Hispanic origin (detail)
- Mexican 15%
- Common ancestry
- Arab 2% Lithuanian 2% Slovak 2%
- Foreign-born
- 28% · Canada, China, Vietnam
- Languages at home
- 61% English-only · Spanish 15% Other Indo-European 5% Arabic 4%
Political lean MEDSL · Dallas
- 2024 margin
- Strong D (+22.2) · D 60.2% · R 38.0% · Other 1.8%
- 2008→2024 swing
- +6.9pp toward D · 2008: 15.3pp · 2024: 22.2pp
- All cycles
- 2024: D+22.2 2020: D+31.6 2016: D+26.2 2012: D+15.4 2008: D+15.3
Not yet ingested
- Civics
- —
Market trends
- HPI YoY
- ▼ -290.20%
- Current HPI
- 305.9843
- Rent YoY
- ▲ 0.19%
- Metro
- Dallas-Fort Worth-Arlington, TX
- State GDP YoY
- ▲ 3.95%
- F500 in state
- 110
Industry mix (Fortune 500 HQ in TX)
| Industry | F500 HQs | Revenue |
|---|---|---|
| Energy | 16 | $1,198B |
|
||
| Technology | 5 | $198B |
|
||
| Engineering / Construction | 4 | $72B |
|
||
| Energy Services | 3 | $60B |
|
||
| Utilities | 3 | $41B |
|
||
| Healthcare | 2 | $330B |
|
||
Price history
2 events — show timeline
- 2026-06-17 Listed $207,500 NTREIS
- 1993-12-27 Sold (Public Records) — Public Records
Property tax history
+6.2%/yrLatest (2025): $5,392 · +0.0% YoY. Source: county tax records.
Cash-flow waterfall
monthlySold comps — $/sqft
last 12 mo · ≤1 miLoading sold comps…