2412 Collins Blvd · Gulfport, MS
Flood risk 1/10 · Minimal
- FEMA flood zone
- X (unshaded)
- Chance of flooding over 30 yrs
- 0.0%
- Est. flood insurance / yr
- $507 – $1,088
Fire risk 1/10 · Minimal
- Est. fire insurance / yr
- $1,241 – $2,305
Heat risk 10/10 · Severe
- Hot days now (above 105°F)
- 7 days/yr
- Hot days in 30 yrs
- 24 days/yr
Wind risk 9/10 · Severe
- Chance of severe wind over 30 yrs
- 99.0%
Air-quality risk 3/10 · Minor
- Unhealthy air days now
- 2 days/yr
- Unhealthy air days in 30 yrs
- 3 days/yr
Risk factors via First Street. Map © Google.
Why this score? — see what drove the B grade
The composite is a weighted blend of 9 inputs, each scored 0–100. Each bar is that input's sub-score; the figure is the points it added to the 100-point composite (weight × sub-score).
- Cash flow +29.2/30.0
- ARV discount +15.0/15.0
- DSCR +10.0/10.0
- 1% rule +7.1/10.0
- Livability +3.7/5.0
- Rent growth +3.6/5.0
- Schools +3.4/10.0
- Condition / age +2.5/5.0
- Appreciation +0.0/10.0
$165,000
🖨 Deal sheet 📄 Offer letter ✓ Due diligence
Listing remarks
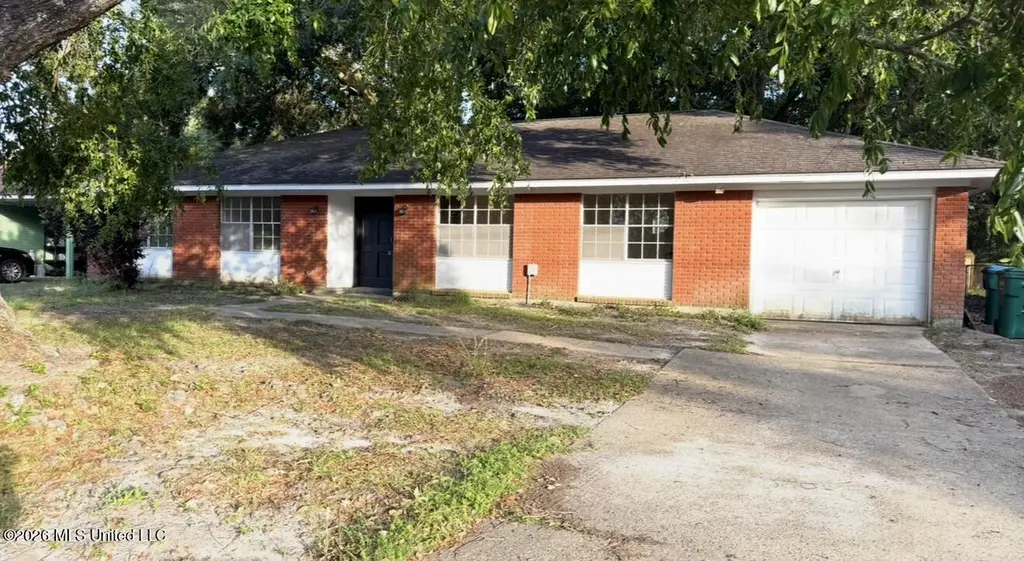
Discover the potential of coastal living in the heart of Gulfport with this affordable 3-bedroom, 2-bath home located just minutes from the beach, shopping, dining, schools, and entertainment. Nestled near the iconic Armed Forces Retirement Home, this property offers two spacious living areas, a 1-car garage, and a large fenced backyard with plenty of room for entertaining, pets, gardening, playsets, or even your future pool oasis. This Gulfport home is high and dry with no flood insurance required and reportedly did not flood during Hurricane Katrina — a huge advantage for Mississippi Gulf Coast buyers. Enjoy easy access to the beach using the nearby Highway 90 pedestrian overpass wa
Key facts
- 0.24 acre lot
- Garage
- Built 1970
Tags
Property features AI
Exterior
- Parking: Driveway; Garage faces front; 1-car garage
- Utilities: Public water; Public sewer; Electricity connected; Natural gas connected
- Home design: Single-family house; One story; Fixer condition; Facing information not provided
- Construction: Brick construction; Shingle roof; Slab foundation; Built year available from public records
- Exterior features: Back yard fencing; City lot
Interior
- Kitchen: Free-standing gas range; Refrigerator
- Bathrooms: 2 full bathrooms
- Heating & cooling: Central heating; Central air conditioning
- Interior features: Private entrance
Neighborhood map
What this means for you Summary
Snapshot
- This is a 3-bed/1.0-bath single-family listed at $165k.
Deal economics
- At list price, monthly cash flow is $573 ($7k/yr) — positive.
- The deal already cash-flows at list — no discount required.
- Meets the 1% rule at list price ($2k rent vs $165k).
- Recommended offer: $163k (1.5% below list) — sets the bar for market timing.
- Cap rate 10.5% vs local median 4.9% in Gulfport — top-decile yield for the area; either an underpriced asset or a hidden risk that comps aren't pricing in. Stress-test before assuming the spread holds.
Location & tenants
- Location reads 73/100 on livability (#15 in MS) — a middle-class / working-renter tenant base. Strengths: cost of living A+, housing A+, health & safety A+; Watch: amenities F, commute F, employment F.
- Gulfport School District (urban): math 41% / reading 42% proficiency, ranked #37 of 130 in MS (top 28%) — families likely to look elsewhere, expect single-tenant / working-renter base with shorter leases; 67% free/reduced lunch — lower-income household profile, screen leases tightly.
- Zoned schools: Anniston Avenue Elementary School (math 52% / reading 53%, grade C-, #53 of 375 statewide, top 14%, 535 students, 100% FRL); Bayou View Middle School (math 54% / reading 49%, grade C, #27 of 179 statewide, top 16%, 826 students, 100% FRL); Gulfport High School (math 42% / reading 36%, grade F, #54 of 197 statewide, top 28%, 1,728 students, 100% FRL) — zoned schools average 100% FRL vs 67% district-wide (33 pts higher); higher-poverty schools than district average — tighter screening recommended.
- Market conditions: Rents rising fast (+4.3%/yr); 301 active listings in the ZIP; 31 comparable units currently listed for rent nearby; rentals lingering (median 44d on market — plan ~5-8 weeks vacancy on turnover, expect pricing pressure); 58% of comp listings sitting > 30 days — soft ceiling on asking rent; 2,194 units permitted in Harrison County in 2024 (0 in 5+ unit buildings).
- This rent runs 44% of the median local income ($55k/yr) — at the standard rent-burdened threshold; future hikes will face affordability resistance.
Forward outlook
- Local home prices are declining (-3.0%/yr); year-one equity from $1k of loan paydown is wiped out by about $5k of value loss. Plan a longer hold.
- Harrison County population projected at +27% by 2050 — long-run rental-demand tailwind backs the buy-and-hold thesis.
- At projected returns (-3.0% appreciation + 4.3% rent growth), your $46k cash investment doubles in ~8 years — after that, you're playing with house money.
Negotiation context
- It's been on market 23 days — a 2% lower offer ($163k) is reasonable based on typical stale-listing flexibility.
Risks & watch-outs
- Climate carrying-cost: severe wind risk, 99% chance of damaging wind over 30y; extreme-heat days projected 7→24/yr by 2055 (HVAC capex compounding) — expect insurance premiums to compound above CPI over the hold.
Questions for the listing agent
- Built in 1970 — when were the roof, HVAC, electrical panel, plumbing, and water heater last replaced?
- Is there a deadline driving the sale (1031 exchange, divorce, estate, relocation)? That informs how much negotiation room exists.
- Schools are D-rated, which usually means shorter tenancies and higher turnover. Who's the typical renter profile here, and what's been the actual vacancy rate?
- What's the average days-on-market for RENTAL listings here right now (not sales)? A rising rental-DOM trend means longer vacancies and softer asking-rent achievability than the comps imply.
- What's the recent tenant-quality profile in this submarket — average credit score on applications, eviction rate, late-payment / NSF rate, and stable-employment percentage? A property-management company in the area should have these aggregated.
- How much new for-sale + rental construction is in the pipeline within 1–3 miles? Heavy new supply typically softens prices + rents 12–24 months out; constrained supply supports both.
Investment metrics
- 1% rule
- 1.21% ✓
- Cap rate
- 10.46%
- Cash-on-cash
- 14.88%
- DSCR
- 1.66
- GRM
- 6.9
CMA / ARV
- ARV (on-the-fly)
- $230,275
- Comps found
- 12
Show comp detail 12 sales within ~0.75 mi
| Address | Dist | Beds/Ba | Sqft | Sold | Price | $/sf | Match |
|---|---|---|---|---|---|---|---|
| 621 Sarazen Dr | 0.22mi | 3/2.0 | 1,550 (+2%) | 2mo | $263,500 | $170 | 82 |
| 2305 Anniston Oaks Dr | 0.35mi | 3/2.0 | 1,489 (-2%) | 6mo | $224,999 | $151 | 71 |
| 2106 Boardman Blvd | 0.45mi | 3/1.5 | 1,428 (-6%) | 6mo | $177,500 | $124 | 62 |
| 1311 Redfish Dr | 0.68mi | 3/2.0 | 1,561 (+2%) | 1mo | $291,620 | $187 | 60 |
| 1057 Flounder Way | 0.68mi | 3/2.0 | 1,561 (+2%) | 3mo | $293,695 | $188 | 58 |
| 1304 Redfish Dr | 0.63mi | 3/2.0 | 1,561 (+2%) | 7mo | $290,560 | $186 | 57 |
| 494 Northeast Ave | 0.44mi | 3/2.0 | 1,367 (-10%) | 7mo | $170,000 | $124 | 52 |
| 2500 Demaret Dr | 0.67mi | 3/2.0 | 1,637 (+7%) | 3mo | $210,000 | $128 | 50 |
| 2207 Gregory Blvd | 0.59mi | 3/2.0 | 1,643 (+8%) | 8mo | $209,000 | $127 | 49 |
| 2419 Demaret Dr | 0.68mi | 3/2.0 | 1,650 (+8%) | 3mo | $197,500 | $120 | 48 |
| 1300 Redfish Dr | 0.66mi | 3/2.0 | 1,656 (+9%) | 6mo | $293,871 | $177 | 46 |
| 2634 Palmer Dr | 0.74mi | 4/2.5 (+1) | 1,640 (+8%) | 0mo | $239,999 | $146 | 42 |
Match score weights: distance 35% · size 25% · config 20% · recency 20%. Top-matched comps best support the ARV.
Projected returns pro-forma
-3.0% appreciation · 4.26% rent growth · sell at horizon
- IRR
- 6.7%
- Equity multiple
- 1.27×
- Total profit
- $12,279
- Equity at exit
- $24,602
- IRR
- 17.1%
- Equity multiple
- 2.48×
- Total profit
- $68,307
- Equity at exit
- $14,266
Cash invested: $46,200 (down + closing). Projections, not guarantees.
Landlord ↔ Tenant lean methodology
- Overall (STATE)
- 90 Strongly Landlord-Friendly
- State Mississippi
- 90 Strongly Landlord-Friendly · R+11
- County
- — inherits STATE
- City
- — inherits STATE
ZIP-level market 39507
- Home prices YoY
- -27.1%
- Rents YoY
- 4.3%
- Active inventory
- 301
- Price-to-rent
- 6.9×
Monthly cashflow live
- Estimated rent
- $2,003 high interval (Pro) →
- Mortgage (P&I)
- −$865
- Tax from tax record
- −$75 /mo · $903/yr
- Insurance
- −$69
- HOA
- −$0
- Vacancy / Maint / Mgmt
- −$421
- Net cashflow
- $573
Break-even live
UW: 25.0% down · 7.5% · 30yr · 1.5% tax · 5.0% vac · 8.0% maint · 8.0% mgmt
Financing live
Cash to close
- Down payment
- $41,250
- Closing costs
- $4,950
- Reserves months
- —
- Total cash needed
- —
Loan-product check · same deal, 3 products live
Conventional
25% down · 7.5% · 30yr
- Down + closing
- —
- Monthly P&I
- —
- Monthly cashflow
- —
- DSCR
- —
- Eligible?
- —
Personal DTI + credit; lowest rate.
DSCR
20% down · 8.5% · 30yr
- Down + closing
- —
- Monthly P&I
- —
- Monthly cashflow
- —
- DSCR
- —
- Eligible?
- —
No personal income docs; deal must DSCR.
Hard money
10% down · 12.0% · 12mo
- Down + closing
- —
- Monthly P&I
- —
- Monthly cashflow
- —
- DSCR
- —
- Eligible?
- —
Short-term bridge; refi at stabilization.
Rent comps 31 comps
| Address | Beds | Baths | Sqft | Rent | $/sqft | DOM | Units | Dist |
|---|---|---|---|---|---|---|---|---|
| 2420 Demaret Dr Gulfport, MS | 4.0 | 2.0 | 1600 | $1,800 | $1.12 | 43d | 1 | 0.64mi |
| 1525 E Pass Rd Gulfport, MS | 1.0–3.0 | 1.0–2.0 | 1070 | $1,519 | $1.42 | 21d | 1 | 0.66mi |
| 1276 Century Oaks Dr Gulfport, MS | 3.0 | 3.0 | 1283 | $2,100 | $1.64 | 43d | 1 | 0.76mi |
| 1270 Century Oaks Dr Gulfport, MS | 3.0 | 3.0 | 1158 | $1,950 | $1.68 | 43d | 1 | 0.78mi |
| 2252 Beach Dr Gulfport, MS | 3.0 | 2.0 | 1691 | $2,800 | $1.66 | 43d | 1 | 0.80mi |
| 2610 Demaret Dr Gulfport, MS | 4.0 | 1.5 | 1700 | $1,995 | $1.17 | 43d | 1 | 0.80mi |
| 1215 Ocean View Dr Gulfport, MS | 3.0 | 2.0 | 1710 | $2,895 | $1.69 | 21d | 1 | 0.80mi |
| 1229 Century Oaks Dr Gulfport, MS | 3.0 | 3.0 | 1200 | $2,600 | $2.17 | 21d | 1 | 0.81mi |
| 2230 Beach Dr Gulfport, MS | 3.0 | 3.0 | 1852 | $3,195 | $1.73 | 43d | 1 | 0.81mi |
| 2228 Beach Dr #506 Gulfport, MS | 2.0 | 2.0 | 1164 | $2,995 | $2.57 | 43d | 1 | 0.82mi |
| 2228 Beach Dr Gulfport, MS | 2.0 | 2.0 | 1279 | $2,895 | $2.26 | 21d | 1 | 0.82mi |
| 1100 Century Oaks Dr Unit A Gulfport, MS | 3.0 | 3.0 | 1156 | $2,200 | $1.90 | 43d | 1 | 0.82mi |
| 1131 Century Oaks Dr Gulfport, MS | 3.0 | 3.0 | 1156 | $1,800 | $1.56 | 43d | 1 | 0.83mi |
| 1101 Century Oaks Dr Gulfport, MS | 3.0 | 3.0 | 1330 | $1,700 | $1.28 | 43d | 1 | 0.84mi |
| 1339 Foxwood Pl Gulfport, MS | 3.0 | 2.0 | 1100 | $1,375 | $1.25 | 43d | 1 | 1.01mi |
| 954 Old Towne St Gulfport, MS | 3.0 | 2.0 | 1533 | $1,900 | $1.24 | 13d | 1 | 1.12mi |
| 477 Tegarden Rd Unit D Gulfport, MS | 3.0 | 2.0 | 1300 | $1,300 | $1.00 | 13d | 1 | 1.13mi |
| 153 Markham Dr Gulfport, MS | 3.0 | 2.0 | 1650 | $3,000 | $1.82 | 43d | 1 | 1.15mi |
| 1114 Washington Ave Gulfport, MS | 3.0 | 2.0 | 1200 | $1,350 | $1.12 | 21d | 1 | 1.16mi |
| 248 Debuys Rd Biloxi, MS | 1.0–2.0 | 1.0–2.0 | 979 | $1,300 | $1.33 | 13d | 11 | 1.26mi |
| 2255 Switzer Rd Gulfport, MS | 1.0–3.0 | 1.0–2.0 | 1072 | $1,500 | $1.40 | 13d | 12 | 1.29mi |
| 2668 Beach Blvd Biloxi, MS | 2.0 | 2.0 | 1392 | $2,300 | $1.65 | 43d | 1 | 1.30mi |
| 2668 Beach Blvd Biloxi, MS | 3.0 | 3.0 | 1813 | $2,900 | $1.60 | 13d | 1 | 1.30mi |
| 938 Jefferson Dr Gulfport, MS | 2.0 | 1.5 | 1290 | $1,375 | $1.07 | 21d | 1 | 1.41mi |
| 924 Jefferson Dr Gulfport, MS | 3.0 | 2.5 | 1613 | $1,675 | $1.04 | 43d | 1 | 1.41mi |
| 910 Jefferson Dr Gulfport, MS | 3.0 | 2.5 | 1613 | $1,675 | $1.04 | 43d | 1 | 1.41mi |
| 928 Jefferson Dr Gulfport, MS | 2.0 | 1.5 | 1301 | $1,375 | $1.06 | 43d | 1 | 1.41mi |
| 936 Jefferson Dr Gulfport, MS | 2.0 | 1.5 | 1290 | $1,375 | $1.07 | 21d | 1 | 1.41mi |
| 894 Jefferson Dr Gulfport, MS | 3.0 | 2.5 | 1541 | $1,675 | $1.09 | 43d | 1 | 1.41mi |
| 918 Jefferson Dr Gulfport, MS | 2.0 | 1.5 | 1301 | $1,375 | $1.06 | 43d | 1 | 1.41mi |
| 2795 Eula Rd Biloxi, MS | 3.0 | 2.5 | 1550 | $1,800 | $1.16 | 13d | 1 | 1.45mi |
Listing history 13 events
-
2026-06-13statusdays on market $165,000 Pending 23 DOM
-
2026-06-10days on market $165,000 Active 22 DOM
-
2026-06-09days on market $165,000 Active 21 DOM
-
2026-06-08days on market $165,000 Active 20 DOM
-
2026-06-07days on market $165,000 Active 19 DOM
-
2026-06-05days on market $165,000 Active 16 DOM
-
2026-06-03price $165,000 Active 14 DOM
-
2026-06-02days on market $175,000 Active 14 DOM
-
2026-06-01days on market $175,000 Active 13 DOM
-
2026-05-31days on market $175,000 Active 12 DOM
-
2026-05-30days on market $175,000 Active 11 DOM
-
2026-05-19$175,000 Active
-
2017-02-01soldstatus
ⓘ Source: listings_history table (triggers on properties + properties_extension) + one-shot
backfill from property_details.listing_events for pre-trigger history.
Tax reassessment forecast MS · Resets to sale price
- Current annual tax
- $903 · $75/mo
- Projected year-2 tax
- $1,304 · $109/mo
- Expected delta
- +$400/yr (+$33/mo · 44.3%)
ⓘ Screening estimate from a state-policy table — verify with the county assessor before closing.
Climate risk First Street
- Flood 1/10 Low FEMA zone X (unshaded) · 0% chance over 30 yrs
- Wildfire 1/10 Low
- Heat 10/10 Extreme 7 d/yr ≥105°F today · 24 d/yr by 30 yrs out
- Wind 9/10 Extreme 99% chance of damaging wind over 30 yrs
- Air quality 3/10 Moderate 2 unhealthy d/yr today · 3 by 30 yrs out
Nearby sold comps map
Loading sold comps map…
Walkable amenities ~0.75 mi
Loading nearby amenities…
Taxation est. · year 1
- Rental income
- $24,035
- − Mortgage interest
- −$9,243
- − Property taxes
- −$903
- − Insurance
- −$825
- − Repairs & maintenance
- −$1,923
- − Management
- −$1,923
- − Depreciation
- −$4,800
- Taxable income
- $4,419
- Est. tax owed @ 24.0%
- −$1,060
- After-tax cash flow
- $5,816/yr
For passive investors: Depreciation is non-cash, so a rental often shows a tax loss while cash-flowing — sheltering income. Rental losses are passive: they offset passive income freely, and up to $25,000/yr can offset ordinary (W-2) income if you actively participate and your MAGI is under $100k (phasing out to $0 by $150k); unused losses carry forward. On sale, claimed depreciation is recaptured at up to 25%, and gains may owe capital-gains tax (a 1031 exchange can defer both). Figures are a year-1 estimate at your 24.0% rate — not tax advice; consult a CPA.
Schools (NCES district)
- District
- Gulfport School District
- NCES district ID
- 2801710
- Math proficiency
- 41% ▼ -15.00%
- Reading proficiency
- 42% ▼ -6.00%
- Median HH income
- $35,712
- Composite
- 34.38/100
- National rank
- #5213
- State rank
- #37 of 130 in MS
Livability — Gulfport
- Score
- 73/100
- State rank
- #15
- US rank
- #5010
Category grades
Schools grade is shown separately in the Schools card above.
Census & demographics
- Census place
- Gulfport, MS
- County
- Harrison County · 178,171 people
- City population
- 96,188
- Metro
- Gulfport-Biloxi, MS
- Population (ZIP)
- 18,564
- Household income
- $54,657
- Rent vs Own
- Severe rent burden
- 1059.0
Population outlook (Harrison County) Hauer SSP2
- Today (2025)
- 228,444 people
- By 2030
- 241,942 · +5.9%
- By 2040
- 267,531 · +17.1%
- By 2050
- 291,062 · +27.4%
- By 2075
- 346,711 · +51.8%
- By 2100
- 378,165 · +65.5%
Race, ethnicity, and origin ACS 2023
- Neighborhood character
- Majority White (65%)
- Race & ethnicity
- White 65% Black 24% Hispanic / Latino 6% Two or more races 5% Asian 1%
- Hispanic origin (detail)
- Mexican 2% Cuban 1%
- Common ancestry
- Slovak 4% Lithuanian 4% Romanian 2%
- Foreign-born
- 4% · Canada
- Languages at home
- 94% English-only · Spanish 2% French/Haitian/Cajun 2% Other Indo-European 1%
Political lean MEDSL · Harrison
- 2024 margin
- Strong R (+28.9) · D 35.0% · R 63.9% · Other 1.1%
- 2008→2024 swing
- -2.9pp toward R · 2008: -26.0pp · 2024: -28.9pp
- All cycles
- 2024: R+28.9 2020: R+25.2 2016: R+30.7 2012: R+26.6 2008: R+26.0
Not yet ingested
- Civics
- —
Market trends
- HPI YoY
- ▼ -67.48%
- Current HPI
- 181.6606
- Rent YoY
- ▲ 4.26%
- Metro
- Gulfport-Biloxi, MS
- State GDP YoY
- —
- F500 in state
- 0
Price history
2 events — show timeline
- 2026-05-19 Listed $175,000 MLSU
- 2017-02-01 Sold (Public Records) — Public Records
Property tax history
+18.2%/yrLatest (2025): $903 · +2.5% YoY. Source: county tax records.
Cash-flow waterfall
monthlySold comps — $/sqft
last 12 mo · ≤1 miLoading sold comps…