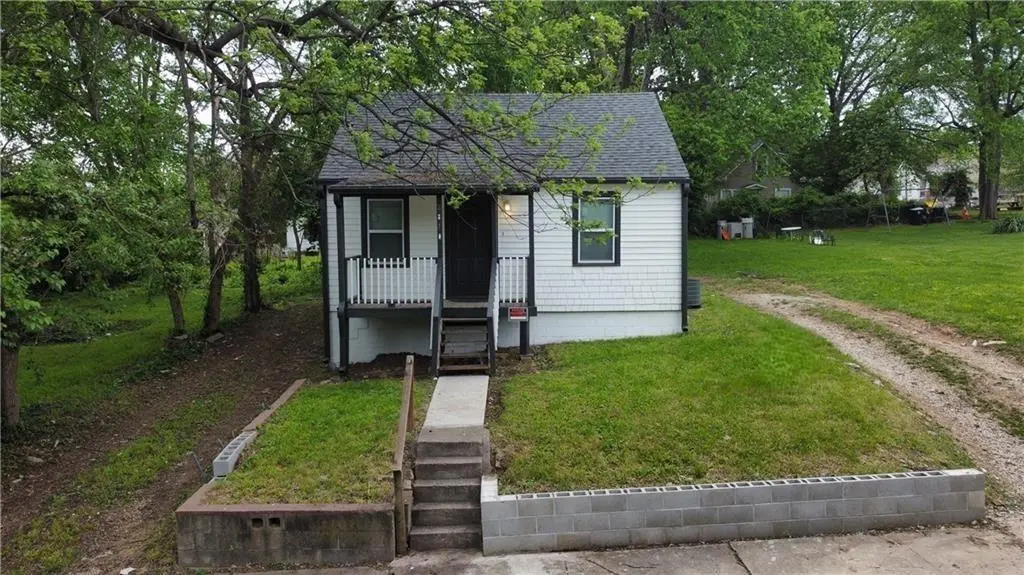
2810 Elmwood Ave · Kansas City, MO
Flood risk 1/10 · Minimal
- FEMA flood zone
- X (unshaded)
- Chance of flooding over 30 yrs
- 0.0%
- Est. flood insurance / yr
- $473 – $860
Fire risk 1/10 · Minimal
- Est. fire insurance / yr
- $1,054 – $1,958
Heat risk 4/10 · Minor
- Hot days now (above 106°F)
- 7 days/yr
- Hot days in 30 yrs
- 17 days/yr
Wind risk 2/10 · Minimal
- Chance of severe wind over 30 yrs
- —
Air-quality risk 3/10 · Minor
- Unhealthy air days now
- 2 days/yr
- Unhealthy air days in 30 yrs
- 3 days/yr
Risk factors via First Street. Map © Google.
Why this score? — see what drove the D+ grade
The composite is a weighted blend of 9 inputs, each scored 0–100. Each bar is that input's sub-score; the figure is the points it added to the 100-point composite (weight × sub-score).
- Cash flow +16.3/30.0
- Appreciation +10.0/10.0
- DSCR +5.1/10.0
- Livability +3.9/5.0
- 1% rule +3.8/10.0
- Rent growth +3.7/5.0
- Condition / age +2.5/5.0
- Schools +1.5/10.0
- ARV discount +0.0/15.0
$120,000
🖨 Deal sheet 📄 Offer letter ✓ Due diligence
Listing remarks
Ready to Move Into House and Extra Lot!!! Completely Renovated with New Paint Outside and Inside, 2 Bedrooms and 1 Full Bathroom, Nice updates, with luxury vinyl tile flooring. Excellent open living room and dining room, with a lot natural light. The Kitchen has white cabinets, a nice backsplash, an electric stove and an all electric system inside the house. Updated windows and spacious laundry room, with back deck and huge backyard to enjoy BBQ and play ground. And an EXTRA LOT 2806 ELMWOOD AVE. KC. MO. 64128. on the side to include for the same price. Come and check your next sweet home, and move in with total peace of minds. Schedule a showing today! OPEN HOUSE SATURDAY MAY 2 FROM 1.00 P
Key facts
- 5,283 sq ft lot
- Built 1949
- Listed 2 days
Property features AI
Exterior
- Parking: Off-street parking
- Utilities: Public water; Public sewer
- Home design: Single family residence; Ranch floor plan; Residential property
- Construction: Frame construction; Composition roof
- Exterior features: Deck; Metal fencing; Shed(s); City lot
Interior
- Kitchen: Electric range
- Bedrooms: 2 bedrooms
- Flooring: Luxury vinyl
- Bathrooms: 1 full bathroom
- Heating & cooling: Natural gas heating; Electric cooling
- Interior features: Stained cabinets; Thermal windows; Shower over tub
- Laundry & utility: Main level laundry
Neighborhood map
What this means for you Summary
Snapshot
- This is a 1-bed/1.0-bath single-family listed at $120k.
Deal economics
- At list price, monthly cash flow is $67 ($800/yr) — positive.
- The deal already cash-flows at list — no discount required.
- To meet the 1% rule (rent ≥ 1% of price), the offer needs to be $105k (12.2% below list).
- Recommended offer: $105k (12.2% below list) — sets the bar for 1% rule.
- Cap rate 7.0% vs local median 3.9% in Kansas City — top-decile yield for the area; either an underpriced asset or a hidden risk that comps aren't pricing in. Stress-test before assuming the spread holds.
Location & tenants
- Location reads 78/100 on livability (#28 in MO, #2,671 nationally) — a middle-class / working-renter tenant base. Strengths: amenities A+, commute A+, cost of living A+; Watch: crime F.
- Kansas City 33 (urban): math 12% / reading 24% proficiency, ranked #308 of 324 in MO (top 95%) — low school quality limits family demand, transient renter base, plan for 1-2y turnover; 75% free/reduced lunch — lower-income household profile, screen leases tightly.
- Zoned schools: Phillis Wheatley Elementary (math 2% / reading 8%, grade F, #1,072 of 1,115 statewide, top 98%, 391 students, 99% FRL); Northeast High (math 2% / reading 22%, grade F, #497 of 521 statewide, top 96%, 657 students, 100% FRL) — zoned schools average 99% FRL vs 75% district-wide (24 pts higher); higher-poverty schools than district average — tighter screening recommended.
- Market conditions: Rents rising fast (+4.7%/yr); 86 active listings in the ZIP; 20 comparable units currently listed for rent nearby; rentals at typical pace (median 21d on market — plan ~3-4 weeks tenant-placement turnaround); lower-income renter base — watch delinquency; 4,002 units permitted in Jackson County in 2024 (2,271 in 5+ unit buildings).
Forward outlook
- In year one you build about $13k of equity ($830 loan paydown + $12k appreciation (10.0% local appreciation)).
- Jackson County population projected at +4% by 2050 — modest demand growth; plan on rents tracking national, not racing it.
- At projected returns (10.0% appreciation + 4.7% rent growth), your $34k cash investment doubles in ~3 years — after that, you're playing with house money.
- By year 3, paydown + projected appreciation supports a ~$32k cash-out refi (75% LTV) — recoverable capital for the next deal without selling this one.
Negotiation context
- Only 2 days on market — expect competitive offers; lowballing is unlikely to land.
- 4 sale attempts since 3y ago with the ask held roughly flat each time — persistent listings suggest the price (not the market) is what's stuck; bring a comps-based counter.
- Current owner paid $1k; list at $120k implies a 8239% gain — meaningful room to come down on a strong offer.
Risks & watch-outs
- Watch-outs: built in 1949 — expect roof / HVAC / electrical / plumbing capex.
Questions for the listing agent
- Built in 1949 — when were the roof, HVAC, electrical panel, plumbing, and water heater last replaced?
- Is there a deadline driving the sale (1031 exchange, divorce, estate, relocation)? That informs how much negotiation room exists.
- Crime grade is F in this area — have there been break-ins, vandalism, or insurance claims at this property in the last 3 years? What carrier currently insures it and at what premium?
- The area grade is low — what's the realistic commute time and amenity access for the typical tenant pool here? Any planned neighborhood developments (good or bad) we should know about?
- What's the average days-on-market for RENTAL listings here right now (not sales)? A rising rental-DOM trend means longer vacancies and softer asking-rent achievability than the comps imply.
- What's the recent tenant-quality profile in this submarket — average credit score on applications, eviction rate, late-payment / NSF rate, and stable-employment percentage? A property-management company in the area should have these aggregated.
- How much new for-sale + rental construction is in the pipeline within 1–3 miles? Heavy new supply typically softens prices + rents 12–24 months out; constrained supply supports both.
Investment metrics
- 1% rule
- 0.88% ✗
- Cap rate
- 6.96%
- Cash-on-cash
- 2.38%
- DSCR
- 1.11
- GRM
- 9.5
CMA / ARV
- ARV (median comp)
- $89,438
- List price
- $120,000
- Delta
- 34.17%
- Verdict
- OVERPRICED
- Comps
- 20 within 1.0 mi
Show comp detail 12 sales within ~0.75 mi
| Address | Dist | Beds/Ba | Sqft | Sold | Price | $/sf | Match |
|---|---|---|---|---|---|---|---|
| 2810 Elmwood Ave | 0.00mi | 2/1.0 (+1) | 856 (+13%) | 1mo | $120,000 | $140 | 72 |
| 3133 Chelsea Ave | 0.45mi | 2/1.0 (+1) | 762 (+1%) | 1mo | $78,990 | $104 | 72 |
| 3017 Poplar Ave | 0.32mi | 2/1.0 (+1) | 760 (+0%) | 13mo | $72,000 | $95 | 68 |
| 2715 Brighton Ave | 0.29mi | 2/1.0 (+1) | 704 (-7%) | 4mo | $90,000 | $128 | 67 |
| 3224 Lister Ave | 0.55mi | 2/1.0 (+1) | 792 (+5%) | 3mo | $30,000 | $38 | 59 |
| 3017 York St | 0.36mi | 2/1.0 (+1) | 789 (+4%) | 16mo | $70,000 | $89 | 58 |
| 2734 Jackson Ave | 0.26mi | 2/1.0 (+1) | 812 (+7%) | 16mo | $50,000 | $62 | 57 |
| 3902 E 24th St | 0.68mi | 2/1.0 (+1) | 800 (+6%) | 6mo | $140,000 | $175 | 48 |
| 3304 Norton St | 0.68mi | 2/1.0 (+1) | 792 (+5%) | 9mo | $90,000 | $114 | 48 |
| 3207 Kensington Ave | 0.51mi | 2/1.0 (+1) | 678 (-10%) | 12mo | $84,900 | $125 | 44 |
| 5616 E 27th Ter | 0.69mi | 2/1.0 (+1) | 792 (+5%) | 16mo | $62,500 | $79 | 42 |
| 2432 Cypress Ave | 0.47mi | 2/1.0 (+1) | 832 (+10%) | 18mo | $68,000 | $82 | 42 |
Match score weights: distance 35% · size 25% · config 20% · recency 20%. Top-matched comps best support the ARV.
Projected returns pro-forma
10.0% appreciation · 4.65% rent growth · sell at horizon
- IRR
- 26.5%
- Equity multiple
- 3.12×
- Total profit
- $71,352
- Equity at exit
- $108,106
- IRR
- 23.7%
- Equity multiple
- 7.27×
- Total profit
- $210,593
- Equity at exit
- $233,134
Cash invested: $33,600 (down + closing). Projections, not guarantees.
Landlord ↔ Tenant lean methodology
- Overall (STATE)
- 81 Strongly Landlord-Friendly
- State Missouri
- 81 Strongly Landlord-Friendly · R+10
- County
- — inherits STATE
- City
- — inherits STATE
ZIP-level market 64128
- Home prices YoY
- 21.6%
- Rents YoY
- 4.7%
- Active inventory
- 86
- Price-to-rent
- 9.5×
Monthly cashflow live
- Estimated rent
- $1,053 high interval (Pro) →
- Mortgage (P&I)
- −$629
- Tax from tax record
- −$86 /mo · $1,032/yr
- Insurance
- −$50
- HOA
- −$0
- Vacancy / Maint / Mgmt
- −$221
- Net cashflow
- $67
Break-even live
UW: 25.0% down · 7.5% · 30yr · 1.5% tax · 5.0% vac · 8.0% maint · 8.0% mgmt
Financing live
Cash to close
- Down payment
- $30,000
- Closing costs
- $3,600
- Reserves months
- —
- Total cash needed
- —
Loan-product check · same deal, 3 products live
Conventional
25% down · 7.5% · 30yr
- Down + closing
- —
- Monthly P&I
- —
- Monthly cashflow
- —
- DSCR
- —
- Eligible?
- —
Personal DTI + credit; lowest rate.
DSCR
20% down · 8.5% · 30yr
- Down + closing
- —
- Monthly P&I
- —
- Monthly cashflow
- —
- DSCR
- —
- Eligible?
- —
No personal income docs; deal must DSCR.
Hard money
10% down · 12.0% · 12mo
- Down + closing
- —
- Monthly P&I
- —
- Monthly cashflow
- —
- DSCR
- —
- Eligible?
- —
Short-term bridge; refi at stabilization.
Rent comps 20 comps
| Address | Beds | Baths | Sqft | Rent | $/sqft | DOM | Units | Dist |
|---|---|---|---|---|---|---|---|---|
| 3118 Chelsea Ave Kansas City, MO | 2.0 | 1.0 | 864 | $980 | $1.13 | 43d | 1 | 0.41mi |
| 2447 Norton Ave Kansas City, MO | 2.0 | 1.0 | 800 | $976 | $1.22 | 16d | 1 | 0.51mi |
| 2855 Van Brunt Blvd Unit A Kansas City, MO | 2.0 | 1.0 | 744 | $1,080 | $1.45 | 43d | 1 | 0.54mi |
| 3243 Denver Dr Kansas City, MO | 1.0–3.0 | 1.0 | 862 | $950 | $1.10 | 43d | 1 | 0.69mi |
| 3437 Jackson Ave Kansas City, MO | 2.0 | 1.0 | 700 | $1,150 | $1.64 | 16d | 1 | 0.83mi |
| 2225 Askew Ave Kansas City, MO | 2.0 | 1.0 | 864 | $1,050 | $1.22 | 43d | 1 | 0.90mi |
| 2213 Askew Ave Kansas City, MO | 2.0 | 1.0 | 865 | $1,002 | $1.16 | 19d | 1 | 0.92mi |
| 2413 College Ave Kansas City, MO | 2.0 | 2.0 | 1022 | $1,225 | $1.20 | 23d | 1 | 0.95mi |
| 2701 Benton Blvd Unit 2703-2 Kansas City, MO | 2.0 | 1.0 | 800 | $1,200 | $1.50 | 1d | 1 | 1.02mi |
| 2701 Benton Blvd Unit 2705-3 Kansas City, MO | 2.0 | 1.0 | 800 | $1,200 | $1.50 | 7d | 1 | 1.02mi |
| 2637 E 29th St Unit 3 Kansas City, MO | 2.0 | 1.0 | 954 | $1,050 | $1.10 | 43d | 1 | 1.13mi |
| 2454 Benton Blvd Unit 2456-1 Kansas City, MO | 1.0 | 1.0 | 750 | $1,000 | $1.33 | 17d | 1 | 1.13mi |
| 2454 Benton Blvd Unit 2460-3 Kansas City, MO | 1.0 | 1.0 | 750 | $1,100 | $1.47 | 17d | 1 | 1.13mi |
| 2454 Benton Blvd Unit 2458-2 Kansas City, MO | 1.0 | 1.0 | 750 | $1,000 | $1.33 | 7d | 1 | 1.13mi |
| 1603 Elmwood Ave Kansas City, MO | 2.0 | 1.0 | 1064 | $1,031 | $0.97 | 12d | 1 | 1.27mi |
| 3201 E 20th St Kansas City, MO | 2.0 | 1.0 | 900 | $1,050 | $1.17 | 23d | 1 | 1.27mi |
| 4902 E 39th St Kansas City, MO | 2.0 | 1.0 | 820 | $1,300 | $1.59 | 16d | 1 | 1.27mi |
| 1616 Hardesty Ave Unit 1-108 Kansas City, MO | 1.0 | 1.0 | 634 | $1,150 | $1.81 | 21d | 1 | 1.39mi |
| 3233 Park Ave Unit 2 Kansas City, MO | 2.0 | 1.0 | 950 | $1,000 | $1.05 | 23d | 1 | 1.49mi |
| 3233 Park Ave Unit 1 Kansas City, MO | 2.0 | 1.0 | 950 | $1,075 | $1.13 | 43d | 1 | 1.49mi |
Listing history 15 events
-
2026-05-03status Pending 678-char remark
-
2026-05-01$120,000 Active 678-char remark
-
2026-04-26historical $120,000 678-char remark
-
2025-05-21historical
-
2025-05-05price $119,000
-
2025-02-18$128,000 Active
-
2024-04-05historical
-
2024-02-14price $128,500
-
2023-11-13$129,500 Active
-
2023-09-20soldstatus
-
2023-09-19soldstatus Closed
-
2023-09-03status Pending
-
2023-08-30$55,000 Active
-
2013-04-17soldstatus $1,439
-
1982-04-01soldstatus
ⓘ Source: listings_history table (triggers on properties + properties_extension) + one-shot
backfill from property_details.listing_events for pre-trigger history.
Tax reassessment forecast MO · Resets to sale price
- Current annual tax
- $1,032 · $86/mo
- Projected year-2 tax
- $1,164 · $97/mo
- Expected delta
- +$132/yr (+$11/mo · 12.8%)
ⓘ Screening estimate from a state-policy table — verify with the county assessor before closing.
Climate risk First Street
- Flood 1/10 Low FEMA zone X (unshaded) · 0% chance over 30 yrs
- Wildfire 1/10 Low
- Heat 4/10 Moderate 7 d/yr ≥106°F today · 17 d/yr by 30 yrs out
- Wind 2/10 Low
- Air quality 3/10 Moderate 2 unhealthy d/yr today · 3 by 30 yrs out
Nearby sold comps map
Loading sold comps map…
Walkable amenities ~0.75 mi
Loading nearby amenities…
Taxation est. · year 1
- Rental income
- $12,636
- − Mortgage interest
- −$6,722
- − Property taxes
- −$1,032
- − Insurance
- −$600
- − Repairs & maintenance
- −$1,011
- − Management
- −$1,011
- − Depreciation
- −$3,491
- Taxable loss
- −$1,230
- Est. tax savings @ 24.0%
- +$295
- After-tax cash flow
- $1,095/yr
For passive investors: Depreciation is non-cash, so a rental often shows a tax loss while cash-flowing — sheltering income. Rental losses are passive: they offset passive income freely, and up to $25,000/yr can offset ordinary (W-2) income if you actively participate and your MAGI is under $100k (phasing out to $0 by $150k); unused losses carry forward. On sale, claimed depreciation is recaptured at up to 25%, and gains may owe capital-gains tax (a 1031 exchange can defer both). Figures are a year-1 estimate at your 24.0% rate — not tax advice; consult a CPA.
Schools (NCES district)
- District
- Kansas City 33
- NCES district ID
- 2916400
- Math proficiency
- 12% ▼ -8.00%
- Reading proficiency
- 24% ▬ 0.00%
- Median HH income
- $35,227
- Composite
- 14.8/100
- National rank
- #9387
- State rank
- #308 of 324 in MO
Livability — Kansas City
- Score
- 78/100
- State rank
- #28
- US rank
- #2671
Category grades
Schools grade is shown separately in the Schools card above.
Census & demographics
- Census place
- Kansas City, MO
- County
- Jackson County · 687,798 people
- City population
- 439,467
- Metro
- Kansas City, MO-KS
- Population (ZIP)
- 11,912
- Household income
- $36,088
- Rent vs Own
- Severe rent burden
- 946.0
Population outlook (Jackson County) Hauer SSP2
- Today (2025)
- 719,589 people
- By 2030
- 731,456 · +1.6%
- By 2040
- 746,689 · +3.8%
- By 2050
- 749,289 · +4.1%
- By 2075
- 736,227 · +2.3%
- By 2100
- 668,210 · -7.1%
Race, ethnicity, and origin ACS 2023
- Neighborhood character
- Predominantly Black (79%)
- Race & ethnicity
- Black 79% Hispanic / Latino 9% White 8% Two or more races 7%
- Hispanic origin (detail)
- Mexican 6%
- Common ancestry
- Swedish 1% Hispanic 1%
- Foreign-born
- 7% · Canada
- Languages at home
- 88% English-only · Spanish 7% French/Haitian/Cajun 2%
Political lean MEDSL · Jackson
- 2024 margin
- D (+19.3) · D 58.9% · R 39.5% · Other 1.6%
- 2008→2024 swing
- -6.1pp toward R · 2008: 25.4pp · 2024: 19.3pp
- All cycles
- 2024: D+19.3 2020: D+22.0 2016: D+16.6 2012: D+19.0 2008: D+25.4
Not yet ingested
- Civics
- —
Market trends
- HPI YoY
- ▲ 73.41%
- Current HPI
- 412.6862
- Rent YoY
- ▲ 4.65%
- Metro
- Kansas City, MO-KS
- State GDP YoY
- ▲ 1.84%
- F500 in state
- 20
Industry mix (Fortune 500 HQ in MO)
| Industry | F500 HQs | Revenue |
|---|---|---|
| Healthcare | 1 | $163B |
|
||
| Insurance | 1 | $21B |
|
||
| Industrial Technology | 1 | $17B |
|
||
| Retail | 1 | $16B |
|
||
| Industrial Distribution | 1 | $10B |
|
||
| Utilities | 1 | $9B |
|
||
Price history
+8239.1% since first listed16 events — show timeline
- 2026-05-29 Sold (MLS) — Heartland MLS as Distributed by MLS Grid
- 2026-05-03 Pending — Heartland MLS as Distributed by MLS Grid
- 2026-05-01 Listed $120,000 Heartland MLS as Distributed by MLS Grid
- 2026-04-26 Coming Soon $120,000 Heartland MLS as Distributed by MLS Grid
- 2025-05-21 Listing Removed — Heartland MLS as Distributed by MLS Grid
- 2025-05-05 Price Changed $119,000 Heartland MLS as Distributed by MLS Grid
- 2025-02-18 Listed $128,000 Heartland MLS as Distributed by MLS Grid
- 2024-04-05 Listing Removed — Heartland MLS as Distributed by MLS Grid
- 2024-02-14 Price Changed $128,500 Heartland MLS as Distributed by MLS Grid
- 2023-11-13 Listed $129,500 Heartland MLS as Distributed by MLS Grid
- 2023-09-20 Sold (Public Records) — Public Records
- 2023-09-19 Sold (MLS) — Heartland MLS as Distributed by MLS Grid
- 2023-09-03 Pending — Heartland MLS as Distributed by MLS Grid
- 2023-08-30 Listed $55,000 Heartland MLS as Distributed by MLS Grid
- 2013-04-17 Sold (Public Records) $1,439 Public Records
- 1982-04-01 Sold (Public Records) — Public Records
Property tax history
+39.3%/yrLatest (2025): $1,032 · +87.6% YoY. Source: county tax records.
Cash-flow waterfall
monthlySold comps — $/sqft
last 12 mo · ≤1 miLoading sold comps…