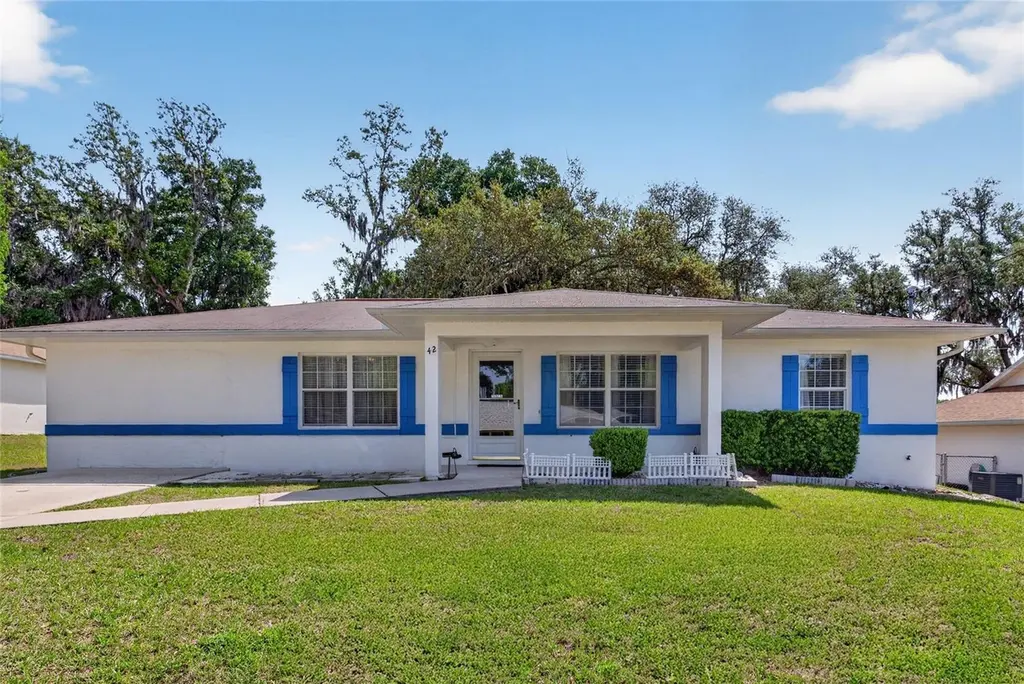
42 Larch Radl · Belleview, FL
Flood risk 1/10 · Minimal
- FEMA flood zone
- X (unshaded)
- Chance of flooding over 30 yrs
- 0.0%
- Est. flood insurance / yr
- $507 – $1,088
Fire risk 5/10 · Moderate
- Est. fire insurance / yr
- $947 – $1,759
Heat risk 8/10 · Major
- Hot days now (above 108°F)
- 7 days/yr
- Hot days in 30 yrs
- 20 days/yr
Wind risk 9/10 · Severe
- Chance of severe wind over 30 yrs
- 99.0%
Air-quality risk 3/10 · Minor
- Unhealthy air days now
- 3 days/yr
- Unhealthy air days in 30 yrs
- 4 days/yr
Risk factors via First Street. Map © Google.
Why this score? — see what drove the D+ grade
The composite is a weighted blend of 9 inputs, each scored 0–100. Each bar is that input's sub-score; the figure is the points it added to the 100-point composite (weight × sub-score).
- ARV discount +14.0/15.0
- Cash flow +12.7/30.0
- DSCR +3.8/10.0
- Schools +3.6/10.0
- Livability +3.5/5.0
- Rent growth +3.2/5.0
- Condition / age +2.5/5.0
- 1% rule +2.4/10.0
- Appreciation +0.0/10.0
$230,000
🖨 Deal sheet (PDF) 📄 Offer letter ✓ Due diligence
Listing remarks
Welcome to this beautifully maintained home nestled in the peaceful community of Silver Springs Shores. From the moment you arrive, you'll appreciate the pride of ownership reflected throughout this exceptionally clean and well-kept residence. Inside, the home offers a bright and inviting atmosphere with comfortable living spaces perfect for both relaxing and entertaining. Every detail has been thoughtfully cared for, creating a move-in ready experience for its next owner. Situated in a quiet and established neighborhood, you'll enjoy a sense of privacy while still being conveniently close to local shopping, dining and everyday amenities. Whether you are looking for a primary residence or a
Key facts
- 0.23 acre lot
- Garage
- Built 1998
Property features AI
Finance
- Other: Residential zoning (R1); Living area about 1,470 sq ft (public records); Building area about 1,704 sq ft
- HOA & community: No HOA/association indicated
Exterior
- Parking: Attached garage (1 car)
- Utilities: Well water; Septic tank; Cable available and connected; Electricity available; Water available
- Home design: Single family residence; One story; Faces west; Homestead property
- Construction: Block, concrete and stucco construction; Shingle roof; Slab foundation; Built on lot approximately 80 x 125 (0.23 acre)
- Exterior features: Sliding doors; Asphalt road frontage
Interior
- Kitchen: Convection oven; Dishwasher; Microwave; Refrigerator
- Bedrooms: 3 bedrooms
- Flooring: Carpet; Laminate
- Bathrooms: 2 full bathrooms
- Heating & cooling: Central heating (electric); Central air conditioning
- Interior features: Ceiling fans; Split bedroom floorplan
- Laundry & utility: Laundry room; Washer; Dryer
Neighborhood map
What this means for you Summary
Snapshot
- This is a 3-bed/2.0-bath single-family listed at $230k.
Deal economics
- At list price, monthly cash flow is $-27 ($-321/yr) — negative.
- To cash-flow at today's rent, offer at most $225k (2.1% below list).
- To meet the 1% rule (rent ≥ 1% of price), the offer needs to be $171k (25.6% below list).
- Recommended offer: $171k (25.6% below list) — sets the bar for 1% rule.
- Cap rate 6.2% vs local median 4.5% in Belleview — top-decile yield for the area; either an underpriced asset or a hidden risk that comps aren't pricing in. Stress-test before assuming the spread holds.
Location & tenants
- Location reads 69/100 on livability (#458 in FL) — a middle-class / working-renter tenant base. Strengths: cost of living A+, housing A+, health & safety A+; Watch: crime F, amenities F, commute F.
- Marion (rural): math 42% / reading 43% proficiency, ranked #61 of 73 in FL (top 84%) — families likely to look elsewhere, expect single-tenant / working-renter base with shorter leases; 61% free/reduced lunch — lower-income household profile, screen leases tightly.
- Zoned schools: Legacy Elementary School (math 35% / reading 35%, grade F, #1,697 of 2,144 statewide, top 80%, 716 students, 72% FRL); Belleview High School (math 31% / reading 46%, grade F, #321 of 667 statewide, top 49%, 1,783 students, 56% FRL) — zoned schools at 64% FRL track the district average.
- Market conditions: Rents rising (+2.8%/yr); 344 active listings in the ZIP; 18 comparable units currently listed for rent nearby; rentals at typical pace (median 15d on market — plan ~3-4 weeks tenant-placement turnaround); solid renter incomes; 7,071 units permitted in Marion County in 2024 (534 in 5+ unit buildings).
Forward outlook
- Local home prices are declining (-3.0%/yr); year-one equity from $2k of loan paydown is wiped out by about $7k of value loss. Plan a longer hold.
- Marion County population projected at +13% by 2050 — modest demand growth; plan on rents tracking national, not racing it.
Negotiation context
- It's been on market 20 days — a 2% lower offer ($227k) is reasonable based on typical stale-listing flexibility.
- 4 sale attempts since 23y ago; this cycle's ask has dropped $15k (6%) from the opening price — seller is motivated, your offer sets the floor, not the list.
- Current owner paid $88k; list at $230k implies a 162% gain — meaningful room to come down on a strong offer.
Risks & watch-outs
- Climate carrying-cost: severe wind risk, 99% chance of damaging wind over 30y; moderate wildfire risk; extreme-heat days projected 7→20/yr by 2055 (HVAC capex compounding) — expect insurance premiums to compound above CPI over the hold.
Questions for the listing agent
- What do current leases actually rent for vs. the listed asking? Can we see a recent rent roll and the last 12 months of T-12 income?
- Is there a deadline driving the sale (1031 exchange, divorce, estate, relocation)? That informs how much negotiation room exists.
- Schools are D-rated, which usually means shorter tenancies and higher turnover. Who's the typical renter profile here, and what's been the actual vacancy rate?
- Crime grade is F in this area — have there been break-ins, vandalism, or insurance claims at this property in the last 3 years? What carrier currently insures it and at what premium?
- The area grade is low — what's the realistic commute time and amenity access for the typical tenant pool here? Any planned neighborhood developments (good or bad) we should know about?
- What's the average days-on-market for RENTAL listings here right now (not sales)? A rising rental-DOM trend means longer vacancies and softer asking-rent achievability than the comps imply.
- What's the recent tenant-quality profile in this submarket — average credit score on applications, eviction rate, late-payment / NSF rate, and stable-employment percentage? A property-management company in the area should have these aggregated.
- How much new for-sale + rental construction is in the pipeline within 1–3 miles? Heavy new supply typically softens prices + rents 12–24 months out; constrained supply supports both.
Investment metrics
- 1% rule
- 0.74% ✗
- Cap rate
- 6.15%
- Cash-on-cash
- -0.50%
- DSCR
- 0.98
- GRM
- 11.2
CMA / ARV
- ARV (on-the-fly)
- $269,010
- Comps found
- 12
Show comp detail 12 sales within ~0.75 mi
| Address | Dist | Beds/Ba | Sqft | Sold | Price | $/sf | Match |
|---|---|---|---|---|---|---|---|
| 18 Larch Radl | 0.16mi | 3/2.0 | 1,451 (-1%) | 12mo | $272,000 | $187 | 80 |
| 8821 Juniper Rd | 0.29mi | 3/2.0 | 1,378 (-6%) | 7mo | $238,000 | $173 | 70 |
| 14 Juniper Track Dr | 0.43mi | 3/2.0 | 1,508 (+3%) | 7mo | $218,000 | $145 | 70 |
| 36 Juniper Pass Ln | 0.30mi | 3/2.0 | 1,325 (-10%) | 6mo | $170,000 | $128 | 64 |
| 12 Juniper Pass Dr | 0.41mi | 3/2.0 | 1,463 (-0%) | 20mo | $230,000 | $157 | 63 |
| 4955 SE 89th Place Rd | 0.46mi | 3/2.0 | 1,537 (+5%) | 11mo | $288,000 | $187 | 62 |
| 5349 SE 91st Pl | 0.46mi | 3/2.0 | 1,545 (+5%) | 17mo | $290,000 | $188 | 56 |
| 5434 SE 91st St | 0.41mi | 3/2.0 | 1,670 (+14%) | 4mo | $305,000 | $183 | 55 |
| 68 Juniper Trl | 0.27mi | 3/2.0 | 1,289 (-12%) | 22mo | $242,000 | $188 | 49 |
| 12 Juniper Pass Trl | 0.38mi | 3/2.0 | 1,611 (+10%) | 22mo | $236,000 | $146 | 48 |
| 15 Juniper Trail Ln SE | 0.70mi | 3/2.0 | 1,532 (+4%) | 19mo | $302,000 | $197 | 45 |
| 124 Juniper Trl | 0.69mi | 3/2.0 | 1,362 (-7%) | 24mo | $240,000 | $176 | 36 |
Match score weights: distance 35% · size 25% · config 20% · recency 20%. Top-matched comps best support the ARV.
Projected returns pro-forma
-3.0% appreciation · 2.84% rent growth · sell at horizon
- IRR
- -17.3%
- Equity multiple
- 0.39×
- Total profit
- $-39,354
- Equity at exit
- $34,294
- IRR
- -9.7%
- Equity multiple
- 0.41×
- Total profit
- $-38,011
- Equity at exit
- $19,886
Cash invested: $64,400 (down + closing). Projections, not guarantees.
Landlord ↔ Tenant lean methodology
- Overall (STATE)
- 87 Strongly Landlord-Friendly
- State Florida
- 87 Strongly Landlord-Friendly · R+3
- County
- — inherits STATE
- City
- — inherits STATE
ZIP-level market 34480
- Home prices YoY
- -28.7%
- Rents YoY
- 2.8%
- Active inventory
- 344
- Price-to-rent
- 11.2×
Monthly cashflow live
- Estimated rent
- $1,711 high interval (Pro) →
- Mortgage (P&I)
- −$1,206
- Tax from tax record
- −$76 /mo · $915/yr
- Insurance
- −$96
- HOA
- −$0
- Vacancy / Maint / Mgmt
- −$359
- Net cashflow
- $-27
Break-even live
Sensitivity live
| Price | -10% $103 | -5% $38 | +0% $-27 | +5% $-92 | +10% $-157 |
|---|---|---|---|---|---|
| Rent | -10% $-162 | -5% $-94 | +0% $-27 | +5% $41 | +10% $108 |
| Rate | -1.0pp $89 | -0.5pp $32 | base $-27 | +0.5pp $-86 | +1.0pp $-147 |
UW: 25.0% down · 7.5% · 30yr · 1.5% tax · 5.0% vac · 8.0% maint · 8.0% mgmt
Financing live
Cash to close
- Down payment
- $57,500
- Closing costs
- $6,900
- Reserves months
- —
- Total cash needed
- —
Loan-product check · same deal, 3 products live
Conventional
25% down · 7.5% · 30yr
- Down + closing
- —
- Monthly P&I
- —
- Monthly cashflow
- —
- DSCR
- —
- Eligible?
- —
Personal DTI + credit; lowest rate.
DSCR
20% down · 8.5% · 30yr
- Down + closing
- —
- Monthly P&I
- —
- Monthly cashflow
- —
- DSCR
- —
- Eligible?
- —
No personal income docs; deal must DSCR.
Hard money
10% down · 12.0% · 12mo
- Down + closing
- —
- Monthly P&I
- —
- Monthly cashflow
- —
- DSCR
- —
- Eligible?
- —
Short-term bridge; refi at stabilization.
Rent comps 18 comps
| Address | Beds | Baths | Sqft | Rent | $/sqft | DOM | Units | Dist |
|---|---|---|---|---|---|---|---|---|
| 18 Juniper Trl Ocala, FL | 3.0 | 2.0 | 1270 | $1,750 | $1.38 | 14d | 1 | 0.24mi |
| 338 Larch Rd Ocala, FL | 3.0 | 2.0 | 1394 | $1,595 | $1.14 | 22d | 1 | 0.25mi |
| 10 Juniper Trl Ocala, FL | 4.0 | 2.0 | 1617 | $1,875 | $1.16 | 14d | 1 | 0.29mi |
| 7 Juniper Pass Way Ocala, FL | 3.0 | 2.0 | 1453 | $1,750 | $1.20 | 22d | 1 | 0.33mi |
| 15 Juniper Pass Ln Ocala, FL | 4.0 | 2.0 | 1608 | $1,900 | $1.18 | 14d | 1 | 0.39mi |
| 5494 SE 91st St Ocala, FL | 4.0 | 2.0 | 1858 | $2,200 | $1.18 | 14d | 1 | 0.43mi |
| 57 Juniper Pass Ocala, FL | 2.0 | 2.0 | 974 | $1,200 | $1.23 | 14d | 1 | 0.59mi |
| 50 Walnut Run Ocala, FL | 3.0 | 2.0 | 1287 | $1,795 | $1.39 | 14d | 1 | 0.77mi |
| 47 Walnut Run Ocala, FL | 2.0 | 2.0 | 974 | $1,235 | $1.27 | 14d | 1 | 0.82mi |
| 28 Poplar Run Ocala, FL | 3.0 | 2.0 | 1473 | $1,650 | $1.12 | 14d | 1 | 0.84mi |
| 52 Walnut Rd Ocala, FL | 2.0 | 2.0 | 969 | $1,175 | $1.21 | 14d | 1 | 0.88mi |
| 28 Juniper Dr Ocala, FL | 3.0 | 2.0 | 1453 | $1,650 | $1.14 | 22d | 1 | 0.89mi |
| 60 Walnut Rd Ocala, FL | 2.0 | 2.0 | 969 | $1,200 | $1.24 | 22d | 1 | 0.91mi |
| 31 Walnut Run Ocala, FL | 2.0 | 2.0 | 974 | $1,200 | $1.23 | 14d | 1 | 0.93mi |
| 123 Juniper Loop Ocala, FL | 3.0 | 2.0 | 1445 | $1,695 | $1.17 | 22d | 1 | 0.95mi |
| 66 Laurel Pass Ocala, FL | 2.0 | 2.0 | 974 | $1,175 | $1.21 | 22d | 1 | 1.44mi |
| 58 Laurel Pass Ocala, FL | 2.0 | 2.0 | 1000 | $1,200 | $1.20 | 22d | 1 | 1.47mi |
| 54 Laurel Pass Ocala, FL | 2.0 | 2.0 | 1000 | $1,200 | $1.20 | 22d | 1 | 1.49mi |
Listing history 23 events
-
2026-06-18days on market $230,000 Active 20 DOM
-
2026-06-17days on market $230,000 Active 19 DOM
-
2026-06-16days on market $230,000 Active 18 DOM
-
2026-06-15days on market $230,000 Active 17 DOM
-
2026-06-14days on market $230,000 Active 15 DOM
-
2026-06-13pricedays on market $230,000 Active 14 DOM
-
2026-06-10days on market $244,900 Active 12 DOM
-
2026-06-09days on market $244,900 Active 11 DOM
-
2026-06-08days on market $244,900 Active 10 DOM
-
2026-06-07days on market $244,900 Active 9 DOM
-
2026-06-03days on market $244,900 Active 5 DOM
-
2026-06-02days on market $244,900 Active 4 DOM
-
2026-06-01days on market $244,900 Active 3 DOM
-
2026-05-31days on market $244,900 Active 2 DOM
-
2026-04-22$244,900 Active
-
2007-03-08historical
-
2006-03-08$159,900
-
2004-02-22historical
-
2003-12-18soldstatus $87,900
-
2003-12-12soldstatus $87,900
-
2003-09-18$87,900
-
2003-08-22$91,000
-
2002-02-04soldstatus $9,000
ⓘ Source: listings_history table (triggers on properties + properties_extension) + one-shot
backfill from property_details.listing_events for pre-trigger history.
Tax reassessment forecast FL · Resets to sale price
- Current annual tax
- $915 · $76/mo
- Projected year-2 tax
- $1,909 · $159/mo
- Expected delta
- +$994/yr (+$83/mo · 108.5%)
ⓘ Screening estimate from a state-policy table — verify with the county assessor before closing.
Climate risk First Street
- Flood 1/10 Low FEMA zone X (unshaded) · 0% chance over 30 yrs
- Wildfire 5/10 Major
- Heat 8/10 Severe 7 d/yr ≥108°F today · 20 d/yr by 30 yrs out
- Wind 9/10 Extreme 99% chance of damaging wind over 30 yrs
- Air quality 3/10 Moderate 3 unhealthy d/yr today · 4 by 30 yrs out
Nearby sold comps map
Loading sold comps map…
Walkable amenities ~0.75 mi
Loading nearby amenities…
Taxation est. · year 1
- Rental income
- $20,529
- − Mortgage interest
- −$12,884
- − Property taxes
- −$915
- − Insurance
- −$1,150
- − Repairs & maintenance
- −$1,642
- − Management
- −$1,642
- − Depreciation
- −$6,691
- Taxable loss
- −$4,396
- Est. tax savings @ 24.0%
- +$1,055
- After-tax cash flow
- $734/yr
For passive investors: Depreciation is non-cash, so a rental often shows a tax loss while cash-flowing — sheltering income. Rental losses are passive: they offset passive income freely, and up to $25,000/yr can offset ordinary (W-2) income if you actively participate and your MAGI is under $100k (phasing out to $0 by $150k); unused losses carry forward. On sale, claimed depreciation is recaptured at up to 25%, and gains may owe capital-gains tax (a 1031 exchange can defer both). Figures are a year-1 estimate at your 24.0% rate — not tax advice; consult a CPA.
Schools (NCES district)
- District
- Marion
- NCES district ID
- 1201260
- Math proficiency
- 42% ▼ -7.00%
- Reading proficiency
- 43% ▼ -4.00%
- Median HH income
- $40,015
- Composite
- 35.61/100
- National rank
- #4890
- State rank
- #61 of 73 in FL
Livability — Belleview
- Score
- 69/100
- State rank
- #458
- US rank
- #8314
Category grades
Schools grade is shown separately in the Schools card above.
Census & demographics
- County
- Marion County · 315,796 people
- City population
- 19,167
- Metro
- Ocala, FL
- Population (ZIP)
- 23,517
- Household income
- $77,557
- Rent vs Own
- Severe rent burden
- 169.0
Population outlook (Marion County) Hauer SSP2
- Today (2025)
- 365,905 people
- By 2030
- 376,768 · +3.0%
- By 2040
- 396,555 · +8.4%
- By 2050
- 412,723 · +12.8%
- By 2075
- 446,090 · +21.9%
- By 2100
- 436,193 · +19.2%
Race, ethnicity, and origin ACS 2023
- Neighborhood character
- Predominantly White (73%)
- Race & ethnicity
- White 73% Hispanic / Latino 15% Two or more races 11% Black 6% Asian 2%
- Hispanic origin (detail)
- Mexican 3% Puerto Rican 5% Cuban 2% Dominican 2%
- Common ancestry
- Italian 3% Slovak 3% Lithuanian 2%
- Foreign-born
- 6% · Canada
- Languages at home
- 89% English-only · Spanish 9% Other Asian/Pacific 1%
Political lean MEDSL · Marion
- 2024 margin
- Solid R (+31.6) · D 33.8% · R 65.5%
- 2008→2024 swing
- -20.0pp toward R · 2008: -11.6pp · 2024: -31.6pp
- All cycles
- 2024: R+31.6 2020: R+25.9 2016: R+26.2 2012: R+16.2 2008: R+11.6
Not yet ingested
- Civics
- —
Market trends
- HPI YoY
- ▼ -85.60%
- Current HPI
- 212.4262
- Rent YoY
- ▲ 2.84%
- Metro
- Ocala, FL
- State GDP YoY
- ▲ 3.28%
- F500 in state
- 36
Industry mix (Fortune 500 HQ in FL)
| Industry | F500 HQs | Revenue |
|---|---|---|
| Industrial Technology | 2 | $29B |
|
||
| Insurance | 2 | $17B |
|
||
| Retail | 1 | $60B |
|
||
| Technology Distribution | 1 | $58B |
|
||
| Homebuilding | 1 | $35B |
|
||
| Technology Manufacturing | 1 | $35B |
|
||
Price history
+2621.1% since first listed9 events — show timeline
- 2026-04-22 Listed $244,900 Stellar MLS as Distributed by MLS Grid
- 2007-03-08 Listing Removed — Stellar MLS as Distributed by MLS Grid
- 2006-03-08 Listed $159,900 Stellar MLS as Distributed by MLS Grid
- 2004-02-22 Listing Removed — Stellar MLS as Distributed by MLS Grid
- 2003-12-18 Sold (Public Records) $87,900 Public Records
- 2003-12-12 Sold (MLS) $87,900 Stellar MLS as Distributed by MLS Grid
- 2003-09-18 Listed $87,900 Stellar MLS as Distributed by MLS Grid
- 2003-08-22 Listed $91,000 Stellar MLS as Distributed by MLS Grid
- 2002-02-04 Sold (Public Records) $9,000 Public Records
Property tax history
+3.0%/yrLatest (2025): $915 · +31.7% YoY. Source: county tax records.
Cash-flow waterfall
monthlySold comps — $/sqft
last 12 mo · ≤1 miLoading sold comps…