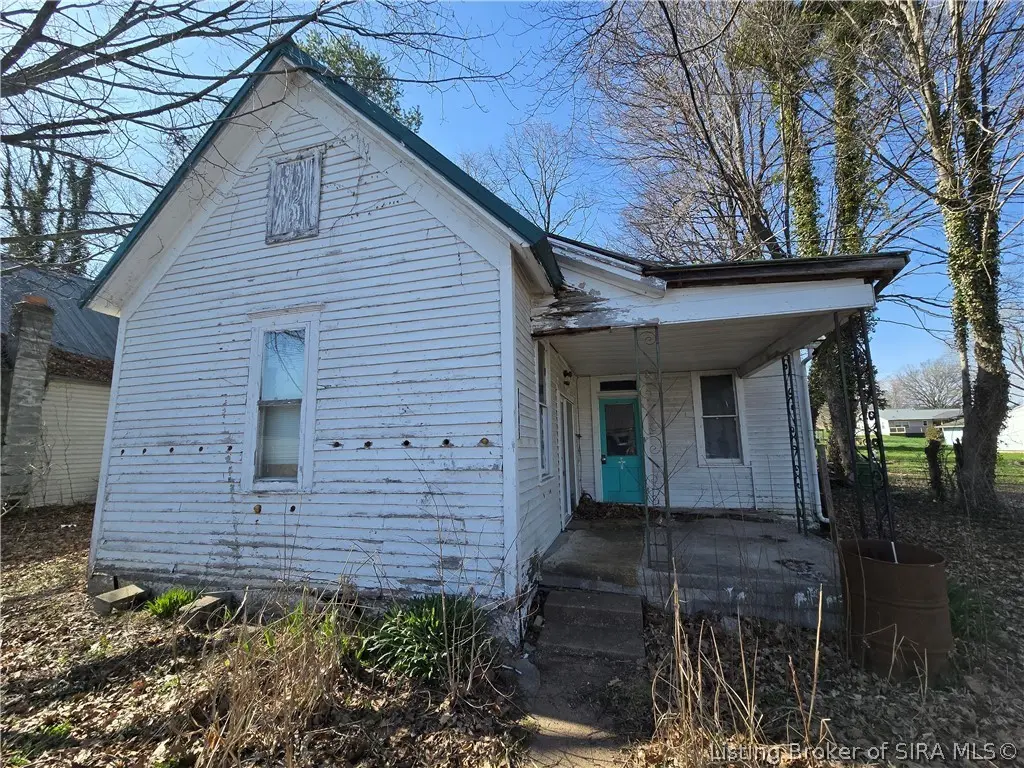
175 S Maple St · Hardinsburg, IN
Flood risk 1/10 · Minimal
- FEMA flood zone
- X (unshaded)
- Chance of flooding over 30 yrs
- 0.0%
- Est. flood insurance / yr
- $473 – $860
Fire risk 1/10 · Minimal
- Est. fire insurance / yr
- $717 – $1,331
Heat risk 5/10 · Moderate
- Hot days now (above 104°F)
- 7 days/yr
- Hot days in 30 yrs
- 20 days/yr
Wind risk 2/10 · Minimal
- Chance of severe wind over 30 yrs
- 3.0%
Air-quality risk 2/10 · Minimal
- Unhealthy air days now
- 0 days/yr
- Unhealthy air days in 30 yrs
- 1 days/yr
Risk factors via First Street. Map © Google.
Why this score? — see what drove the B+ grade
The composite is a weighted blend of 9 inputs, each scored 0–100. Each bar is that input's sub-score; the figure is the points it added to the 100-point composite (weight × sub-score).
- Cash flow +30.0/30.0
- 1% rule +10.0/10.0
- DSCR +10.0/10.0
- ARV discount +7.5/15.0
- Appreciation +6.4/10.0
- Schools +3.5/10.0
- Livability +3.0/5.0
- Rent growth +2.5/5.0
- Condition / age +2.5/5.0
$49,900
🖨 Deal sheet 📄 Offer letter ✓ Due diligence
Listing remarks MLS
CALLING OUT TO INVESTORS. .. .here's one where a lot of demolition has already been done! With 1000 sq ft of living space, this home could easily be renovated into a 3 bedroom home, 1-2 baths, to maximize your investment. Damaged floor has been removed in one room, ready for new joists and completion. New electric panel installed and miscellaneous electric items. Plumbing has been started. There is already metal roof on the home. Whatever new building components/fixtures that haven't been installed will stay! Don't let this one get away.
Key facts
- Metal roof
- Demolition completed
- New electric panel
Tags
Neighborhood map
What this means for you Summary
Snapshot
- This is a 3-bed/2.0-bath single-family listed at $50k.
Deal economics
- At list price, monthly cash flow is $526 ($6k/yr) — positive.
- The deal already cash-flows at list — no discount required.
- Meets the 1% rule at list price ($1k rent vs $50k).
- Recommended offer: $45k (9.0% below list) — sets the bar for market timing.
Location & tenants
- Location reads 60/100 on livability (#535 in IN) — a middle-class / working-renter tenant base. Strengths: cost of living A+, housing A+; Watch: crime C-, health & safety C-, schools F.
- West Washington School Corporation (rural): math 41% / reading 43% proficiency, ranked #125 of 301 in IN (top 42%) — families likely to look elsewhere, expect single-tenant / working-renter base with shorter leases.
- Market conditions: 11 active listings in the ZIP; 25 units permitted in Washington County in 2024 (0 in 5+ unit buildings).
Forward outlook
- In year one you build about $2k of equity ($345 loan paydown + $1k appreciation (2.7% local appreciation)).
- Washington County population projected at -22% by 2050 — secular population decline; favor cash flow + early exit over multi-decade hold.
- At projected returns (2.7% appreciation + 3.0% rent growth), your $14k cash investment doubles in ~2 years — after that, you're playing with house money.
Negotiation context
- It's been on market 94 days — a 9% lower offer ($45k) is reasonable based on typical stale-listing flexibility.
Risks & watch-outs
- Watch-outs: built in 1900 — expect roof / HVAC / electrical / plumbing capex.
- Climate carrying-cost: extreme-heat days projected 7→20/yr by 2055 (HVAC capex compounding) — expect insurance premiums to compound above CPI over the hold.
Questions for the listing agent
- It's been on market 94 days. Have you received any prior offers? Is the seller open to a 9% concession, seller financing, or rate buy-down credit?
- Built in 1900 — when were the roof, HVAC, electrical panel, plumbing, and water heater last replaced?
- Why hasn't it sold? Are there any deal-killer items the seller is aware of (foundation, flood, title, zoning, code violations)?
- Is there a deadline driving the sale (1031 exchange, divorce, estate, relocation)? That informs how much negotiation room exists.
- Schools are F-rated, which usually means shorter tenancies and higher turnover. Who's the typical renter profile here, and what's been the actual vacancy rate?
- What's the average days-on-market for RENTAL listings here right now (not sales)? A rising rental-DOM trend means longer vacancies and softer asking-rent achievability than the comps imply.
- What's the recent tenant-quality profile in this submarket — average credit score on applications, eviction rate, late-payment / NSF rate, and stable-employment percentage? A property-management company in the area should have these aggregated.
- How much new for-sale + rental construction is in the pipeline within 1–3 miles? Heavy new supply typically softens prices + rents 12–24 months out; constrained supply supports both.
Investment metrics
- 1% rule
- 2.19% ✓
- Cap rate
- 18.93%
- Cash-on-cash
- 45.13%
- DSCR
- 3.01
- GRM
- 3.8
CMA / ARV
- ARV (median comp)
- $109,354
- List price
- $49,900
- Delta
- -54.37%
- Verdict
- UNDERPRICED
- Comps
- 4 within 1.0 mi
Show comp detail 3 sales within ~0.75 mi
| Address | Dist | Beds/Ba | Sqft | Sold | Price | $/sf | Match |
|---|---|---|---|---|---|---|---|
| 102 S Lapping Ave | 0.35mi | 3/1.5 | 1,118 (+9%) | 3mo | $107,500 | $96 | 64 |
| 524 E Cooper St | 0.35mi | 3/1.0 | 960 (-6%) | 13mo | $110,000 | $115 | 58 |
| 175 W Us Highway 150 | 0.22mi | 3/1.0 | 884 (-14%) | 12mo | $60,000 | $68 | 53 |
Match score weights: distance 35% · size 25% · config 20% · recency 20%. Top-matched comps best support the ARV.
Projected returns pro-forma
2.73% appreciation · 3.0% rent growth · sell at horizon
- IRR
- 50.1%
- Equity multiple
- 3.78×
- Total profit
- $38,787
- Equity at exit
- $21,686
- IRR
- 50.0%
- Equity multiple
- 7.59×
- Total profit
- $92,082
- Equity at exit
- $32,847
Cash invested: $13,972 (down + closing). Projections, not guarantees.
Landlord ↔ Tenant lean methodology
- Overall (STATE)
- 90 Strongly Landlord-Friendly
- State Indiana
- 90 Strongly Landlord-Friendly · R+11
- County
- — inherits STATE
- City
- — inherits STATE
ZIP-level market 47125
- Home prices YoY
- 1.1%
- Active inventory
- 11
- Price-to-rent
- 3.8×
Monthly cashflow live
- Estimated rent
- $1,093 medium interval (Pro) →
- Mortgage (P&I)
- −$262
- Tax from tax record
- −$55 /mo · $664/yr
- Insurance
- −$21
- HOA
- −$0
- Vacancy / Maint / Mgmt
- −$229
- Net cashflow
- $526
Break-even live
UW: 25.0% down · 7.5% · 30yr · 1.5% tax · 5.0% vac · 8.0% maint · 8.0% mgmt
Financing live
Cash to close
- Down payment
- $12,475
- Closing costs
- $1,497
- Reserves months
- —
- Total cash needed
- —
Loan-product check · same deal, 3 products live
Conventional
25% down · 7.5% · 30yr
- Down + closing
- —
- Monthly P&I
- —
- Monthly cashflow
- —
- DSCR
- —
- Eligible?
- —
Personal DTI + credit; lowest rate.
DSCR
20% down · 8.5% · 30yr
- Down + closing
- —
- Monthly P&I
- —
- Monthly cashflow
- —
- DSCR
- —
- Eligible?
- —
No personal income docs; deal must DSCR.
Hard money
10% down · 12.0% · 12mo
- Down + closing
- —
- Monthly P&I
- —
- Monthly cashflow
- —
- DSCR
- —
- Eligible?
- —
Short-term bridge; refi at stabilization.
Listing history 18 events
-
2026-06-19days on market $49,900 Active 94 DOM
-
2026-06-18days on market $49,900 Active 93 DOM
-
2026-06-17days on market $49,900 Active 92 DOM
-
2026-06-16days on market $49,900 Active 91 DOM
-
2026-06-15days on market $49,900 Active 90 DOM
-
2026-06-14days on market $49,900 Active 88 DOM
-
2026-06-12days on market $49,900 Active 87 DOM
-
2026-06-09days on market $49,900 Active 84 DOM
-
2026-06-08days on market $49,900 Active 83 DOM
-
2026-06-07days on market $49,900 Active 82 DOM
-
2026-06-05days on market $49,900 Active 80 DOM
-
2026-06-03days on market $49,900 Active 78 DOM
-
2026-06-02days on market $49,900 Active 77 DOM
-
2026-06-01days on market $49,900 Active 76 DOM
-
2026-05-31days on market $49,900 Active 75 DOM
-
2026-05-30days on market $49,900 Active 74 DOM
-
2026-05-07price $49,900 546-char remark
Show marketing remark (546 chars)
CALLING OUT TO INVESTORS. .. .here's one where a lot of demolition has already been done! With 1000 sq ft of living space, this home could easily be renovated into a 3 bedroom home, 1-2 baths, to maximize your investment. Damaged floor has been removed in one room, ready for new joists and completion. New electric panel installed and miscellaneous electric items. Plumbing has been started. There is already metal roof on the home. Whatever new building components/fixtures that haven't been installed will stay! Don't let this one get away.
-
2026-03-16$60,000 Active 546-char remark
Show marketing remark (546 chars)
CALLING OUT TO INVESTORS. .. .here's one where a lot of demolition has already been done! With 1000 sq ft of living space, this home could easily be renovated into a 3 bedroom home, 1-2 baths, to maximize your investment. Damaged floor has been removed in one room, ready for new joists and completion. New electric panel installed and miscellaneous electric items. Plumbing has been started. There is already metal roof on the home. Whatever new building components/fixtures that haven't been installed will stay! Don't let this one get away.
ⓘ Source: listings_history table (triggers on properties + properties_extension) + one-shot
backfill from property_details.listing_events for pre-trigger history.
Tax reassessment forecast IN · Partial reset (capped growth)
- Current annual tax
- $664 · $55/mo
- Projected year-2 tax
- $664 · $55/mo
- Expected delta
- $0/yr ($0/mo · 0.0%)
ⓘ Screening estimate from a state-policy table — verify with the county assessor before closing.
Climate risk First Street
- Flood 1/10 Low FEMA zone X (unshaded) · 0% chance over 30 yrs
- Wildfire 1/10 Low
- Heat 5/10 Major 7 d/yr ≥104°F today · 20 d/yr by 30 yrs out
- Wind 2/10 Low 3% chance of damaging wind over 30 yrs
- Air quality 2/10 Low 0 unhealthy d/yr today · 1 by 30 yrs out
Nearby sold comps map
Loading sold comps map…
Walkable amenities ~0.75 mi
Loading nearby amenities…
Taxation est. · year 1
- Rental income
- $13,114
- − Mortgage interest
- −$2,795
- − Property taxes
- −$664
- − Insurance
- −$250
- − Repairs & maintenance
- −$1,049
- − Management
- −$1,049
- − Depreciation
- −$1,452
- Taxable income
- $5,855
- Est. tax owed @ 24.0%
- −$1,405
- After-tax cash flow
- $4,901/yr
For passive investors: Depreciation is non-cash, so a rental often shows a tax loss while cash-flowing — sheltering income. Rental losses are passive: they offset passive income freely, and up to $25,000/yr can offset ordinary (W-2) income if you actively participate and your MAGI is under $100k (phasing out to $0 by $150k); unused losses carry forward. On sale, claimed depreciation is recaptured at up to 25%, and gains may owe capital-gains tax (a 1031 exchange can defer both). Figures are a year-1 estimate at your 24.0% rate — not tax advice; consult a CPA.
Schools (NCES district)
- District
- West Washington School Corporation
- NCES district ID
- 1812930
- Math proficiency
- 41% ▼ -15.00%
- Reading proficiency
- 43% ▼ -15.00%
- Median HH income
- $42,006
- Composite
- 35.39/100
- National rank
- #4949
- State rank
- #125 of 301 in IN
Livability — Hardinsburg
- Score
- 60/100
- State rank
- #535
- US rank
- #19242
Category grades
Schools grade is shown separately in the Schools card above.
Census & demographics
- Census place
- Hardinsburg, IN
- Population (ZIP)
- 1,684
Population outlook (Washington County) Hauer SSP2
- Today (2025)
- 26,460 people
- By 2030
- 25,498 · -3.6%
- By 2040
- 23,127 · -12.6%
- By 2050
- 20,505 · -22.5%
- By 2075
- 14,941 · -43.5%
- By 2100
- 10,453 · -60.5%
Race, ethnicity, and origin ACS 2023
- Neighborhood character
- Predominantly White (98%)
- Race & ethnicity
- White 98% Two or more races 2%
- Common ancestry
- Lithuanian 3% Slovak 3% Romanian 2%
- Foreign-born
- 0%
- Languages at home
- 88% English-only · German/W. Germanic 11% Spanish 1%
Political lean MEDSL · Washington
- 2024 margin
- Solid R (+54.8) · D 21.7% · R 76.5% · Other 1.7%
- 2008→2024 swing
- -37.5pp toward R · 2008: -17.3pp · 2024: -54.8pp
- All cycles
- 2024: R+54.8 2020: R+52.1 2016: R+49.1 2012: R+24.4 2008: R+17.3
Not yet ingested
- Civics
- —
Market trends
- HPI YoY
- ▲ 2.73%
- Current HPI
- 239.9813
- Rent YoY
- —
- Metro
- —
- State GDP YoY
- ▲ 2.90%
- F500 in state
- 18
Industry mix (Fortune 500 HQ in IN)
| Industry | F500 HQs | Revenue |
|---|---|---|
| Industrial Machinery | 2 | $37B |
|
||
| Healthcare | 1 | $177B |
|
||
| Pharmaceuticals | 1 | $45B |
|
||
| Metals / Steel | 1 | $18B |
|
||
| Agriculture | 1 | $17B |
|
||
| Packaging | 1 | $12B |
|
||
Price history
-16.8% since first listed2 events — show timeline
- 2026-05-07 Price Changed $49,900 SIRA
- 2026-03-16 Listed $60,000 SIRA
Property tax history
+19.3%/yrLatest (2024): $664 · +1.5% YoY. Source: county tax records.
Cash-flow waterfall
monthlySold comps — $/sqft
last 12 mo · ≤1 miLoading sold comps…