 Duplex
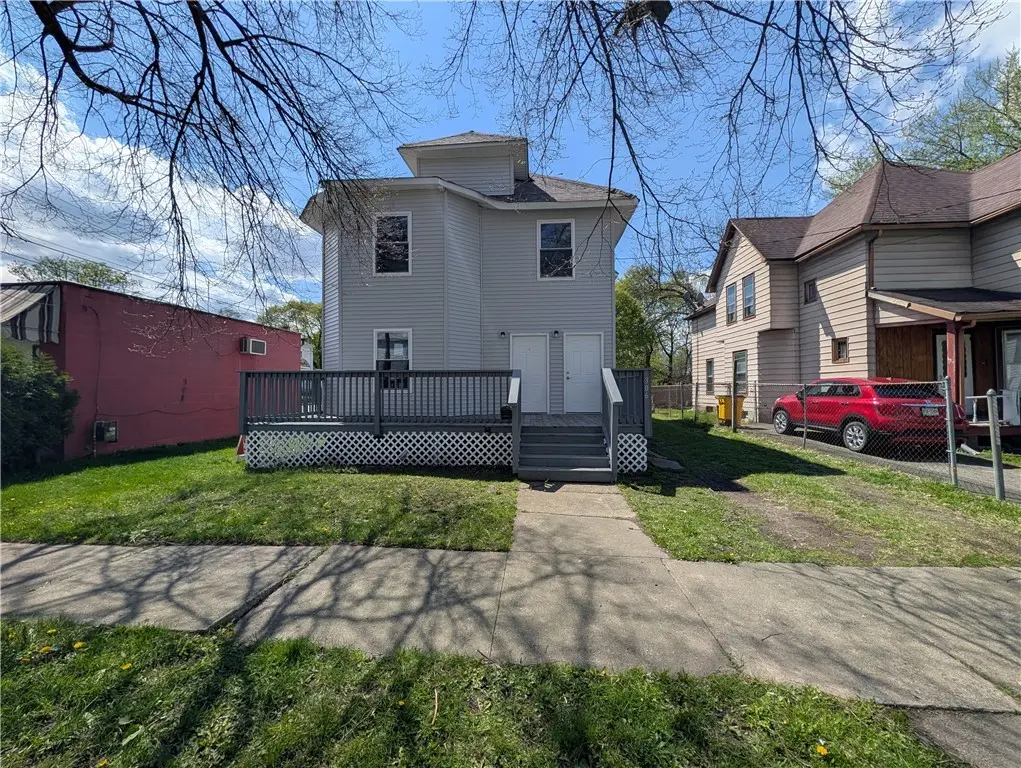
306 Fulton St · Elmira, NY
Flood risk 6/10 · Moderate
- FEMA flood zone
- X (shaded)
- Chance of flooding over 30 yrs
- 0.49%
- Est. flood insurance / yr
- $473 – $860
Fire risk 1/10 · Minimal
- Est. fire insurance / yr
- $691 – $1,283
Heat risk 3/10 · Minor
- Hot days now (above 97°F)
- 7 days/yr
- Hot days in 30 yrs
- 16 days/yr
Wind risk 2/10 · Minimal
- Chance of severe wind over 30 yrs
- 1.0%
Air-quality risk 1/10 · Minimal
- Unhealthy air days now
- 0 days/yr
- Unhealthy air days in 30 yrs
- 0 days/yr
Risk factors via First Street. Map © Google.
Why this score? — see what drove the B- grade
The composite is a weighted blend of 9 inputs, each scored 0–100. Each bar is that input's sub-score; the figure is the points it added to the 100-point composite (weight × sub-score).
- Cash flow +30.0/30.0
- 1% rule +10.0/10.0
- DSCR +10.0/10.0
- ARV discount +7.5/15.0
- Livability +3.1/5.0
- Rent growth +2.5/5.0
- Condition / age +2.5/5.0
- Schools +2.4/10.0
- Appreciation +0.0/10.0
$184,000
🖨 Deal sheet (PDF) 📄 Offer letter ✓ Due diligence
Multi-family units
County records classify this as Multi-Family (2-4 Unit). Listing-text estimate: 2 units. confirmed
Listing remarks
Investors and house-hackers, look no further! This stunning, fully renovated duplex at 306 Fulton St offers a rare, completely turnkey opportunity in Elmira. No detail was overlooked in this top-to-bottom transformation, featuring brand-new flooring, fresh paint, and modern finishes throughout both units. This spacious 2,270 sq. ft. property offers a flexible 6-bedroom, 2-bathroom layout, making it ideal for high-yield rental income or owner-occupancy. Situated on a quiet street in Southwest Elmira, you’ll enjoy low-maintenance living with municipal water and sewer connections. Everything has been changed—just bring your tenants and start collecting rent on day one!
Key facts
- Brand-new flooring
- Fresh paint
- Flexible layout
Tags
Property features AI
Finance
- Financial info: Tenant(s) pay all utilities; Operating expenses include water and sewer; Multifamily with separate gas and electric meters (2 each); Total of 2 dwelling units
Exterior
- Parking: On-street parking
- Utilities: Electricity connected; Public water connected; Sewer connected
- Home design: Two-story multifamily property (2 units); Resale property
- Construction: Vinyl siding; Architectural shingle roof; Stone foundation; Existing (previously built) structure
- Exterior features: Rectangular residential lot; City street and main thoroughfare frontage; Lot dimensions approximately 40 x 100
Interior
- Kitchen: Each unit includes an oven/range and refrigerator; Dining area open to living room in each unit
- Bedrooms: Two 3-bedroom units
- Flooring: Vinyl flooring in places; Varied flooring throughout
- Bathrooms: Two full bathrooms (one in each unit)
- Heating & cooling: Gas forced-air heating
- Interior features: Pull-down attic stairs; Full basement
- Laundry & utility: Gas water heater
Neighborhood map
What this means for you Summary
Snapshot
- This is a 2 × 3-bed/1.0-bath units multifamily listed at $184k.
Deal economics
- At list price, monthly cash flow is $943 ($11k/yr) — positive. Per door: $471/mo.
- The deal already cash-flows at list — no discount required.
- Meets the 1% rule at list price ($3k rent vs $184k).
- Recommended offer: $178k (3.0% below list) — sets the bar for market timing.
- Cap rate 12.4% vs local median 10.1% in Elmira — meaningfully above typical; check what's discounted (condition, days-on-market, listing class) to confirm the premium yield is real.
Location & tenants
- Location reads 62/100 on livability (#832 in NY) — a middle-class / working-renter tenant base. Strengths: cost of living A+, housing A+, health & safety A+; Watch: crime F, amenities F, commute F.
- Elmira City School District (urban): math 23% / reading 35% proficiency, ranked #580 of 590 in NY (top 98%) — low school quality limits family demand, transient renter base, plan for 1-2y turnover.
- Zoned schools: Ernie Davis Academy (math 5% / reading 31%, grade F, #691 of 729 statewide, top 95%, 802 students, 66% FRL).
- Market conditions: 104 active listings in the ZIP; 91 units permitted in Chemung County in 2024 (63 in 5+ unit buildings).
Forward outlook
- Local home prices are declining (-3.0%/yr); year-one equity from $1k of loan paydown is wiped out by about $6k of value loss. Plan a longer hold.
- Chemung County population projected at -17% by 2050 — secular population decline; favor cash flow + early exit over multi-decade hold.
- At projected returns (-3.0% appreciation + 3.0% rent growth), your $52k cash investment doubles in ~6 years — after that, you're playing with house money.
Negotiation context
- It's been on market 58 days — a 3% lower offer ($178k) is reasonable based on typical stale-listing flexibility.
- 3 sale attempts since 2y ago with the ask held roughly flat each time — persistent listings suggest the price (not the market) is what's stuck; bring a comps-based counter.
- Current owner paid $24k; list at $184k implies a 663% gain — meaningful room to come down on a strong offer.
Risks & watch-outs
- Watch-outs: built in 1880 — expect roof / HVAC / electrical / plumbing capex.
- Climate carrying-cost: major flood risk — expect insurance premiums to compound above CPI over the hold.
Questions for the listing agent
- It's been on market 58 days. Have you received any prior offers? Is the seller open to a 3% concession, seller financing, or rate buy-down credit?
- Can we see the unit-by-unit rent roll, current vacancy, and any below-market leases? What's the average tenancy length?
- What capital expenditures (roof, boiler, parking lot, exteriors) have been made in the last 5 years, and what's planned in the next 2?
- Built in 1880 — when were the roof, HVAC, electrical panel, plumbing, and water heater last replaced?
- Is there a deadline driving the sale (1031 exchange, divorce, estate, relocation)? That informs how much negotiation room exists.
- Schools are F-rated, which usually means shorter tenancies and higher turnover. Who's the typical renter profile here, and what's been the actual vacancy rate?
- Crime grade is F in this area — have there been break-ins, vandalism, or insurance claims at this property in the last 3 years? What carrier currently insures it and at what premium?
- What's the average days-on-market for RENTAL listings here right now (not sales)? A rising rental-DOM trend means longer vacancies and softer asking-rent achievability than the comps imply.
- What's the recent tenant-quality profile in this submarket — average credit score on applications, eviction rate, late-payment / NSF rate, and stable-employment percentage? A property-management company in the area should have these aggregated.
- How much new apartment / multifamily construction is in the pipeline within 1–3 miles? Heavy new supply (>2% of stock underway) typically softens rents 12–24 months out; light construction supports rent growth.
Investment metrics
- 1% rule
- 1.57% ✓
- Cap rate
- 12.44%
- Cash-on-cash
- 21.96%
- DSCR
- 1.98
- GRM
- 5.3
CMA / ARV
- ARV (median comp)
- $101,847
- List price
- $184,000
- Delta
- 80.66%
- Verdict
- OVERPRICED
- Comps
- 20 within 1.0 mi
Show comp detail 11 sales within ~0.75 mi
| Address | Dist | Beds/Ba | Sqft | Sold | Price | $/sf | Match |
|---|---|---|---|---|---|---|---|
| 307 South Ave | 0.49mi | 5/2.0 (-1) | 2,168 (-4%) | 12mo | $100,000 | $46 | 55 |
| 401 Franklin St | 0.37mi | 5/2.0 (-1) | 2,505 (+10%) | 17mo | $70,000 | $28 | 46 |
| 260 Caldwell Ave | 0.54mi | 5/2.0 (-1) | 2,079 (-8%) | 13mo | $30,000 | $14 | 45 |
| 360 Franklin St | 0.35mi | 6/2.0 | 2,596 (+14%) | 18mo | $18,500 | $7 | 45 |
| 700 Delaware Ave | 0.60mi | 5/2.0 (-1) | 2,446 (+8%) | 15mo | $85,000 | $35 | 42 |
| 360 Davis St | 0.66mi | 5/3.0 (-1) | 2,363 (+4%) | 16mo | $68,000 | $29 | 41 |
| 509 W 1st St | 0.67mi | 5/2.0 (-1) | 2,014 (-11%) | 5mo | $50,000 | $25 | 40 |
| 719 S Main St | 0.71mi | 5/2.0 (-1) | 2,217 (-2%) | 22mo | $110,000 | $50 | 40 |
| 501 Spaulding St | 0.62mi | 6/2.0 | 2,569 (+13%) | 17mo | $19,000 | $7 | 35 |
| 413 Baty St | 0.61mi | 5/2.0 (-1) | 1,978 (-13%) | 13mo | $63,000 | $32 | 34 |
| 356 W Second St | 0.68mi | 5/3.0 (-1) | 2,560 (+13%) | 8mo | $120,000 | $47 | 31 |
Match score weights: distance 35% · size 25% · config 20% · recency 20%. Top-matched comps best support the ARV.
Projected returns pro-forma
-3.0% appreciation · 3.0% rent growth · sell at horizon
- IRR
- 14.7%
- Equity multiple
- 1.59×
- Total profit
- $30,314
- Equity at exit
- $27,435
- IRR
- 23.4%
- Equity multiple
- 3.02×
- Total profit
- $104,068
- Equity at exit
- $15,909
Cash invested: $51,520 (down + closing). Projections, not guarantees.
Landlord ↔ Tenant lean methodology
- Overall (STATE)
- 15 Strongly Tenant-Friendly
- State New York
- 15 Strongly Tenant-Friendly · D+10
- County
- — inherits STATE
- City
- — inherits STATE
ZIP-level market 14904
- Home prices YoY
- -9.6%
- Active inventory
- 104
- Price-to-rent
- 10.6×
Monthly cashflow live
- Estimated rent
- $2,894 high interval (Pro) →
- Mortgage (P&I)
- −$965
- Tax from tax record
- −$302 /mo · $3,624/yr
- Insurance
- −$77
- HOA
- −$0
- Vacancy / Maint / Mgmt
- −$608
- Net cashflow
- $943
Break-even live
Sensitivity live
| Price | -10% $1,047 | -5% $995 | +0% $943 | +5% $891 | +10% $839 |
|---|---|---|---|---|---|
| Rent | -10% $714 | -5% $828 | +0% $943 | +5% $1,057 | +10% $1,171 |
| Rate | -1.0pp $1,035 | -0.5pp $990 | base $943 | +0.5pp $895 | +1.0pp $847 |
2-unit breakdown (identical units grouped — click to expand)
| Units | Beds | Baths | Est. rent |
|---|---|---|---|
| 2× units | 3 | 1 | $2,894 |
| #1 | 3 | 1 | $1,447 |
| #2 | 3 | 1 | $1,447 |
| Total (2 units) | $2,894 | ||
UW: 25.0% down · 7.5% · 30yr · 1.5% tax · 5.0% vac · 8.0% maint · 8.0% mgmt
Financing live
Cash to close
- Down payment
- $46,000
- Closing costs
- $5,520
- Reserves months
- —
- Total cash needed
- —
Loan-product check · same deal, 3 products live
Conventional
25% down · 7.5% · 30yr
- Down + closing
- —
- Monthly P&I
- —
- Monthly cashflow
- —
- DSCR
- —
- Eligible?
- —
Personal DTI + credit; lowest rate.
DSCR
20% down · 8.5% · 30yr
- Down + closing
- —
- Monthly P&I
- —
- Monthly cashflow
- —
- DSCR
- —
- Eligible?
- —
No personal income docs; deal must DSCR.
Hard money
10% down · 12.0% · 12mo
- Down + closing
- —
- Monthly P&I
- —
- Monthly cashflow
- —
- DSCR
- —
- Eligible?
- —
Short-term bridge; refi at stabilization.
Listing history 27 events
-
2026-06-21days on market $184,000 Active 58 DOM
-
2026-06-19days on market $184,000 Active 56 DOM
-
2026-06-18days on market $184,000 Active 55 DOM
-
2026-06-17days on market $184,000 Active 54 DOM
-
2026-06-16days on market $184,000 Active 53 DOM
-
2026-06-15days on market $184,000 Active 52 DOM
-
2026-06-14days on market $184,000 Active 50 DOM
-
2026-06-12days on market $184,000 Active 49 DOM
-
2026-06-09days on market $184,000 Active 46 DOM
-
2026-06-08days on market $184,000 Active 45 DOM
-
2026-06-07days on market $184,000 Active 44 DOM
-
2026-06-05days on market $184,000 Active 41 DOM
-
2026-06-03days on market $184,000 Active 40 DOM
-
2026-06-02days on market $184,000 Active 39 DOM
-
2026-06-01days on market $184,000 Active 38 DOM
-
2026-05-31days on market $184,000 Active 37 DOM
-
2026-05-30days on market $184,000 Active 36 DOM
-
2026-05-19price $184,000 686-char remark
-
2026-04-24$189,000 Active 686-char remark
-
2025-05-12historical
-
2025-05-12historical
-
2025-04-11price $39,900
-
2025-02-28price $41,000
-
2024-12-30$45,000 Active
-
2024-12-23historical
-
2024-09-19$56,000 Active
-
2024-08-02soldstatus $24,100
ⓘ Source: listings_history table (triggers on properties + properties_extension) + one-shot
backfill from property_details.listing_events for pre-trigger history.
Tax reassessment forecast NY · Partial reset (capped growth)
- Current annual tax
- $3,624 · $302/mo
- Projected year-2 tax
- $3,624 · $302/mo
- Expected delta
- $0/yr ($0/mo · 0.0%)
ⓘ Screening estimate from a state-policy table — verify with the county assessor before closing.
Climate risk First Street
- Flood 6/10 Major FEMA zone X (shaded) · 49% chance over 30 yrs
- Wildfire 1/10 Low
- Heat 3/10 Moderate 7 d/yr ≥97°F today · 16 d/yr by 30 yrs out
- Wind 2/10 Low 100% chance of damaging wind over 30 yrs
- Air quality 1/10 Low 0 unhealthy d/yr today · 0 by 30 yrs out
Nearby sold comps map
Loading sold comps map…
Walkable amenities ~0.75 mi
Loading nearby amenities…
Taxation est. · year 1
- Rental income
- $34,728
- − Mortgage interest
- −$10,307
- − Property taxes
- −$3,624
- − Insurance
- −$920
- − Repairs & maintenance
- −$2,778
- − Management
- −$2,778
- − Depreciation
- −$5,353
- Taxable income
- $8,968
- Est. tax owed @ 24.0%
- −$2,152
- After-tax cash flow
- $9,160/yr
For passive investors: Depreciation is non-cash, so a rental often shows a tax loss while cash-flowing — sheltering income. Rental losses are passive: they offset passive income freely, and up to $25,000/yr can offset ordinary (W-2) income if you actively participate and your MAGI is under $100k (phasing out to $0 by $150k); unused losses carry forward. On sale, claimed depreciation is recaptured at up to 25%, and gains may owe capital-gains tax (a 1031 exchange can defer both). Figures are a year-1 estimate at your 24.0% rate — not tax advice; consult a CPA.
Schools (NCES district)
- District
- Elmira City School District
- NCES district ID
- 3610560
- Math proficiency
- 23% ▼ -7.00%
- Reading proficiency
- 35% ▲ 7.00%
- Median HH income
- $40,180
- Composite
- 24.39/100
- National rank
- #7688
- State rank
- #580 of 590 in NY
Livability — Elmira
- Score
- 62/100
- State rank
- #832
- US rank
- #16139
Category grades
Schools grade is shown separately in the Schools card above.
Census & demographics
- Census place
- Elmira, NY
- City population
- 14,276
- Population (ZIP)
- 14,276
Population outlook (Chemung County) Hauer SSP2
- Today (2025)
- 82,931 people
- By 2030
- 80,356 · -3.1%
- By 2040
- 74,745 · -9.9%
- By 2050
- 69,012 · -16.8%
- By 2075
- 55,689 · -32.8%
- By 2100
- 41,428 · -50.0%
Race, ethnicity, and origin ACS 2023
- Neighborhood character
- Predominantly White (83%)
- Race & ethnicity
- White 83% Two or more races 7% Black 7% Hispanic / Latino 5% Native American 1%
- Common ancestry
- Romanian 7% Lithuanian 3% Slovak 2%
- Foreign-born
- 2% · Canada, Jamaica, Dominican Republic
- Languages at home
- 97% English-only · Spanish 2%
Political lean MEDSL · Chemung
- 2024 margin
- R (+16.8) · D 41.6% · R 58.4%
- 2008→2024 swing
- -15.6pp toward R · 2008: -1.2pp · 2024: -16.8pp
- All cycles
- 2024: R+16.8 2020: R+13.4 2016: R+20.0 2012: R+2.9 2008: R+1.2
Not yet ingested
- Civics
- —
Market trends
- HPI YoY
- ▼ -23.33%
- Current HPI
- 220.688
- Rent YoY
- —
- Metro
- —
- State GDP YoY
- ▲ 2.60%
- F500 in state
- 92
Industry mix (Fortune 500 HQ in NY)
| Industry | F500 HQs | Revenue |
|---|---|---|
| Financial Services | 10 | $950B |
|
||
| Consumer Goods | 9 | $162B |
|
||
| Insurance | 4 | $225B |
|
||
| Telecommunications | 2 | $144B |
|
||
| Pharmaceuticals | 2 | $112B |
|
||
| Media / Entertainment | 2 | $69B |
|
||
Price history
+663.5% since first listed10 events — show timeline
- 2026-05-19 Price Changed $184,000 UNYREIS
- 2026-04-24 Listed $189,000 UNYREIS
- 2025-05-12 Listing Removed — UNYREIS
- 2025-05-12 Listing Removed — UNYREIS
- 2025-04-11 Price Changed $39,900 UNYREIS
- 2025-02-28 Price Changed $41,000 UNYREIS
- 2024-12-30 Listed $45,000 UNYREIS
- 2024-12-23 Listing Removed — WNYREIS
- 2024-09-19 Listed $56,000 WNYREIS
- 2024-08-02 Sold (Public Records) $24,100 Public Records
Property tax history
+19.2%/yrLatest (2025): $3,624 · -19.9% YoY. Source: county tax records.
Cash-flow waterfall
monthlySold comps — $/sqft
last 12 mo · ≤1 miLoading sold comps…