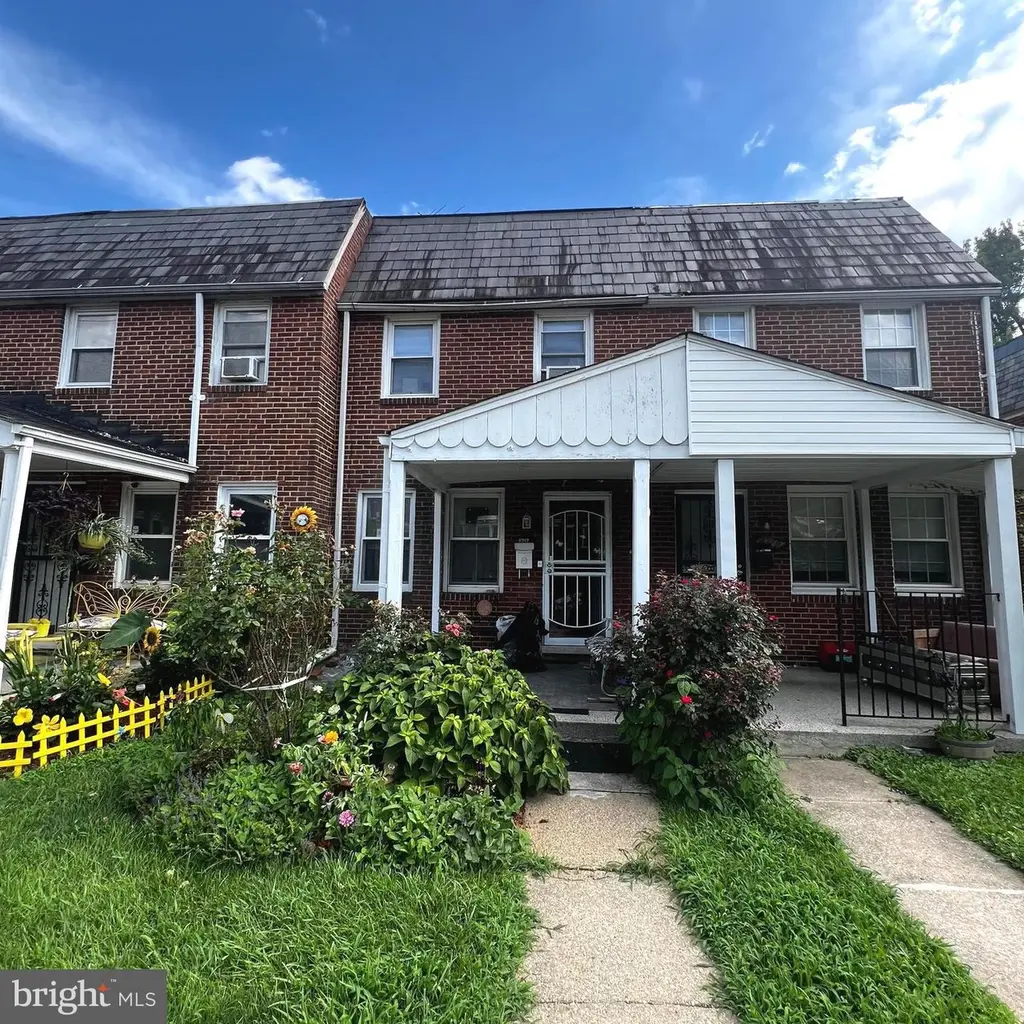
4717 Frederick Ave · Baltimore, MD
Flood risk 4/10 · Minor
- FEMA flood zone
- X (unshaded)
- Chance of flooding over 30 yrs
- 0.22%
- Est. flood insurance / yr
- $473 – $860
Fire risk 1/10 · Minimal
- Est. fire insurance / yr
- $755 – $1,403
Heat risk 7/10 · Major
- Hot days now (above 103°F)
- 7 days/yr
- Hot days in 30 yrs
- 15 days/yr
Wind risk 5/10 · Moderate
- Chance of severe wind over 30 yrs
- 24.0%
Air-quality risk 3/10 · Minor
- Unhealthy air days now
- 3 days/yr
- Unhealthy air days in 30 yrs
- 4 days/yr
Risk factors via First Street. Map © Google.
Why this score? — see what drove the D grade
The composite is a weighted blend of 9 inputs, each scored 0–100. Each bar is that input's sub-score; the figure is the points it added to the 100-point composite (weight × sub-score).
- Cash flow +17.9/30.0
- DSCR +5.6/10.0
- 1% rule +4.9/10.0
- Rent growth +3.8/5.0
- Livability +3.8/5.0
- Condition / age +2.5/5.0
- ARV discount +1.3/15.0
- Schools +1.0/10.0
- Appreciation +0.0/10.0
$179,500
🖨 Deal sheet (PDF) 📄 Offer letter ✓ Due diligence
Key facts
- Built 1941
- Listed 293 days
Neighborhood map
What this means for you Summary
Snapshot
- This is a 3-bed/1.0-bath townhouse listed at $180k.
Deal economics
- At list price, monthly cash flow is $153 ($2k/yr) — positive.
- The deal already cash-flows at list — no discount required.
- To meet the 1% rule (rent ≥ 1% of price), the offer needs to be $178k (0.8% below list).
- Recommended offer: $158k (12.0% below list) — sets the bar for market timing.
- Cap rate 7.3% vs local median 6.0% in Baltimore — meaningfully above typical; check what's discounted (condition, days-on-market, listing class) to confirm the premium yield is real.
Location & tenants
- Location reads 76/100 on livability (#90 in MD, #3,396 nationally) — a middle-class / working-renter tenant base. Strengths: amenities A+, commute A+, housing A+; Watch: schools D, crime F.
- Baltimore City Public Schools (urban): math 7% / reading 16% proficiency, ranked #24 of 24 in MD (top 100%) — low school quality limits family demand, transient renter base, plan for 1-2y turnover; 79% free/reduced lunch — lower-income household profile, screen leases tightly.
- Market conditions: Rents rising fast (+5.4%/yr); 256 active listings in the ZIP; 40 comparable units currently listed for rent nearby; rentals at typical pace (median 23d on market — plan ~3-4 weeks tenant-placement turnaround); 1,273 units permitted in Baltimore city in 2024 (1,104 in 5+ unit buildings).
- This rent runs 36% of the median local income ($60k/yr) — at the standard rent-burdened threshold; future hikes will face affordability resistance.
Forward outlook
- Local home prices are declining (-3.0%/yr); year-one equity from $1k of loan paydown is wiped out by about $5k of value loss. Plan a longer hold.
- Baltimore County population projected to shrink 4% by 2050 — rents likely to lag national; underwrite the cash flow, not the appreciation.
Negotiation context
- It's been on market 294 days — a 12% lower offer ($158k) is reasonable based on typical stale-listing flexibility.
- 2 sale attempts since 31y ago with the ask held roughly flat each time — persistent listings suggest the price (not the market) is what's stuck; bring a comps-based counter.
- Current owner paid $24k; list at $180k implies a 646% gain — meaningful room to come down on a strong offer.
Risks & watch-outs
- Watch-outs: built in 1941 — expect roof / HVAC / electrical / plumbing capex.
- Climate carrying-cost: moderate wind risk, 24% chance of damaging wind over 30y; extreme-heat days projected 7→15/yr by 2055 (HVAC capex compounding) — expect insurance premiums to compound above CPI over the hold.
Questions for the listing agent
- It's been on market 294 days. Have you received any prior offers? Is the seller open to a 12% concession, seller financing, or rate buy-down credit?
- Built in 1941 — when were the roof, HVAC, electrical panel, plumbing, and water heater last replaced?
- Why hasn't it sold? Are there any deal-killer items the seller is aware of (foundation, flood, title, zoning, code violations)?
- Is there a deadline driving the sale (1031 exchange, divorce, estate, relocation)? That informs how much negotiation room exists.
- Schools are D-rated, which usually means shorter tenancies and higher turnover. Who's the typical renter profile here, and what's been the actual vacancy rate?
- Crime grade is F in this area — have there been break-ins, vandalism, or insurance claims at this property in the last 3 years? What carrier currently insures it and at what premium?
- The area grade is low — what's the realistic commute time and amenity access for the typical tenant pool here? Any planned neighborhood developments (good or bad) we should know about?
- What's the average days-on-market for RENTAL listings here right now (not sales)? A rising rental-DOM trend means longer vacancies and softer asking-rent achievability than the comps imply.
- What's the recent tenant-quality profile in this submarket — average credit score on applications, eviction rate, late-payment / NSF rate, and stable-employment percentage? A property-management company in the area should have these aggregated.
- How much new for-sale + rental construction is in the pipeline within 1–3 miles? Heavy new supply typically softens prices + rents 12–24 months out; constrained supply supports both.
Investment metrics
- 1% rule
- 0.99% ✗
- Cap rate
- 7.31%
- Cash-on-cash
- 3.64%
- DSCR
- 1.16
- GRM
- 8.4
CMA / ARV
- ARV (median comp)
- $157,790
- List price
- $179,500
- Delta
- 13.76%
- Verdict
- OVERPRICED
- Comps
- 20 within 1.0 mi
Show comp detail 12 sales within ~0.75 mi
| Address | Dist | Beds/Ba | Sqft | Sold | Price | $/sf | Match |
|---|---|---|---|---|---|---|---|
| 48 Hillvale Rd | 0.31mi | 3/1.5 | 1,224 (-0%) | 2mo | $180,000 | $147 | 82 |
| 40 Hillvale Rd | 0.30mi | 3/2.0 | 1,224 (-0%) | 1mo | $230,000 | $188 | 80 |
| 44 N Athol Ave | 0.49mi | 3/1.0 | 1,224 (-0%) | 3mo | $121,600 | $99 | 74 |
| 5141 Stafford Rd | 0.35mi | 3/1.5 | 1,140 (-7%) | 0mo | $120,100 | $105 | 69 |
| 642 Queensgate Rd | 0.51mi | 3/2.0 | 1,260 (+2%) | 0mo | $234,444 | $186 | 68 |
| 5212 Fredcrest Rd | 0.43mi | 3/1.5 | 1,120 (-9%) | 0mo | $195,000 | $174 | 63 |
| 4413 Parkton St | 0.33mi | 2/1.5 (-1) | 1,120 (-9%) | 3mo | $130,000 | $116 | 60 |
| 4865 Melbourne Rd | 0.62mi | 2/2.0 (-1) | 1,232 (+0%) | 2mo | $214,000 | $174 | 60 |
| 542 Lucia Ave | 0.43mi | 3/2.0 | 1,344 (+9%) | 1mo | $205,000 | $153 | 60 |
| 708 Woodington Rd S | 0.49mi | 2/1.5 (-1) | 1,120 (-9%) | 1mo | $100,000 | $89 | 54 |
| 101 Upmanor Rd | 0.52mi | 3/1.0 | 1,408 (+14%) | 1mo | $205,000 | $146 | 51 |
| 748 Bethnal Rd | 0.49mi | 3/1.5 | 1,408 (+14%) | 2mo | $183,000 | $130 | 49 |
Match score weights: distance 35% · size 25% · config 20% · recency 20%. Top-matched comps best support the ARV.
Projected returns pro-forma
-3.0% appreciation · 5.38% rent growth · sell at horizon
- IRR
- -7.9%
- Equity multiple
- 0.70×
- Total profit
- $-14,969
- Equity at exit
- $26,764
- IRR
- 4.5%
- Equity multiple
- 1.37×
- Total profit
- $18,431
- Equity at exit
- $15,520
Cash invested: $50,260 (down + closing). Projections, not guarantees.
Landlord ↔ Tenant lean methodology
- Overall (CITY)
- 12 Strongly Tenant-Friendly
- State Maryland
- 27 Tenant-Leaning · D+14
- County
- — inherits STATE
- City Baltimore
- 12 Strongly Tenant-Friendly · D+58
ZIP-level market 21229
- Rents YoY
- 5.4%
- Active inventory
- 256
- Price-to-rent
- 8.4×
Monthly cashflow live
- Estimated rent
- $1,781 high interval (Pro) →
- Mortgage (P&I)
- −$941
- Tax from tax record
- −$238 /mo · $2,858/yr
- Insurance
- −$75
- HOA
- −$0
- Vacancy / Maint / Mgmt
- −$374
- Net cashflow
- $153
Break-even live
Sensitivity live
| Price | -10% $254 | -5% $203 | +0% $153 | +5% $102 | +10% $51 |
|---|---|---|---|---|---|
| Rent | -10% $12 | -5% $82 | +0% $153 | +5% $223 | +10% $293 |
| Rate | -1.0pp $243 | -0.5pp $198 | base $153 | +0.5pp $106 | +1.0pp $59 |
UW: 25.0% down · 7.5% · 30yr · 1.5% tax · 5.0% vac · 8.0% maint · 8.0% mgmt
Financing live
Cash to close
- Down payment
- $44,875
- Closing costs
- $5,385
- Reserves months
- —
- Total cash needed
- —
Loan-product check · same deal, 3 products live
Conventional
25% down · 7.5% · 30yr
- Down + closing
- —
- Monthly P&I
- —
- Monthly cashflow
- —
- DSCR
- —
- Eligible?
- —
Personal DTI + credit; lowest rate.
DSCR
20% down · 8.5% · 30yr
- Down + closing
- —
- Monthly P&I
- —
- Monthly cashflow
- —
- DSCR
- —
- Eligible?
- —
No personal income docs; deal must DSCR.
Hard money
10% down · 12.0% · 12mo
- Down + closing
- —
- Monthly P&I
- —
- Monthly cashflow
- —
- DSCR
- —
- Eligible?
- —
Short-term bridge; refi at stabilization.
Rent comps 40 comps
| Address | Beds | Baths | Sqft | Rent | $/sqft | DOM | Units | Dist |
|---|---|---|---|---|---|---|---|---|
| 402 Colleen Rd Baltimore, MD | 1.0–2.0 | 1.0 | 910 | $1,450 | $1.59 | 3d | 11 | 0.13mi |
| 19 S Tremont Rd Baltimore, MD | 3.0 | 1.0 | 1350 | $1,850 | $1.37 | 44d | 1 | 0.14mi |
| 2 S Tremont Rd Baltimore, MD | 3.0 | 2.0 | 1450 | $1,800 | $1.24 | 12d | 1 | 0.18mi |
| 2 S Tremont Rd Baltimore, MD | 3.0 | 2.0 | 1450 | $1,800 | $1.24 | 25d | 1 | 0.18mi |
| 114 S Rock Glen Rd Baltimore, MD | 4.0 | 1.5 | 1160 | $2,350 | $2.03 | 13d | 1 | 0.28mi |
| 4601 Pen Lucy Rd Unit 4615-G Baltimore, MD | 2.0 | 1.0 | 798 | $1,200 | $1.50 | 22d | 1 | 0.29mi |
| 4601 Pen Lucy Rd Unit 103-H Baltimore, MD | 2.0 | 1.0 | 798 | $1,315 | $1.65 | 25d | 1 | 0.30mi |
| 4601 Pen Lucy Rd Unit 4718-F Baltimore, MD | 2.0 | 1.0 | 879 | $1,225 | $1.39 | 3d | 1 | 0.30mi |
| 4601 Pen Lucy Rd Unit 4714-B Baltimore, MD | 2.0 | 1.0 | 730 | $1,205 | $1.65 | 15d | 1 | 0.30mi |
| 501 Hazlett Ave Baltimore, MD | 2.0–3.0 | 1.5–2.0 | 1044 | $1,879 | $1.80 | 2d | 8 | 0.31mi |
| 4431 Eldone Rd Baltimore, MD | 3.0 | 2.0 | 896 | $2,000 | $2.23 | 25d | 1 | 0.35mi |
| 500 Lucia Ave Baltimore, MD | 3.0 | 2.0 | 1472 | $2,100 | $1.43 | 17d | 1 | 0.36mi |
| 219 Atholgate Ln Baltimore, MD | 1.0–3.0 | 1.0–1.5 | 814 | $1,500 | $1.84 | 4d | 2 | 0.37mi |
| 5147 Frederick Ave Baltimore, MD | 3.0 | 2.0 | 1216 | $1,950 | $1.60 | 4d | 1 | 0.38mi |
| 565 Brisbane Rd Baltimore, MD | 2.0 | 2.0 | 1146 | $1,675 | $1.46 | 25d | 1 | 0.40mi |
| 4301 Parkton St Baltimore, MD | 1.0–3.0 | 1.0 | 730 | $1,550 | $2.12 | 44d | 1 | 0.46mi |
| 586 Lucia Ave Baltimore, MD | 3.0 | 1.5 | 1178 | $2,100 | $1.78 | 18d | 1 | 0.49mi |
| 2 N Woodington Rd Baltimore, MD | 1.0–2.0 | 1.0 | 738 | $1,335 | $1.81 | 4d | 5 | 0.51mi |
| 2 S Woodington Rd Baltimore, MD | 2.0 | 1.0 | 856 | $1,160 | $1.36 | 15d | 1 | 0.51mi |
| 738 Yale Ave Baltimore, MD | 2.0 | 1.0 | 1346 | $1,900 | $1.41 | 25d | 1 | 0.52mi |
| 111 Upmanor Rd Baltimore, MD | 3.0 | 1.5 | 1224 | $2,163 | $1.77 | 44d | 1 | 0.53mi |
| 613 S Beechfield Ave Baltimore, MD | 3.0 | 1.5 | 1080 | $1,950 | $1.81 | 44d | 1 | 0.55mi |
| 304 Collins Ave Unit 2 Baltimore, MD | 3.0 | 1.0 | 1016 | $2,100 | $2.07 | 44d | 1 | 0.55mi |
| 627 Lucia Ave Baltimore, MD | 3.0 | 1.0 | 892 | $1,750 | $1.96 | 25d | 1 | 0.55mi |
| 751 Yale Ave Baltimore, MD | 3.0 | 1.5 | 1024 | $1,750 | $1.71 | 44d | 1 | 0.56mi |
| 131 N Bend Rd Unit 131-1B Baltimore, MD | 2.0 | 1.5 | 910 | $1,225 | $1.35 | 22d | 1 | 0.61mi |
| 4018 Massachusetts Ave Baltimore, MD | 3.0 | 1.0 | 1050 | $1,400 | $1.33 | 25d | 1 | 0.61mi |
| 212 S Loudon Ave Baltimore, MD | 3.0 | 1.5 | 1310 | $1,550 | $1.18 | 44d | 1 | 0.65mi |
| 5364 Jamestowne Ct Baltimore, MD | 3.0 | 1.0–1.5 | 787 | $1,905 | $2.42 | 5d | 13 | 0.72mi |
| 4520 Scarlet Oak Ln Baltimore, MD | 2.0 | 1.0 | 1025 | $1,500 | $1.46 | 44d | 1 | 0.74mi |
| 220 Stonecroft Rd Unit 230-D Baltimore, MD | 2.0 | 1.5 | 900 | $1,395 | $1.55 | 22d | 1 | 0.76mi |
| 220 Stonecroft Rd Unit 232-I Baltimore, MD | 2.0 | 1.5 | 900 | $1,295 | $1.44 | 18d | 1 | 0.76mi |
| 603 Braeside Rd Baltimore, MD | 3.0 | 2.0 | 1416 | $2,400 | $1.69 | 44d | 1 | 1.05mi |
| 3607 W Lexington St Baltimore, MD | 3.0 | 2.0 | 1050 | $1,895 | $1.80 | 5d | 1 | 1.11mi |
| 24 Laurence Brooke Rd Catonsville, MD | 4.0 | 3.0 | 1440 | $2,800 | $1.94 | 13d | 1 | 1.11mi |
| 3706 W Franklin St Unit 1 Baltimore, MD | 2.0 | 1.0 | 735 | $1,100 | $1.50 | 5d | 1 | 1.14mi |
| 201 S Symington Ave Catonsville, MD | 1.0–2.0 | 1.0 | 788 | $1,519 | $1.93 | 2d | 13 | 1.16mi |
| 3392 Saint Benedict St Baltimore, MD | 2.0 | 1.0 | 864 | $1,450 | $1.68 | 25d | 1 | 1.16mi |
| 3336 W Caton Ave Baltimore, MD | 3.0 | 2.0 | 1236 | $1,625 | $1.31 | 25d | 1 | 1.17mi |
| 4020 Gelston Dr Baltimore, MD | 3.0 | 2.0 | 1270 | $1,875 | $1.48 | 44d | 1 | 1.17mi |
Listing history 20 events
-
2026-06-21days on market $179,500 Active 294 DOM
-
2026-06-18days on market $179,500 Active 291 DOM
-
2026-06-17days on market $179,500 Active 290 DOM
-
2026-06-16days on market $179,500 Active 289 DOM
-
2026-06-15days on market $179,500 Active 288 DOM
-
2026-06-13days on market $179,500 Active 286 DOM
-
2026-06-09days on market $179,500 Active 282 DOM
-
2026-06-08days on market $179,500 Active 281 DOM
-
2026-06-07days on market $179,500 Active 280 DOM
-
2026-06-04days on market $179,500 Active 277 DOM
-
2026-06-03days on market $179,500 Active 276 DOM
-
2026-06-02days on market $179,500 Active 275 DOM
-
2026-06-01days on market $179,500 Active 274 DOM
-
2026-05-31days on market $179,500 Active 273 DOM
-
2025-10-02price $179,500
-
2025-09-01$185,000 Active
-
2025-07-31historical $185,000
-
1995-07-31soldstatus $24,077
-
1995-03-09historical
-
1995-02-10$23,000
ⓘ Source: listings_history table (triggers on properties + properties_extension) + one-shot
backfill from property_details.listing_events for pre-trigger history.
Tax reassessment forecast MD · Partial reset (capped growth)
- Current annual tax
- $2,858 · $238/mo
- Projected year-2 tax
- $2,858 · $238/mo
- Expected delta
- $0/yr ($0/mo · 0.0%)
ⓘ Screening estimate from a state-policy table — verify with the county assessor before closing.
Climate risk First Street
- Flood 4/10 Moderate FEMA zone X (unshaded) · 22% chance over 30 yrs
- Wildfire 1/10 Low
- Heat 7/10 Severe 7 d/yr ≥103°F today · 15 d/yr by 30 yrs out
- Wind 5/10 Major 24% chance of damaging wind over 30 yrs
- Air quality 3/10 Moderate 3 unhealthy d/yr today · 4 by 30 yrs out
Nearby sold comps map
Loading sold comps map…
Walkable amenities ~0.75 mi
Loading nearby amenities…
Taxation est. · year 1
- Rental income
- $21,369
- − Mortgage interest
- −$10,055
- − Property taxes
- −$2,858
- − Insurance
- −$898
- − Repairs & maintenance
- −$1,710
- − Management
- −$1,710
- − Depreciation
- −$5,222
- Taxable loss
- −$1,082
- Est. tax savings @ 24.0%
- +$260
- After-tax cash flow
- $2,090/yr
For passive investors: Depreciation is non-cash, so a rental often shows a tax loss while cash-flowing — sheltering income. Rental losses are passive: they offset passive income freely, and up to $25,000/yr can offset ordinary (W-2) income if you actively participate and your MAGI is under $100k (phasing out to $0 by $150k); unused losses carry forward. On sale, claimed depreciation is recaptured at up to 25%, and gains may owe capital-gains tax (a 1031 exchange can defer both). Figures are a year-1 estimate at your 24.0% rate — not tax advice; consult a CPA.
Schools (NCES district)
- District
- Baltimore City Public Schools
- NCES district ID
- 2400090
- Math proficiency
- 7% ▼ -9.00%
- Reading proficiency
- 16% ▼ -5.00%
- Median HH income
- $42,108
- Composite
- 10.08/100
- National rank
- #9805
- State rank
- #24 of 24 in MD
Livability — Baltimore
- Score
- 76/100
- State rank
- #90
- US rank
- #3396
Category grades
Schools grade is shown separately in the Schools card above.
Census & demographics
- Census place
- Baltimore, MD
- County
- Baltimore City · 558,601 people
- City population
- 588,727
- Metro
- Baltimore-Columbia-Towson, MD
- Population (ZIP)
- 46,679
- Household income
- $60,047
- Rent vs Own
- Severe rent burden
- 2776.0
Population outlook (Baltimore County) Hauer SSP2
- Today (2025)
- 624,249 people
- By 2030
- 621,541 · -0.4%
- By 2040
- 609,756 · -2.3%
- By 2050
- 597,249 · -4.3%
- By 2075
- 552,236 · -11.5%
- By 2100
- 513,934 · -17.7%
Race, ethnicity, and origin ACS 2023
- Neighborhood character
- Predominantly Black (73%)
- Race & ethnicity
- Black 73% White 15% Hispanic / Latino 6% Two or more races 4% Asian 3%
- Hispanic origin (detail)
- Common ancestry
- Lithuanian 1% Romanian 1% Serbian 1%
- Foreign-born
- 5% · Canada, Philippines
- Languages at home
- 91% English-only · Spanish 4% Other Indo-European 2% Other Asian/Pacific 1%
Political lean MEDSL · Baltimore
- 2024 margin
- Solid D (+73.0) · D 85.2% · R 12.2% · Other 2.6%
- 2008→2024 swing
- -2.5pp toward R · 2008: 75.5pp · 2024: 73.0pp
- All cycles
- 2024: D+73.0 2020: D+76.6 2016: D+74.6 2012: D+76.4 2008: D+75.5
Not yet ingested
- Civics
- —
Market trends
- HPI YoY
- ▼ -259.07%
- Current HPI
- 226.896
- Rent YoY
- ▲ 5.38%
- Metro
- Baltimore-Columbia-Towson, MD
- State GDP YoY
- ▲ 2.97%
- F500 in state
- 12
Industry mix (Fortune 500 HQ in MD)
| Industry | F500 HQs | Revenue |
|---|---|---|
| Aerospace / Defense | 1 | $71B |
|
||
| Utilities | 1 | $25B |
|
||
| Hotels | 1 | $24B |
|
||
| Consumer Goods | 1 | $7B |
|
||
| Real Estate | 1 | $6B |
|
||
| Chemicals | 1 | $2B |
|
||
Price history
+680.4% since first listed6 events — show timeline
- 2025-10-02 Price Changed $179,500 BRIGHT MLS
- 2025-09-01 Listed $185,000 BRIGHT MLS
- 2025-07-31 Coming Soon $185,000 BRIGHT MLS
- 1995-07-31 Sold (MLS) $24,077 MRIS
- 1995-03-09 Delisted — MRIS
- 1995-02-10 Listed $23,000 MRIS
Property tax history
+1.7%/yrLatest (2025): $2,858 · +6.6% YoY. Source: county tax records.
Cash-flow waterfall
monthlySold comps — $/sqft
last 12 mo · ≤1 miLoading sold comps…