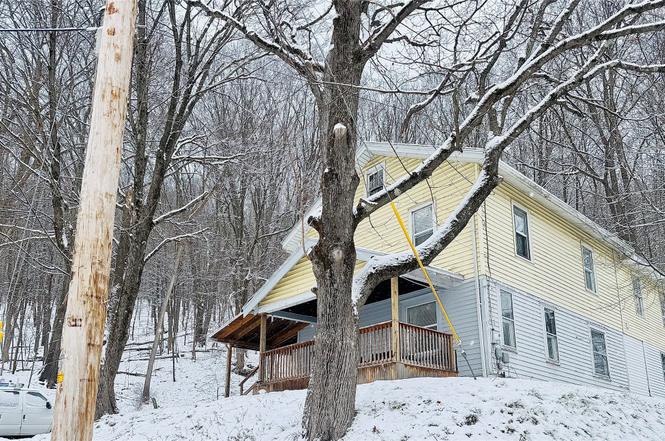
30 Esther Ave · Binghamton, NY
Flood risk 1/10 · Minimal
- FEMA flood zone
- X
- Chance of flooding over 30 yrs
- 0.0%
- Est. flood insurance / yr
- $473 – $860
Fire risk 1/10 · Minimal
- Est. fire insurance / yr
- $691 – $1,283
Heat risk 3/10 · Minor
- Hot days now (above 92°F)
- 7 days/yr
- Hot days in 30 yrs
- 15 days/yr
Wind risk 2/10 · Minimal
- Chance of severe wind over 30 yrs
- 1.0%
Air-quality risk 2/10 · Minimal
- Unhealthy air days now
- 0 days/yr
- Unhealthy air days in 30 yrs
- 1 days/yr
Risk factors via First Street. Map © Google.
Why this score? — see what drove the C+ grade
The composite is a weighted blend of 9 inputs, each scored 0–100. Each bar is that input's sub-score; the figure is the points it added to the 100-point composite (weight × sub-score).
- Cash flow +16.6/30.0
- ARV discount +10.0/15.0
- Appreciation +10.0/10.0
- 1% rule +7.1/10.0
- DSCR +5.1/10.0
- Livability +3.9/5.0
- Schools +3.0/10.0
- Rent growth +2.5/5.0
- Condition / age +2.5/5.0
$162,500
🖨 Deal sheet 📄 Offer letter ✓ Due diligence
Listing remarks
DOUBLE LOT at the end of a quiet cul-de-sac. Updated and Spacious Two story Home 4–5 bedrooms and 2 full baths, this property features gorgeous hardwood floors throughout, with a newly carpeted second floor installed over hardwood. Recent updates include a Brand-New Roof and chimney and a refrigerator just 1 month old. The kitchen shines with new quartz countertops, new sink, and elegant porcelain tile backsplash. Upstairs bathroom has been fully refreshed with new tile to the ceiling, new vanity, faucet, and mirror. Spacious, updated, and move-in ready. Binghamton University within 5-7 min, Downtown even closer!!!
Key facts
- Quiet cul-de-sac
- Double lot
- Brand-new roof
Tags
Neighborhood map
What this means for you Summary
Snapshot
- This is a 3-bed/2.5-bath single-family listed at $162k.
Deal economics
- At list price, monthly cash flow is $97 ($1k/yr) — positive.
- The deal already cash-flows at list — no discount required.
- Meets the 1% rule at list price ($2k rent vs $162k).
- Recommended offer: $158k (3.0% below list) — sets the bar for market timing.
Location & tenants
- Location reads 78/100 on livability (#174 in NY, #2,710 nationally) — a middle-class / working-renter tenant base. Strengths: amenities A+, commute A+, cost of living A+; Watch: crime F, employment F.
- Binghamton City School District (urban): math 30% / reading 44% proficiency, ranked #557 of 590 in NY (top 94%) — families likely to look elsewhere, expect single-tenant / working-renter base with shorter leases; 61% free/reduced lunch — lower-income household profile, screen leases tightly.
- Zoned schools: Benjamin Franklin Elementary School (math 17% / reading 32%, grade F, #1,846 of 2,108 statewide, top 91%, 399 students, 75% FRL).
- Zoned-school proficiency averages 24% at this address vs 37% district-wide (-12 pts) — the specific schools serving this property underperform the Binghamton City School District average; the district grade overstates school quality for this exact location.
- Market conditions: 112 active listings in the ZIP; 13 comparable units currently listed for rent nearby; rentals lingering (median 44d on market — plan ~5-8 weeks vacancy on turnover, expect pricing pressure); 62% of comp listings sitting > 30 days — soft ceiling on asking rent; 340 units permitted in Broome County in 2024 (269 in 5+ unit buildings).
Forward outlook
- In year one you build about $17k of equity ($1k loan paydown + $16k appreciation (10.0% local appreciation)).
- Broome County population projected at -13% by 2050 — secular population decline; favor cash flow + early exit over multi-decade hold.
- At projected returns (10.0% appreciation + 3.0% rent growth), your $46k cash investment doubles in ~3 years — after that, you're playing with house money.
- By year 3, paydown + projected appreciation supports a ~$44k cash-out refi (75% LTV) — recoverable capital for the next deal without selling this one.
Negotiation context
- It's been on market 42 days — a 3% lower offer ($158k) is reasonable based on typical stale-listing flexibility.
- 5 sale attempts since 2y ago with the ask held roughly flat each time — persistent listings suggest the price (not the market) is what's stuck; bring a comps-based counter.
- Current owner paid $42k; list at $162k implies a 282% gain — meaningful room to come down on a strong offer.
Risks & watch-outs
- Watch-outs: property tax is 3.9% of price; built in 1930 — expect roof / HVAC / electrical / plumbing capex.
Questions for the listing agent
- It's been on market 42 days. Have you received any prior offers? Is the seller open to a 3% concession, seller financing, or rate buy-down credit?
- Built in 1930 — when were the roof, HVAC, electrical panel, plumbing, and water heater last replaced?
- Property tax is high relative to price — has the assessment been appealed recently, and will the sale trigger a re-assessment?
- Is there a deadline driving the sale (1031 exchange, divorce, estate, relocation)? That informs how much negotiation room exists.
- Schools are D-rated, which usually means shorter tenancies and higher turnover. Who's the typical renter profile here, and what's been the actual vacancy rate?
- Crime grade is F in this area — have there been break-ins, vandalism, or insurance claims at this property in the last 3 years? What carrier currently insures it and at what premium?
- What's the average days-on-market for RENTAL listings here right now (not sales)? A rising rental-DOM trend means longer vacancies and softer asking-rent achievability than the comps imply.
- What's the recent tenant-quality profile in this submarket — average credit score on applications, eviction rate, late-payment / NSF rate, and stable-employment percentage? A property-management company in the area should have these aggregated.
- How much new for-sale + rental construction is in the pipeline within 1–3 miles? Heavy new supply typically softens prices + rents 12–24 months out; constrained supply supports both.
Investment metrics
- 1% rule
- 1.21% ✓
- Cap rate
- 7.01%
- Cash-on-cash
- 2.56%
- DSCR
- 1.11
- GRM
- 6.9
CMA / ARV
- ARV (on-the-fly)
- $171,892
- Comps found
- 12
Show comp detail 12 sales within ~0.75 mi
| Address | Dist | Beds/Ba | Sqft | Sold | Price | $/sf | Match |
|---|---|---|---|---|---|---|---|
| 85 Mill St | 0.21mi | 4/2.0 (+1) | 1,825 (+4%) | 5mo | $228,247 | $125 | 72 |
| 18 Kress St | 0.20mi | 3/1.0 | 1,620 (-8%) | 2mo | $105,000 | $65 | 71 |
| 50 Tremont Ave | 0.34mi | 4/1.5 (+1) | 1,725 (-2%) | 4mo | $175,000 | $101 | 69 |
| 25 Duane Ave | 0.35mi | 4/1.5 (+1) | 1,740 (-1%) | 8mo | $170,000 | $98 | 67 |
| 18 Esther Ave | 0.05mi | 4/2.0 (+1) | 1,536 (-12%) | 5mo | $130,000 | $85 | 65 |
| 13 Clarence St | 0.07mi | 3/2.0 | 1,516 (-14%) | 8mo | $195,000 | $129 | 65 |
| 18 Duane Ave | 0.35mi | 4/2.0 (+1) | 1,928 (+10%) | 3mo | $177,000 | $92 | 58 |
| 66 Evans St | 0.55mi | 2/1.0 (-1) | 1,800 (+3%) | 7mo | $115,000 | $64 | 53 |
| 116 Mary St | 0.55mi | 3/2.5 | 1,981 (+13%) | 0mo | $372,000 | $188 | 52 |
| 14 Jackson Ave | 0.67mi | 4/1.0 (+1) | 1,750 (-0%) | 6mo | $133,000 | $76 | 52 |
| 4 Richard Ave | 0.59mi | 3/2.5 | 2,000 (+14%) | 8mo | $315,000 | $158 | 42 |
| 96 Evans St | 0.68mi | 4/2.0 (+1) | 1,551 (-12%) | 3mo | $120,000 | $77 | 40 |
Match score weights: distance 35% · size 25% · config 20% · recency 20%. Top-matched comps best support the ARV.
Projected returns pro-forma
10.0% appreciation · 3.0% rent growth · sell at horizon
- IRR
- 26.2%
- Equity multiple
- 3.09×
- Total profit
- $94,927
- Equity at exit
- $146,393
- IRR
- 23.0%
- Equity multiple
- 7.05×
- Total profit
- $275,137
- Equity at exit
- $315,702
Cash invested: $45,500 (down + closing). Projections, not guarantees.
Landlord ↔ Tenant lean methodology
- Overall (STATE)
- 15 Strongly Tenant-Friendly
- State New York
- 15 Strongly Tenant-Friendly · D+10
- County
- — inherits STATE
- City
- — inherits STATE
ZIP-level market 13903
- Home prices YoY
- 4.3%
- Active inventory
- 112
- Price-to-rent
- 6.9×
Monthly cashflow live
- Estimated rent
- $1,963 high interval (Pro) →
- Mortgage (P&I)
- −$852
- Tax from tax record
- −$534 /mo · $6,404/yr
- Insurance
- −$68
- HOA
- −$0
- Vacancy / Maint / Mgmt
- −$412
- Net cashflow
- $97
Break-even live
UW: 25.0% down · 7.5% · 30yr · 1.5% tax · 5.0% vac · 8.0% maint · 8.0% mgmt
Financing live
Cash to close
- Down payment
- $40,625
- Closing costs
- $4,875
- Reserves months
- —
- Total cash needed
- —
Loan-product check · same deal, 3 products live
Conventional
25% down · 7.5% · 30yr
- Down + closing
- —
- Monthly P&I
- —
- Monthly cashflow
- —
- DSCR
- —
- Eligible?
- —
Personal DTI + credit; lowest rate.
DSCR
20% down · 8.5% · 30yr
- Down + closing
- —
- Monthly P&I
- —
- Monthly cashflow
- —
- DSCR
- —
- Eligible?
- —
No personal income docs; deal must DSCR.
Hard money
10% down · 12.0% · 12mo
- Down + closing
- —
- Monthly P&I
- —
- Monthly cashflow
- —
- DSCR
- —
- Eligible?
- —
Short-term bridge; refi at stabilization.
Rent comps 13 comps
| Address | Beds | Baths | Sqft | Rent | $/sqft | DOM | Units | Dist |
|---|---|---|---|---|---|---|---|---|
| 86 Conklin Ave Binghamton, NY | 3.0 | 1.0 | 1316 | $1,600 | $1.22 | 13d | 1 | 0.33mi |
| 113 Hawley St Binghamton, NY | 4.0 | 1.5 | 1637 | $2,000 | $1.22 | 43d | 1 | 0.67mi |
| 51 2nd St Binghamton, NY | 3.0 | 2.5 | 2333 | $2,200 | $0.94 | 13d | 1 | 0.69mi |
| 31 Indiana St Binghamton, NY | 3.0 | 1.5 | 1232 | $1,500 | $1.22 | 43d | 1 | 0.71mi |
| 33 Fayette St Unit 22 Binghamton, NY | 2.0 | 1.0 | 1350 | $1,100 | $0.81 | 13d | 1 | 0.74mi |
| 136 Court St Unit 2 Binghamton, NY | 4.0 | 1.0 | 1373 | $3,000 | $2.18 | 43d | 1 | 0.76mi |
| 13 Chapin St Binghamton, NY | 4.0 | 3.0 | 2452 | $4,000 | $1.63 | 43d | 1 | 1.13mi |
| 22 Ayres St Binghamton, NY | 4.0 | 2.0 | 2333 | $2,560 | $1.10 | 43d | 1 | 1.18mi |
| 53 Seminary Ave Unit 1 Binghamton, NY | 2.0 | 1.0 | 1722 | $925 | $0.54 | 21d | 1 | 1.31mi |
| 171 Chapin St Unit 1st FL Binghamton, NY | 4.0 | 1.5 | 1400 | $3,000 | $2.14 | 43d | 1 | 1.32mi |
| 198 Chapin St Binghamton, NY | 4.0 | 2.0 | 1500 | $1,700 | $1.13 | 21d | 1 | 1.36mi |
| 26 Johnson Ave Unit 1 Binghamton, NY | 3.0 | 1.0 | 1633 | $1,600 | $0.98 | 43d | 1 | 1.39mi |
| 29 Laurel Ave Unit 2 Binghamton, NY | 3.0 | 1.5 | 1500 | $2,250 | $1.50 | 43d | 1 | 1.42mi |
Listing history 11 events
-
2026-03-12status Pending
-
2026-02-15status Active
-
2026-02-08status Pending
-
2026-01-22$162,500 Active
-
2025-06-29$159,000 Active
-
2024-04-10status Active
-
2024-04-10price $159,000
-
2024-03-27status Pending
-
2024-01-27price $149,000
-
2024-01-06$159,000 Active
-
2002-10-22soldstatus $42,500
ⓘ Source: listings_history table (triggers on properties + properties_extension) + one-shot
backfill from property_details.listing_events for pre-trigger history.
Tax reassessment forecast NY · Partial reset (capped growth)
- Current annual tax
- $6,404 · $534/mo
- Projected year-2 tax
- $6,404 · $534/mo
- Expected delta
- $0/yr ($0/mo · 0.0%)
ⓘ Screening estimate from a state-policy table — verify with the county assessor before closing.
Climate risk First Street
- Flood 1/10 Low FEMA zone X · 0% chance over 30 yrs
- Wildfire 1/10 Low
- Heat 3/10 Moderate 7 d/yr ≥92°F today · 15 d/yr by 30 yrs out
- Wind 2/10 Low 100% chance of damaging wind over 30 yrs
- Air quality 2/10 Low 0 unhealthy d/yr today · 1 by 30 yrs out
Nearby sold comps map
Loading sold comps map…
Walkable amenities ~0.75 mi
Loading nearby amenities…
Taxation est. · year 1
- Rental income
- $23,556
- − Mortgage interest
- −$9,103
- − Property taxes
- −$6,404
- − Insurance
- −$812
- − Repairs & maintenance
- −$1,884
- − Management
- −$1,884
- − Depreciation
- −$4,727
- Taxable loss
- −$1,259
- Est. tax savings @ 24.0%
- +$302
- After-tax cash flow
- $1,469/yr
For passive investors: Depreciation is non-cash, so a rental often shows a tax loss while cash-flowing — sheltering income. Rental losses are passive: they offset passive income freely, and up to $25,000/yr can offset ordinary (W-2) income if you actively participate and your MAGI is under $100k (phasing out to $0 by $150k); unused losses carry forward. On sale, claimed depreciation is recaptured at up to 25%, and gains may owe capital-gains tax (a 1031 exchange can defer both). Figures are a year-1 estimate at your 24.0% rate — not tax advice; consult a CPA.
Schools (NCES district)
- District
- Binghamton City School District
- NCES district ID
- 3604870
- Math proficiency
- 30% ▬ 0.00%
- Reading proficiency
- 44% ▲ 15.00%
- Median HH income
- $30,475
- Composite
- 30.09/100
- National rank
- #6342
- State rank
- #557 of 590 in NY
Livability — Binghamton
- Score
- 78/100
- State rank
- #174
- US rank
- #2710
Category grades
Schools grade is shown separately in the Schools card above.
Census & demographics
- Census place
- Binghamton, NY
- County
- Broome County · 126,805 people
- City population
- 65,170
- Metro
- Binghamton, NY
- Population (ZIP)
- 17,569
- Household income
- $66,278
- Rent vs Own
- Severe rent burden
- 602.0
Population outlook (Broome County) Hauer SSP2
- Today (2025)
- 187,989 people
- By 2030
- 183,066 · -2.6%
- By 2040
- 172,228 · -8.4%
- By 2050
- 163,161 · -13.2%
- By 2075
- 153,641 · -18.3%
- By 2100
- 140,851 · -25.1%
Race, ethnicity, and origin ACS 2023
- Neighborhood character
- Predominantly White (80%)
- Race & ethnicity
- White 80% Black 9% Two or more races 6% Hispanic / Latino 4% Asian 1%
- Common ancestry
- Romanian 6% Slovak 2% Scotch-Irish 2%
- Foreign-born
- 5% · Canada
- Languages at home
- 94% English-only · Spanish 2% Other Indo-European 1% Arabic 1%
Political lean MEDSL · Broome
- 2024 margin
- Toss-up / Even · D 50.2% · R 49.8%
- 2008→2024 swing
- -7.6pp toward R · 2008: 8.0pp · 2024: 0.4pp
- All cycles
- 2024: D+0.4 2020: D+3.5 2016: R+3.7 2012: D+4.6 2008: D+8.0
Not yet ingested
- Civics
- —
Market trends
- HPI YoY
- ▲ 11.68%
- Current HPI
- 286.1001
- Rent YoY
- —
- Metro
- Binghamton, NY
- State GDP YoY
- ▲ 2.60%
- F500 in state
- 92
Industry mix (Fortune 500 HQ in NY)
| Industry | F500 HQs | Revenue |
|---|---|---|
| Financial Services | 10 | $950B |
|
||
| Consumer Goods | 9 | $162B |
|
||
| Insurance | 4 | $225B |
|
||
| Telecommunications | 2 | $144B |
|
||
| Pharmaceuticals | 2 | $112B |
|
||
| Media / Entertainment | 2 | $69B |
|
||
Price history
+282.4% since first listed11 events — show timeline
- 2026-03-12 Pending — GBAOR
- 2026-02-15 Relisted — GBAOR
- 2026-02-08 Pending — GBAOR
- 2026-01-22 Listed $162,500 GBAOR
- 2025-06-29 Listed $159,000 GBAOR
- 2024-04-10 Relisted — GBAOR
- 2024-04-10 Price Changed $159,000 GBAOR
- 2024-03-27 Pending — GBAOR
- 2024-01-27 Price Changed $149,000 GBAOR
- 2024-01-06 Listed $159,000 GBAOR
- 2002-10-22 Sold (Public Records) $42,500 Public Records
Property tax history
+5.7%/yrLatest (2025): $6,404 · +1.0% YoY. Source: county tax records.
Cash-flow waterfall
monthlySold comps — $/sqft
last 12 mo · ≤1 miLoading sold comps…