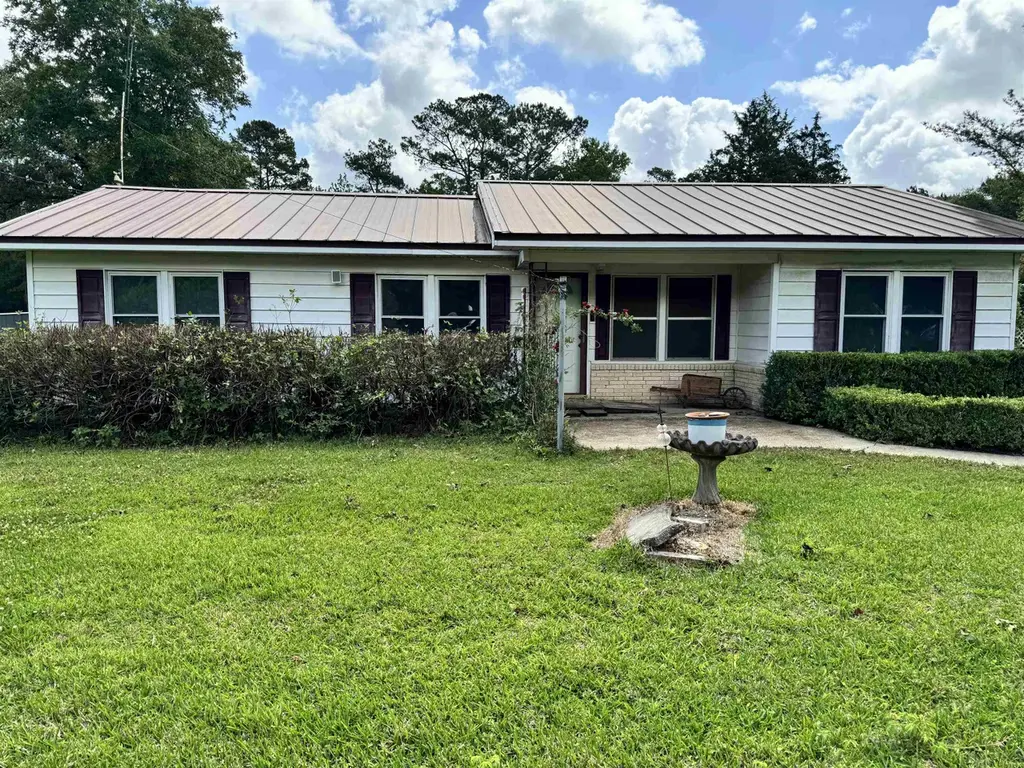
3740 Lakeview Cutoff Rd · Pine Forest, TX
Flood risk 1/10 · Minimal
- FEMA flood zone
- X (shaded)
- Chance of flooding over 30 yrs
- 0.0%
- Est. flood insurance / yr
- $507 – $1,088
Fire risk 5/10 · Moderate
- Est. fire insurance / yr
- $1,222 – $2,270
Heat risk 9/10 · Severe
- Hot days now (above 110°F)
- 7 days/yr
- Hot days in 30 yrs
- 23 days/yr
Wind risk 9/10 · Severe
- Chance of severe wind over 30 yrs
- 99.0%
Air-quality risk 2/10 · Minimal
- Unhealthy air days now
- 1 days/yr
- Unhealthy air days in 30 yrs
- 2 days/yr
Risk factors via First Street. Map © Google.
Why this score? — see what drove the D grade
The composite is a weighted blend of 9 inputs, each scored 0–100. Each bar is that input's sub-score; the figure is the points it added to the 100-point composite (weight × sub-score).
- ARV discount +15.0/15.0
- Cash flow +8.9/30.0
- Schools +3.4/10.0
- Livability +3.2/5.0
- 1% rule +3.0/10.0
- DSCR +2.5/10.0
- Rent growth +2.5/5.0
- Condition / age +2.5/5.0
- Appreciation +0.0/10.0
$188,000
🖨 Deal sheet 📄 Offer letter ✓ Due diligence
Listing remarks
Tucked away like a quiet retreat beneath big Texas skies, this beautifully updated 3-bedroom, 2-bath home sits on 2.55 acres of peaceful, tree-lined property that feels worlds away from the everyday hustle. Step inside to find a spacious layout featuring a generously sized primary suite designed for comfort, while recent updates throughout the home add a fresh, move-in-ready appeal. One of the true highlights is the large, air conditioned sunroom-your all season haven for morning coffee, evening unwinding, or entertaining with a view of the surrounding greenery. Outside, the property really stretches its legs. With two garages offering three car bays plus a dedicated workshop, there's room
Key facts
- 2.55 acre lot
- 5 garage spots
- Listed 10 days
Property features AI
Exterior
- Parking: Attached garage with garage door opener; 5-car garage; 2-car carport
- Security: Smoke detectors
- Utilities: Public water; Well / private water available; Public sewer
- Home design: Single-family residence; Single-story
- Construction: Vinyl siding; Metal roof; Slab foundation; Built on a 2.55-acre lot
- Exterior features: Storm doors; Workshop
Interior
- Kitchen: Refrigerator; Range
- Bathrooms: 2 full bathrooms
- Heating & cooling: Central heating; Electric heating; Wood stove; Central air conditioning; Ceiling fans
- Interior features: Refrigerator; Range
Neighborhood map
What this means for you Summary
Snapshot
- This is a 3-bed/2.0-bath single-family listed at $188k.
Deal economics
- At list price, monthly cash flow is $-152 ($-2k/yr) — negative.
- To cash-flow at today's rent, offer at most $161k (14.3% below list).
- To meet the 1% rule (rent ≥ 1% of price), the offer needs to be $150k (20.0% below list).
- Recommended offer: $150k (20.0% below list) — sets the bar for 1% rule.
Location & tenants
- Location reads 65/100 on livability (#659 in TX) — a middle-class / working-renter tenant base. Strengths: employment A+, cost of living A+, housing A+; Watch: crime D, schools F, amenities F.
- Vidor ISD (suburban): math 41% / reading 39% proficiency, ranked #422 of 826 in TX (top 51%) — families likely to look elsewhere, expect single-tenant / working-renter base with shorter leases.
- Market conditions: 241 active listings in the ZIP; 235 units permitted in Orange County in 2024 (50 in 5+ unit buildings).
Forward outlook
- Local home prices are declining (-3.0%/yr); year-one equity from $1k of loan paydown is wiped out by about $6k of value loss. Plan a longer hold.
- Orange County population projected at +6% by 2050 — modest demand growth; plan on rents tracking national, not racing it.
Negotiation context
- Only 10 days on market — expect competitive offers; lowballing is unlikely to land.
Risks & watch-outs
- Watch-outs: built in 1958 — expect roof / HVAC / electrical / plumbing capex.
- Climate carrying-cost: severe wind risk, 99% chance of damaging wind over 30y; moderate wildfire risk; extreme-heat days projected 7→23/yr by 2055 (HVAC capex compounding) — expect insurance premiums to compound above CPI over the hold.
Questions for the listing agent
- What do current leases actually rent for vs. the listed asking? Can we see a recent rent roll and the last 12 months of T-12 income?
- Built in 1958 — when were the roof, HVAC, electrical panel, plumbing, and water heater last replaced?
- Is there a deadline driving the sale (1031 exchange, divorce, estate, relocation)? That informs how much negotiation room exists.
- Schools are F-rated, which usually means shorter tenancies and higher turnover. Who's the typical renter profile here, and what's been the actual vacancy rate?
- Crime grade is D in this area — have there been break-ins, vandalism, or insurance claims at this property in the last 3 years? What carrier currently insures it and at what premium?
- The area grade is low — what's the realistic commute time and amenity access for the typical tenant pool here? Any planned neighborhood developments (good or bad) we should know about?
- What's the average days-on-market for RENTAL listings here right now (not sales)? A rising rental-DOM trend means longer vacancies and softer asking-rent achievability than the comps imply.
- What's the recent tenant-quality profile in this submarket — average credit score on applications, eviction rate, late-payment / NSF rate, and stable-employment percentage? A property-management company in the area should have these aggregated.
- How much new for-sale + rental construction is in the pipeline within 1–3 miles? Heavy new supply typically softens prices + rents 12–24 months out; constrained supply supports both.
Investment metrics
- 1% rule
- 0.80% ✗
- Cap rate
- 5.32%
- Cash-on-cash
- -3.47%
- DSCR
- 0.85
- GRM
- 10.4
CMA / ARV
- ARV (median comp)
- $225,956
- List price
- $188,000
- Delta
- -16.80%
- Verdict
- UNDERPRICED
- Comps
- 6 within 1.0 mi
Show comp detail 1 sale within ~0.75 mi
| Address | Dist | Beds/Ba | Sqft | Sold | Price | $/sf | Match |
|---|---|---|---|---|---|---|---|
| 410 Kennedy Dr | 0.73mi | 3/2.0 | 1,668 (+13%) | 10mo | $235,000 | $141 | 36 |
Match score weights: distance 35% · size 25% · config 20% · recency 20%. Top-matched comps best support the ARV.
Projected returns pro-forma
-3.0% appreciation · 3.0% rent growth · sell at horizon
- IRR
- -22.1%
- Equity multiple
- 0.24×
- Total profit
- $-40,120
- Equity at exit
- $28,031
- IRR
- -16.0%
- Equity multiple
- 0.10×
- Total profit
- $-47,237
- Equity at exit
- $16,255
Cash invested: $52,640 (down + closing). Projections, not guarantees.
Landlord ↔ Tenant lean methodology
- Overall (STATE)
- 87 Strongly Landlord-Friendly
- State Texas
- 87 Strongly Landlord-Friendly · R+5
- County
- — inherits STATE
- City
- — inherits STATE
ZIP-level market 77662
- Active inventory
- 241
- Price-to-rent
- 10.4×
Monthly cashflow live
- Estimated rent
- $1,503 medium interval (Pro) →
- Mortgage (P&I)
- −$986
- Tax from tax record
- −$276 /mo · $3,309/yr
- Insurance
- −$78
- HOA
- −$0
- Vacancy / Maint / Mgmt
- −$316
- Net cashflow
- $-152
Break-even live
UW: 25.0% down · 7.5% · 30yr · 1.5% tax · 5.0% vac · 8.0% maint · 8.0% mgmt
Financing live
Cash to close
- Down payment
- $47,000
- Closing costs
- $5,640
- Reserves months
- —
- Total cash needed
- —
Loan-product check · same deal, 3 products live
Conventional
25% down · 7.5% · 30yr
- Down + closing
- —
- Monthly P&I
- —
- Monthly cashflow
- —
- DSCR
- —
- Eligible?
- —
Personal DTI + credit; lowest rate.
DSCR
20% down · 8.5% · 30yr
- Down + closing
- —
- Monthly P&I
- —
- Monthly cashflow
- —
- DSCR
- —
- Eligible?
- —
No personal income docs; deal must DSCR.
Hard money
10% down · 12.0% · 12mo
- Down + closing
- —
- Monthly P&I
- —
- Monthly cashflow
- —
- DSCR
- —
- Eligible?
- —
Short-term bridge; refi at stabilization.
Listing history 3 events
-
2026-05-05status Pending 974-char remark
-
2026-04-25$188,000 Active 974-char remark
-
2011-10-04soldstatus
ⓘ Source: listings_history table (triggers on properties + properties_extension) + one-shot
backfill from property_details.listing_events for pre-trigger history.
Tax reassessment forecast TX · Resets to sale price
- Current annual tax
- $3,309 · $276/mo
- Projected year-2 tax
- $3,440 · $287/mo
- Expected delta
- +$131/yr (+$11/mo · 4.0%)
ⓘ Screening estimate from a state-policy table — verify with the county assessor before closing.
Climate risk First Street
- Flood 1/10 Low FEMA zone X (shaded) · 0% chance over 30 yrs
- Wildfire 5/10 Major
- Heat 9/10 Extreme 7 d/yr ≥110°F today · 23 d/yr by 30 yrs out
- Wind 9/10 Extreme 99% chance of damaging wind over 30 yrs
- Air quality 2/10 Low 1 unhealthy d/yr today · 2 by 30 yrs out
Nearby sold comps map
Loading sold comps map…
Walkable amenities ~0.75 mi
Loading nearby amenities…
Taxation est. · year 1
- Rental income
- $18,040
- − Mortgage interest
- −$10,531
- − Property taxes
- −$3,309
- − Insurance
- −$940
- − Repairs & maintenance
- −$1,443
- − Management
- −$1,443
- − Depreciation
- −$5,469
- Taxable loss
- −$5,096
- Est. tax savings @ 24.0%
- +$1,223
- After-tax cash flow
- $-605/yr
For passive investors: Depreciation is non-cash, so a rental often shows a tax loss while cash-flowing — sheltering income. Rental losses are passive: they offset passive income freely, and up to $25,000/yr can offset ordinary (W-2) income if you actively participate and your MAGI is under $100k (phasing out to $0 by $150k); unused losses carry forward. On sale, claimed depreciation is recaptured at up to 25%, and gains may owe capital-gains tax (a 1031 exchange can defer both). Figures are a year-1 estimate at your 24.0% rate — not tax advice; consult a CPA.
Schools (NCES district)
- District
- Vidor ISD
- NCES district ID
- 4844160
- Math proficiency
- 41% ▼ -6.00%
- Reading proficiency
- 39% ▲ 1.00%
- Median HH income
- $44,169
- Composite
- 33.95/100
- National rank
- #5331
- State rank
- #422 of 826 in TX
Livability — Pine Forest
- Score
- 65/100
- State rank
- #659
- US rank
- #12393
Category grades
Schools grade is shown separately in the Schools card above.
Census & demographics
- Census place
- Pine Forest, TX
- County
- Orange County · 87,112 people
- Metro
- Beaumont-Port Arthur, TX
- Population (ZIP)
- 25,041
- Household income
- $72,243
- Rent vs Own
- Severe rent burden
- 401.0
Population outlook (Orange County) Hauer SSP2
- Today (2025)
- 88,065 people
- By 2030
- 89,591 · +1.7%
- By 2040
- 91,982 · +4.4%
- By 2050
- 93,023 · +5.6%
- By 2075
- 94,871 · +7.7%
- By 2100
- 88,155 · +0.1%
Race, ethnicity, and origin ACS 2023
- Neighborhood character
- Predominantly White (88%)
- Race & ethnicity
- White 88% Hispanic / Latino 6% Two or more races 6%
- Hispanic origin (detail)
- Mexican 5%
- Common ancestry
- Lithuanian 15% Slovak 1% Italian 1%
- Foreign-born
- 3% · Canada
- Languages at home
- 93% English-only · Spanish 4% Other Indo-European 1% Other Asian/Pacific 1%
Political lean MEDSL · Orange
- 2024 margin
- Solid R (+66.8) · D 16.4% · R 83.1%
- 2008→2024 swing
- -19.6pp toward R · 2008: -47.1pp · 2024: -66.8pp
- All cycles
- 2024: R+66.8 2020: R+63.4 2016: R+61.9 2012: R+54.3 2008: R+47.1
Not yet ingested
- Civics
- —
Market trends
- HPI YoY
- ▼ -116.46%
- Current HPI
- 141.0844
- Rent YoY
- —
- Metro
- Beaumont-Port Arthur, TX
- State GDP YoY
- ▲ 3.95%
- F500 in state
- 110
Industry mix (Fortune 500 HQ in TX)
| Industry | F500 HQs | Revenue |
|---|---|---|
| Energy | 16 | $1,198B |
|
||
| Technology | 5 | $198B |
|
||
| Engineering / Construction | 4 | $72B |
|
||
| Energy Services | 3 | $60B |
|
||
| Utilities | 3 | $41B |
|
||
| Healthcare | 2 | $330B |
|
||
Price history
3 events — show timeline
- 2026-05-05 Pending — BBOR
- 2026-04-25 Listed $188,000 BBOR
- 2011-10-04 Sold (Public Records) — Public Records
Property tax history
+5.4%/yrLatest (2025): $3,309 · +21.3% YoY. Source: county tax records.
Cash-flow waterfall
monthlySold comps — $/sqft
last 12 mo · ≤1 miLoading sold comps…