2427 Rambo Dr · San Antonio, TX
Flood risk 1/10 · Minimal
- FEMA flood zone
- X (unshaded)
- Chance of flooding over 30 yrs
- 0.0%
- Est. flood insurance / yr
- $507 – $1,088
Fire risk 5/10 · Moderate
- Est. fire insurance / yr
- $1,222 – $2,270
Heat risk 8/10 · Major
- Hot days now (above 109°F)
- 6 days/yr
- Hot days in 30 yrs
- 19 days/yr
Wind risk 8/10 · Major
- Chance of severe wind over 30 yrs
- 80.0%
Air-quality risk 2/10 · Minimal
- Unhealthy air days now
- 0 days/yr
- Unhealthy air days in 30 yrs
- 1 days/yr
Risk factors via First Street. Map © Google.
Why this score? — see what drove the C- grade
The composite is a weighted blend of 9 inputs, each scored 0–100. Each bar is that input's sub-score; the figure is the points it added to the 100-point composite (weight × sub-score).
- ARV discount +15.0/15.0
- Appreciation +10.0/10.0
- Cash flow +9.2/30.0
- Livability +4.0/5.0
- 1% rule +3.0/10.0
- Rent growth +2.7/5.0
- DSCR +2.6/10.0
- Schools +2.2/10.0
- Condition / age +2.2/5.0
$209,990
🖨 Deal sheet 📄 Offer letter ✓ Due diligence
Listing remarks MLS
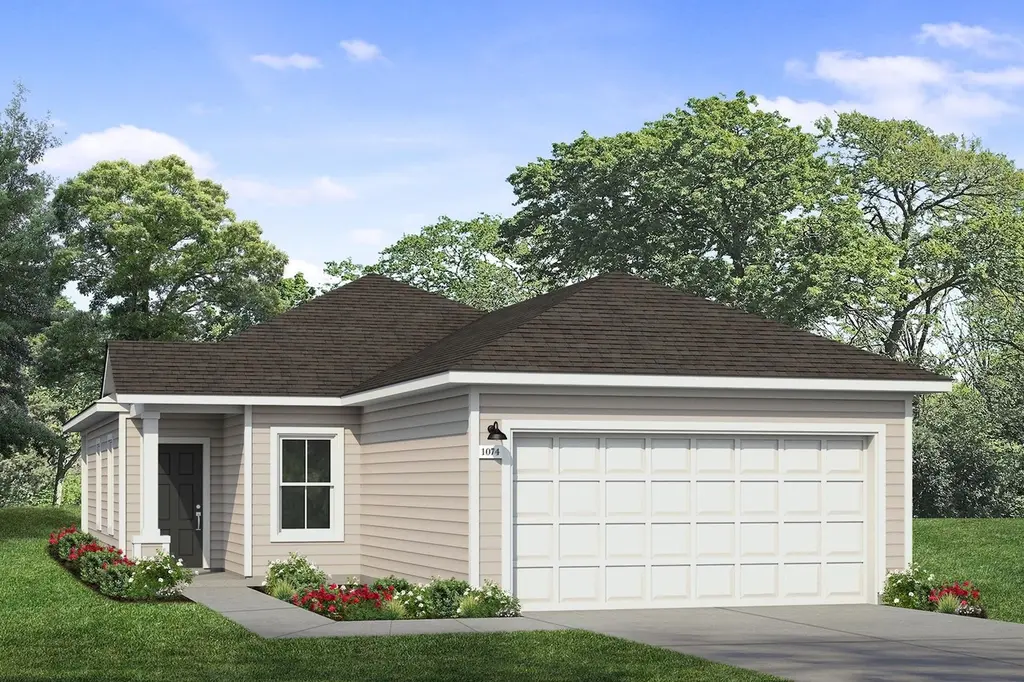
Welcome to 2427 Rambo Drive located in Applewhite Meadows, a coming soon Brohn Homes community in San Antonio! Inside, you'll be greeted by an open concept living space, light-filled interior, and modern finishes such as the wood-look vinyl throughout the main living areas. Enter the kitchen where you'll find 30-inch upper cabinets, 3cm Blanco Atlantico granite countertops, sleek black appliances, and a charming window just above the single basin sink. Retire to the primary suite and unwind with a walk-in closet, semi-private water closet, dual vanity, and a walk-in shower. Enjoy other amazing highlights such as white cabinets with nickel hardware throughout, a convenient utility closet, and silestone bathroom vanities. Applewhite Meadows offers a fresh opportunity to enjoy modern living on San Antonio's South Side, with thoughtfully designed homes, family-friendly amenities, and convenient access to everything the city has to offer. Built by Brohn Homes, this community delivers comfort, quality, and lasting value-making it an ideal place to call home.
Key facts
- Black appliances
- Modern finishes
- Walk in closet
Tags
Property features AI
Finance
- HOA & community: Homeowners association (Applewhite Meadows HOA); Quarterly HOA fee; Association fee covers common area maintenance; Community pool; Common grounds/area; Playground; Curbs and street lights
Exterior
- Parking: Attached garage with inside entrance; Single garage door; Garage faces front; Driveway parking; 2 covered parking spaces (2 total)
- Security: Smoke detector(s)
- Utilities: Municipal water; Municipal sewer (Municipal Utility District); Electricity available; Cable available; Phone available; Underground utilities
- Home design: Single-story; New construction; Faces south; Builder: Brohn Homes
- Construction: Built by builder (new construction); Frame, HardiPlank, glass and concrete construction; Composition/shingle roof; Slab foundation
- Exterior features: Private entrance; Private yard; Front yard; Back yard; Front porch; Porch; Privacy fencing; Automatic sprinklers (front, rear, side; in-ground); Interior lot
Interior
- Kitchen: Dishwasher; Disposal; Microwave
- Bedrooms: 3 main-level bedrooms; Main level primary
- Flooring: Carpet; Vinyl
- Bathrooms: 2 full bathrooms
- Heating & cooling: Central heating; Central air conditioning
- Interior features: Open floorplan; Entrance foyer; Eat-in kitchen; Granite counters; Pantry; Recessed lighting; Double vanity; No interior steps; Walk-in closet(s); Double pane windows
- Laundry & utility: Main-level laundry room with washer hookup; Inside laundry
Neighborhood map
What this means for you Summary
Snapshot
- This is a 3-bed/2.0-bath single-family listed at $210k. Condition is rated fair.
Deal economics
- At list price, monthly cash flow is $-156 ($-2k/yr) — negative.
- To cash-flow at today's rent, offer at most $187k (10.7% below list).
- To meet the 1% rule (rent ≥ 1% of price), the offer needs to be $169k (19.6% below list).
- Recommended offer: $169k (19.6% below list) — sets the bar for 1% rule.
- Cap rate 5.4% vs local median 3.8% in San Antonio — top-decile yield for the area; either an underpriced asset or a hidden risk that comps aren't pricing in. Stress-test before assuming the spread holds.
Location & tenants
- Location reads 80/100 on livability (#31 in TX, #1,616 nationally) — a professional / high-income tenant draw. Strengths: amenities A+, commute A+, cost of living A+; Watch: schools C-, crime F.
- Southwest ISD (rural): math 21% / reading 31% proficiency, ranked #701 of 826 in TX (top 85%) — low school quality limits family demand, transient renter base, plan for 1-2y turnover; 75% free/reduced lunch — lower-income household profile, screen leases tightly.
- Market conditions: Rents flat; 274 active listings in the ZIP; 33 comparable units currently listed for rent nearby; rentals at typical pace (median 22d on market — plan ~3-4 weeks tenant-placement turnaround); 8,308 units permitted in Bexar County in 2024 (2,506 in 5+ unit buildings).
- This rent runs 34% of the median local income ($60k/yr) — at the standard rent-burdened threshold; future hikes will face affordability resistance.
Forward outlook
- In year one you build about $22k of equity ($1k loan paydown + $21k appreciation (10.0% local appreciation)).
- Bexar County population projected at +50% by 2050 — long-run rental-demand tailwind backs the buy-and-hold thesis.
- By year 2, paydown + projected appreciation supports a ~$36k cash-out refi (75% LTV) — recoverable capital for the next deal without selling this one.
Negotiation context
- It's been on market 45 days — a 3% lower offer ($204k) is reasonable based on typical stale-listing flexibility.
- 2 sale attempts with the ask held roughly flat each time — persistent listings suggest the price (not the market) is what's stuck; bring a comps-based counter.
Risks & watch-outs
- Climate carrying-cost: severe wind risk, 80% chance of damaging wind over 30y; moderate wildfire risk; extreme-heat days projected 6→19/yr by 2055 (HVAC capex compounding) — expect insurance premiums to compound above CPI over the hold.
Questions for the listing agent
- What do current leases actually rent for vs. the listed asking? Can we see a recent rent roll and the last 12 months of T-12 income?
- It's been on market 45 days. Have you received any prior offers? Is the seller open to a 20% concession, seller financing, or rate buy-down credit?
- Have any recent inspections been done? Can we get a copy of the seller's disclosures and any deferred-maintenance estimates?
- What does the HOA fee cover, when was the last increase, and are there any pending special assessments or reserve-fund shortfalls?
- Is there a deadline driving the sale (1031 exchange, divorce, estate, relocation)? That informs how much negotiation room exists.
- Crime grade is F in this area — have there been break-ins, vandalism, or insurance claims at this property in the last 3 years? What carrier currently insures it and at what premium?
- What's the average days-on-market for RENTAL listings here right now (not sales)? A rising rental-DOM trend means longer vacancies and softer asking-rent achievability than the comps imply.
- What's the recent tenant-quality profile in this submarket — average credit score on applications, eviction rate, late-payment / NSF rate, and stable-employment percentage? A property-management company in the area should have these aggregated.
- How much new for-sale + rental construction is in the pipeline within 1–3 miles? Heavy new supply typically softens prices + rents 12–24 months out; constrained supply supports both.
Investment metrics
- 1% rule
- 0.80% ✗
- Cap rate
- 5.40%
- Cash-on-cash
- -3.18%
- DSCR
- 0.86
- GRM
- 10.4
CMA / ARV
- ARV (median comp)
- $253,438
- List price
- $209,990
- Delta
- -17.14%
- Verdict
- UNDERPRICED
- Comps
- 20 within 1.0 mi
Show comp detail 9 sales within ~0.75 mi
| Address | Dist | Beds/Ba | Sqft | Sold | Price | $/sf | Match |
|---|---|---|---|---|---|---|---|
| 2130 Bigmouth Rod | 0.43mi | 3/2.0 | 1,125 (+5%) | 2mo | $175,000 | $156 | 70 |
| 2338 Pink Pearl | 0.11mi | 3/2.0 | 1,200 (+12%) | 8mo | $262,226 | $219 | 69 |
| 2422 Dry Moss Way | 0.07mi | 2/1.5 (-1) | 1,036 (-4%) | 21mo | $199,990 | $193 | 67 |
| 10707 Musket | 0.65mi | 3/1.0 | 1,088 (+1%) | 10mo | $182,000 | $167 | 55 |
| 3023 Bay Hurst | 0.63mi | 3/2.0 | 1,022 (-5%) | 14mo | $175,000 | $171 | 51 |
| 3058 Moss Spring Dr | 0.74mi | 3/2.0 | 1,141 (+6%) | 14mo | $190,000 | $167 | 44 |
| 2118 Dry Moss | 0.43mi | 3/2.0 | 1,235 (+15%) | 18mo | $260,000 | $211 | 40 |
| 11307 Gaylord Dr | 0.73mi | 2/2.0 (-1) | 1,189 (+11%) | 9mo | $197,000 | $166 | 36 |
| 11319 Gaylord Dr | 0.74mi | 3/1.0 | 912 (-15%) | 3mo | $140,000 | $154 | 34 |
Match score weights: distance 35% · size 25% · config 20% · recency 20%. Top-matched comps best support the ARV.
Projected returns pro-forma
10.0% appreciation · 0.83% rent growth · sell at horizon
- IRR
- 21.4%
- Equity multiple
- 2.72×
- Total profit
- $100,891
- Equity at exit
- $189,176
- IRR
- 18.8%
- Equity multiple
- 6.07×
- Total profit
- $298,308
- Equity at exit
- $407,964
Cash invested: $58,797 (down + closing). Projections, not guarantees.
Landlord ↔ Tenant lean methodology
- Overall (STATE)
- 87 Strongly Landlord-Friendly
- State Texas
- 87 Strongly Landlord-Friendly · R+5
- County
- — inherits STATE
- City
- — inherits STATE
ZIP-level market 78224
- Home prices YoY
- 12.4%
- Rents YoY
- 0.8%
- Active inventory
- 274
- Price-to-rent
- 10.4×
Monthly cashflow live
- Estimated rent
- $1,689 high interval (Pro) →
- Mortgage (P&I)
- −$1,101
- Tax est. 1.5%
- −$262 /mo · $3,150/yr
- Insurance
- −$87
- HOA
- −$39
- Vacancy / Maint / Mgmt
- −$355
- Net cashflow
- $-156
Break-even live
UW: 25.0% down · 7.5% · 30yr · 1.5% tax · 5.0% vac · 8.0% maint · 8.0% mgmt
Financing live
Cash to close
- Down payment
- $52,498
- Closing costs
- $6,300
- Reserves months
- —
- Total cash needed
- —
Loan-product check · same deal, 3 products live
Conventional
25% down · 7.5% · 30yr
- Down + closing
- —
- Monthly P&I
- —
- Monthly cashflow
- —
- DSCR
- —
- Eligible?
- —
Personal DTI + credit; lowest rate.
DSCR
20% down · 8.5% · 30yr
- Down + closing
- —
- Monthly P&I
- —
- Monthly cashflow
- —
- DSCR
- —
- Eligible?
- —
No personal income docs; deal must DSCR.
Hard money
10% down · 12.0% · 12mo
- Down + closing
- —
- Monthly P&I
- —
- Monthly cashflow
- —
- DSCR
- —
- Eligible?
- —
Short-term bridge; refi at stabilization.
Rent comps 33 comps
| Address | Beds | Baths | Sqft | Rent | $/sqft | DOM | Units | Dist |
|---|---|---|---|---|---|---|---|---|
| 2350 Dry Moss Way San Antonio, TX | 3.0 | 2.5 | 1420 | $1,650 | $1.16 | 43d | 1 | 0.12mi |
| 2350 Redlove Dr San Antonio, TX | 3.0 | 2.5 | 1420 | $1,675 | $1.18 | 24d | 1 | 0.20mi |
| 10610 Apple Pie Rd San Antonio, TX | 3.0 | 2.5 | 1272 | $1,595 | $1.25 | 24d | 1 | 0.21mi |
| 2330 Redlove Dr San Antonio, TX | 3.0 | 2.5 | 1420 | $1,600 | $1.13 | 4d | 1 | 0.22mi |
| 2026 Bigmouth Rod San Antonio, TX | 4.0 | 2.5 | 1383 | $1,650 | $1.19 | 4d | 1 | 0.51mi |
| 10127 Texas 16 Unit 710 San Antonio, TX | 2.0 | 2.0 | 950 | $807 | $0.85 | 16d | 1 | 0.67mi |
| 10127 State Highway 16 S San Antonio, TX | 2.0–4.0 | 2.0 | 1125 | $1,200 | $1.07 | 2d | 26 | 0.67mi |
| 11318 Clearmine St #101 San Antonio, TX | 3.0 | 2.5 | 1362 | $1,700 | $1.25 | 12d | 1 | 0.70mi |
| 11318 Clearmine St Unit 104 South Southwest, TX | 3.0 | 2.5 | 1362 | $1,700 | $1.25 | 43d | 1 | 0.70mi |
| 11318 Clearmine St Unit 103 South Southwest, TX | 3.0 | 2.5 | 1362 | $1,514 | $1.11 | 43d | 1 | 0.70mi |
| 11326 Clearmine St Unit 104 San Antonio, TX | 3.0 | 2.5 | 1362 | $1,614 | $1.19 | 43d | 1 | 0.72mi |
| 11327 Clearmine San Antonio, TX | 3.0 | 2.5 | 1362 | $1,650 | $1.21 | 1d | 2 | 0.74mi |
| 11009 Valley Star Dr San Antonio, TX | 4.0 | 1.5 | 1004 | $1,450 | $1.44 | 4d | 1 | 0.83mi |
| 12305 SW Loop 410 San Antonio, TX | 1.0–4.0 | 1.0–2.0 | 1036 | $1,318 | $1.27 | 16d | 1 | 0.91mi |
| 3263 Rancho Grande San Antonio, TX | 3.0 | 2.0 | 1500 | $1,650 | $1.10 | 24d | 1 | 0.92mi |
| 10210 S Zarzamora St San Antonio, TX | 2.0–4.0 | 2.0 | 1139 | $1,460 | $1.28 | 1d | 1 | 1.02mi |
| 10815 Bernal Cv San Antonio, TX | 3.0 | 2.0 | 1266 | $1,550 | $1.22 | 24d | 1 | 1.05mi |
| 10507 Padron Bnd San Antonio, TX | 3.0 | 2.0 | 1266 | $1,600 | $1.26 | 43d | 1 | 1.06mi |
| 10414 Espada Pass San Antonio, TX | 3.0 | 2.0 | 1416 | $1,600 | $1.13 | 43d | 1 | 1.10mi |
| 1442 Mira Ml San Antonio, TX | 3.0 | 2.0 | 1266 | $1,545 | $1.22 | 43d | 1 | 1.15mi |
| 10542 Nye Pass San Antonio, TX | 3.0 | 2.0 | 1440 | $1,595 | $1.11 | 43d | 1 | 1.15mi |
| 3411 Avoca Dr San Antonio, TX | 3.0 | 2.0 | 1426 | $1,460 | $1.02 | 4d | 1 | 1.18mi |
| 3411 Avoca Dr San Antonio, TX | 3.0 | 2.0 | 1426 | $1,460 | $1.02 | 17d | 1 | 1.18mi |
| 1355 Neria Loop San Antonio, TX | 3.0 | 2.0 | 1266 | $1,575 | $1.24 | 43d | 1 | 1.18mi |
| 9514 Veronica St San Antonio, TX | 3.0 | 2.0 | 1455 | $1,450 | $1.00 | 2d | 1 | 1.21mi |
| 1402 Bertha Br San Antonio, TX | 3.0 | 2.0 | 1276 | $1,700 | $1.33 | 24d | 1 | 1.22mi |
| 10119 Ana Hts San Antonio, TX | 3.0 | 2.0 | 1266 | $1,550 | $1.22 | 11d | 1 | 1.23mi |
| 10018 Ana Hts San Antonio, TX | 3.0 | 2.0 | 1266 | $1,550 | $1.22 | 16d | 1 | 1.27mi |
| 3439 Twining Dr San Antonio, TX | 3.0 | 1.0 | 1124 | $1,500 | $1.33 | 17d | 1 | 1.29mi |
| 10007 Kersey Ml San Antonio, TX | 3.0 | 2.0 | 1440 | $1,495 | $1.04 | 43d | 1 | 1.30mi |
| 10750 Twyla Rd San Antonio, TX | 3.0 | 2.0 | 1402 | $1,750 | $1.25 | 16d | 1 | 1.30mi |
| 10042 Kersey Ml San Antonio, TX | 3.0 | 2.0 | 1450 | $1,650 | $1.14 | 22d | 1 | 1.31mi |
| 10203 Asta Trl San Antonio, TX | 3.0 | 2.0 | 1276 | $1,800 | $1.41 | 24d | 1 | 1.33mi |
HOA detail
- Monthly dues
- $39 · $468/yr
- Likely covers
- water
Listing history 15 events
-
2026-06-18days on market $209,990 Active 45 DOM
-
2026-06-17days on market $209,990 Active 44 DOM
-
2026-06-16days on market $209,990 Active 43 DOM
-
2026-06-15days on market $209,990 Active 42 DOM
-
2026-06-13days on market $209,990 Active 40 DOM
-
2026-06-09days on market $209,990 Active 36 DOM
-
2026-06-08days on market $209,990 Active 35 DOM
-
2026-06-07days on market $209,990 Active 34 DOM
-
2026-06-04days on market $209,990 Active 31 DOM
-
2026-06-03days on market $209,990 Active 30 DOM
-
2026-06-02days on market $209,990 Active 29 DOM
-
2026-06-01days on market $209,990 Active 28 DOM
-
2026-05-31days on market $209,990 Active 27 DOM
-
2026-05-04$209,990 Active 1092-char remark
-
2026-03-22$209,990 Active 1068-char remark
Show marketing remark (1068 chars)
Welcome to 2427 Rambo Drive located in Applewhite Meadows, a coming soon Brohn Homes community in San Antonio! Inside, you'll be greeted by an open concept living space, light-filled interior, and modern finishes such as the wood-look vinyl throughout the main living areas. Enter the kitchen where you'll find 30-inch upper cabinets, 3cm Blanco Atlantico granite countertops, sleek black appliances, and a charming window just above the single basin sink. Retire to the primary suite and unwind with a walk-in closet, semi-private water closet, dual vanity, and a walk-in shower. Enjoy other amazing highlights such as white cabinets with nickel hardware throughout, a convenient utility closet, and silestone bathroom vanities. Applewhite Meadows offers a fresh opportunity to enjoy modern living on San Antonio's South Side, with thoughtfully designed homes, family-friendly amenities, and convenient access to everything the city has to offer. Built by Brohn Homes, this community delivers comfort, quality, and lasting value-making it an ideal place to call home.
ⓘ Source: listings_history table (triggers on properties + properties_extension) + one-shot
backfill from property_details.listing_events for pre-trigger history.
Climate risk First Street
- Flood 1/10 Low FEMA zone X (unshaded) · 0% chance over 30 yrs
- Wildfire 5/10 Major
- Heat 8/10 Severe 6 d/yr ≥109°F today · 19 d/yr by 30 yrs out
- Wind 8/10 Severe 80% chance of damaging wind over 30 yrs
- Air quality 2/10 Low 0 unhealthy d/yr today · 1 by 30 yrs out
Nearby sold comps map
Loading sold comps map…
Walkable amenities ~0.75 mi
Loading nearby amenities…
Taxation est. · year 1
- Rental income
- $20,271
- − Mortgage interest
- −$11,763
- − Property taxes
- −$3,150
- − Insurance
- −$1,050
- − Repairs & maintenance
- −$1,622
- − Management
- −$1,622
- − HOA
- −$468
- − Depreciation
- −$6,109
- Taxable loss
- −$5,511
- Est. tax savings @ 24.0%
- +$1,323
- After-tax cash flow
- $-545/yr
For passive investors: Depreciation is non-cash, so a rental often shows a tax loss while cash-flowing — sheltering income. Rental losses are passive: they offset passive income freely, and up to $25,000/yr can offset ordinary (W-2) income if you actively participate and your MAGI is under $100k (phasing out to $0 by $150k); unused losses carry forward. On sale, claimed depreciation is recaptured at up to 25%, and gains may owe capital-gains tax (a 1031 exchange can defer both). Figures are a year-1 estimate at your 24.0% rate — not tax advice; consult a CPA.
Condition & rehab AI · 2 photos
The home requires significant repairs to the roof and exterior, along with landscaping and painting. These updates will significantly increase its resale and rental value.
Repairs flagged
- Major roof — Significant wear and tear on the roof.
- Major exterior siding — Aerial view shows siding damage and potential water damage.
- Major landscaping — Overgrown landscaping and lack of curb appeal.
- Minor foundation — No visible structural issues in the listing photos.
- Minor windows — No visible issues in the listing photos, but potential water damage in the aerial view.
Value-add opportunities
- Resale repair roof — A repaired roof will significantly increase the home's value.
- Rental landscape and curb appeal — A well-maintained and attractive exterior will attract renters.
- Both paint exterior — Fresh paint will improve the home's curb appeal and resale value.
Renovation cost estimate screening
| Repair item | Severity | Est. cost |
|---|---|---|
| roof · Significant wear and tear on the roof. | Major | $15,000–50,000 |
| exterior siding · Aerial view shows siding damage and potential water damage. | Major | $15,000–50,000 |
| landscaping · Overgrown landscaping and lack of curb appeal. | Major | $15,000–50,000 |
| foundation · No visible structural issues in the listing photos. | Minor | $500–3,000 |
| windows · No visible issues in the listing photos, but potential water damage in the aerial view. | Minor | $500–3,000 |
| Total estimated repair cost · 5 items | $46,000–156,000 |
Value-add ROI direction
- Resale repair roof — A repaired roof will significantly increase the home's value. ↑
- Rental landscape and curb appeal — A well-maintained and attractive exterior will attract renters. ↑
- Both paint exterior — Fresh paint will improve the home's curb appeal and resale value. ↑
ⓘ Cost ranges are severity-bucket heuristics (US national rule-of-thumb). Get contractor quotes + a written scope before underwriting a rehab budget.
Schools (NCES district)
- District
- Southwest ISD
- NCES district ID
- 4840950
- Math proficiency
- 21% ▼ -21.00%
- Reading proficiency
- 31% ▼ -5.00%
- Median HH income
- $43,362
- Composite
- 22.22/100
- National rank
- #8153
- State rank
- #701 of 826 in TX
Livability — San Antonio
- Score
- 80/100
- State rank
- #31
- US rank
- #1616
Category grades
Schools grade is shown separately in the Schools card above.
Census & demographics
- Census place
- San Antonio, TX
- County
- Bexar County · 1,990,555 people
- City population
- 1,806,925
- Metro
- San Antonio-New Braunfels, TX
- Population (ZIP)
- 22,232
- Household income
- $59,891
- Rent vs Own
- Severe rent burden
- 721.0
Population outlook (Bexar County) Hauer SSP2
- Today (2025)
- 2,336,851 people
- By 2030
- 2,560,728 · +9.6%
- By 2040
- 3,020,569 · +29.3%
- By 2050
- 3,493,522 · +49.5%
- By 2075
- 4,668,459 · +99.8%
- By 2100
- 5,533,242 · +136.8%
Race, ethnicity, and origin ACS 2023
- Neighborhood character
- Predominantly Hispanic (90%)
- Race & ethnicity
- Hispanic / Latino 90% Two or more races 24% White 6% Native American 2% Asian 2%
- Hispanic origin (detail)
- Mexican 75%
- Common ancestry
- Italian 1%
- Foreign-born
- 18% · Canada, Vietnam, China
- Languages at home
- 44% English-only · Spanish 55% Chinese 1%
Political lean MEDSL · Bexar
- 2024 margin
- Lean D (+9.8) · D 54.3% · R 44.6% · Other 1.1%
- 2008→2024 swing
- +4.2pp toward D · 2008: 5.6pp · 2024: 9.8pp
- All cycles
- 2024: D+9.8 2020: D+18.2 2016: D+13.5 2012: D+4.6 2008: D+5.6
Not yet ingested
- Civics
- —
Market trends
- HPI YoY
- ▲ 29.95%
- Current HPI
- 272.0709
- Rent YoY
- ▲ 0.83%
- Metro
- San Antonio-New Braunfels, TX
- State GDP YoY
- ▲ 3.95%
- F500 in state
- 110
Industry mix (Fortune 500 HQ in TX)
| Industry | F500 HQs | Revenue |
|---|---|---|
| Energy | 16 | $1,198B |
|
||
| Technology | 5 | $198B |
|
||
| Engineering / Construction | 4 | $72B |
|
||
| Energy Services | 3 | $60B |
|
||
| Utilities | 3 | $41B |
|
||
| Healthcare | 2 | $330B |
|
||
Price history
+0.0% since first listed2 events — show timeline
- 2026-05-04 Listed $209,990 Unlock MLS
- 2026-03-22 Listed $209,990 Zillow
Cash-flow waterfall
monthlySold comps — $/sqft
last 12 mo · ≤1 miLoading sold comps…