768 E Garden Rd #50 · Vineland, NJ
Flood risk No data
- FEMA flood zone
- —
- Chance of flooding over 30 yrs
- —
- Est. flood insurance / yr
- —
Fire risk No data
- Est. fire insurance / yr
- —
Heat risk No data
- Hot days now (above threshold)
- —
- Hot days in 30 yrs
- —
Wind risk No data
- Chance of severe wind over 30 yrs
- —
Air-quality risk No data
- Unhealthy air days now
- —
- Unhealthy air days in 30 yrs
- —
Risk factors via First Street. Map © Google.
Why this score? — see what drove the B- grade
The composite is a weighted blend of 9 inputs, each scored 0–100. Each bar is that input's sub-score; the figure is the points it added to the 100-point composite (weight × sub-score).
- Cash flow +30.0/30.0
- 1% rule +10.0/10.0
- DSCR +10.0/10.0
- ARV discount +7.5/15.0
- Condition / age +4.0/5.0
- Livability +3.3/5.0
- Rent growth +2.5/5.0
- Schools +1.9/10.0
- Appreciation +0.0/10.0
$112,250
🖨 Deal sheet (PDF) 📄 Offer letter ✓ Due diligence
Listing remarks
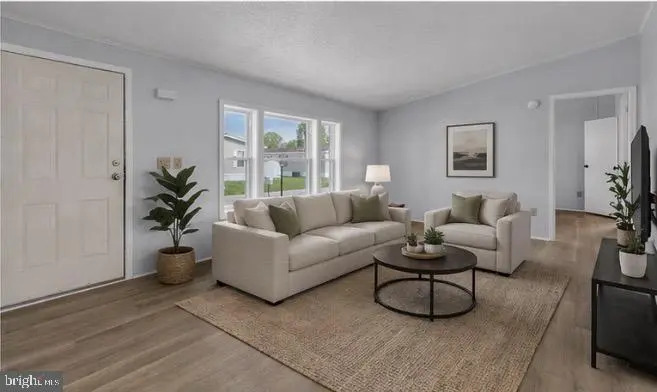
Welcome to this beautifully renovated 2-bedroom, 2-bath home in the highly sought-after Chapman’s community! From the moment you step inside, you’ll appreciate the fresh, modern feel featuring all-new paint, brand new flooring, and stylish light fixtures throughout. The inviting kitchen is both warm and functional, complete with brand new stainless steel appliances, perfect for everyday living and entertaining. High vaulted ceilings create an open, airy atmosphere, while updated bath vanities add a touch of contemporary elegance. A dedicated laundry room provides added convenience. This home is truly move-in ready, with new energy-efficient windows offering comfort and savings y
Key facts
- 2 parking spots
- Built 1992
- Listed 58 days
Property features AI
Finance
- Other: Pets allowed with size/weight restrictions
- Financial info: Improvement assessed value listed (estimated)
- HOA & community: Ground rent applies (monthly); Monthly land lease payment of $741; Ground rent years remaining: 1
Exterior
- Parking: Concrete driveway; Driveway parking with space for 2 vehicles; Total of 2 garage/parking spaces
- Utilities: Public water; Community septic tank; Natural gas service; Electric for cooling
- Home design: Manufactured home (double wide); Estimated year of major renovation: 2026; Land lease ownership
- Construction: Double wide manufactured construction
- Exterior features: Shed; Above grade and below grade structures; Located in Chapman’s Manufactured Housing park
Interior
- Kitchen: Refrigerator; Electric oven/range; Dishwasher
- Bedrooms: 2 bedrooms on the main level
- Bathrooms: 2 full bathrooms (1 on the main level)
- Heating & cooling: Forced air heating (natural gas); Central air conditioning (electric); Natural gas hot water
- Interior features: Energy-efficient windows; No basement; Estimated living area
- Laundry & utility: Washer/dryer hookups
Neighborhood map
What this means for you Summary
Snapshot
- This is a 2-bed/2.0-bath single-family listed at $112k. Condition is rated good.
Deal economics
- At list price, monthly cash flow is $554 ($7k/yr) — positive.
- The deal already cash-flows at list — no discount required.
- Meets the 1% rule at list price ($2k rent vs $112k).
- Recommended offer: $109k (3.0% below list) — sets the bar for market timing.
- Cap rate 12.2% vs local median 4.5% in Vineland — top-decile yield for the area; either an underpriced asset or a hidden risk that comps aren't pricing in. Stress-test before assuming the spread holds.
Location & tenants
- Location reads 66/100 on livability (#363 in NJ) — a middle-class / working-renter tenant base. Strengths: housing A+, health & safety A+; Watch: employment D+, crime F, amenities F.
- Vineland Public School District (urban): math 9% / reading 34% proficiency, ranked #418 of 472 in NJ (top 89%) — low school quality limits family demand, transient renter base, plan for 1-2y turnover.
- Zoned schools: Marie Durand Elementary School (math 6% / reading 34%, grade F, #990 of 1,303 statewide, top 76%, 475 students, 1% FRL); Veterans Memorial Middle (math 7% / reading 38%, grade F, #379 of 431 statewide, top 89%, 638 students, 0% FRL); Vineland Senior High School (math 10% / reading 34%, grade F, #346 of 399 statewide, top 88%, 2,780 students, 0% FRL) — zoned schools average 0% FRL vs 53% district-wide (53 pts lower); this property's tenant base skews higher-income than the district average.
- Market conditions: 176 active listings in the ZIP; 216 units permitted in Cumberland County in 2024 (73 in 5+ unit buildings).
- This rent runs 31% of the median local income ($65k/yr) — at the standard rent-burdened threshold; future hikes will face affordability resistance.
Forward outlook
- Local home prices are declining (-3.0%/yr); year-one equity from $776 of loan paydown is wiped out by about $3k of value loss. Plan a longer hold.
- Cumberland County population projected to shrink 7% by 2050 — rents likely to lag national; underwrite the cash flow, not the appreciation.
- At projected returns (-3.0% appreciation + 3.0% rent growth), your $31k cash investment doubles in ~6 years — after that, you're playing with house money.
Negotiation context
- It's been on market 59 days — a 3% lower offer ($109k) is reasonable based on typical stale-listing flexibility.
Questions for the listing agent
- It's been on market 59 days. Have you received any prior offers? Is the seller open to a 3% concession, seller financing, or rate buy-down credit?
- Is there a deadline driving the sale (1031 exchange, divorce, estate, relocation)? That informs how much negotiation room exists.
- Schools are D-rated, which usually means shorter tenancies and higher turnover. Who's the typical renter profile here, and what's been the actual vacancy rate?
- Crime grade is F in this area — have there been break-ins, vandalism, or insurance claims at this property in the last 3 years? What carrier currently insures it and at what premium?
- What's the average days-on-market for RENTAL listings here right now (not sales)? A rising rental-DOM trend means longer vacancies and softer asking-rent achievability than the comps imply.
- What's the recent tenant-quality profile in this submarket — average credit score on applications, eviction rate, late-payment / NSF rate, and stable-employment percentage? A property-management company in the area should have these aggregated.
- How much new for-sale + rental construction is in the pipeline within 1–3 miles? Heavy new supply typically softens prices + rents 12–24 months out; constrained supply supports both.
Investment metrics
- 1% rule
- 1.50% ✓
- Cap rate
- 12.22%
- Cash-on-cash
- 21.16%
- DSCR
- 1.94
- GRM
- 5.6
CMA / ARV
- ARV (on-the-fly)
- $241,056
- Comps found
- 8
Show comp detail 8 sales within ~0.75 mi
| Address | Dist | Beds/Ba | Sqft | Sold | Price | $/sf | Match |
|---|---|---|---|---|---|---|---|
| 768 E Garden Rd #6 | 0.02mi | 2/2.0 | 1,100 (+13%) | 18mo | $165,000 | $150 | 62 |
| 1263 Sunrise Ave | 0.45mi | 2/1.0 | 1,008 (+4%) | 12mo | $250,000 | $248 | 59 |
| 2871 Alberic St | 0.42mi | 2/1.0 | 840 (-14%) | 0mo | $250,000 | $298 | 54 |
| 2871 Alberic St | 0.43mi | 2/1.0 | 840 (-14%) | 0mo | $250,000 | $298 | 53 |
| 1976 Ne Ave #263 | 0.72mi | 2/2.0 | 970 (-0%) | 22mo | $86,500 | $89 | 48 |
| 1114 Jewel St | 0.37mi | 3/1.0 (+1) | 1,056 (+9%) | 22mo | $295,001 | $279 | 41 |
| 1976 N East Ave Unit 115 (DARLENE DRIVE) | 0.72mi | 2/1.0 | 1,000 (+3%) | 22mo | $50,000 | $50 | 39 |
| 1976 N East Ave Ave #8 | 0.72mi | 2/2.0 | 1,088 (+12%) | 22mo | $79,000 | $73 | 28 |
Match score weights: distance 35% · size 25% · config 20% · recency 20%. Top-matched comps best support the ARV.
Projected returns pro-forma
-3.0% appreciation · 3.0% rent growth · sell at horizon
- IRR
- 13.6%
- Equity multiple
- 1.55×
- Total profit
- $17,131
- Equity at exit
- $16,737
- IRR
- 22.5%
- Equity multiple
- 2.92×
- Total profit
- $60,468
- Equity at exit
- $9,705
Cash invested: $31,430 (down + closing). Projections, not guarantees.
Landlord ↔ Tenant lean methodology
- Overall (STATE)
- 21 Tenant-Leaning
- State New Jersey
- 21 Tenant-Leaning · D+6
- County
- — inherits STATE
- City
- — inherits STATE
ZIP-level market 08360
- Active inventory
- 176
- Price-to-rent
- 5.6×
Monthly cashflow live
- Estimated rent
- $1,683 medium interval (Pro) →
- Mortgage (P&I)
- −$589
- Tax est. 1.5%
- −$140 /mo · $1,684/yr
- Insurance
- −$47
- HOA
- −$0
- Vacancy / Maint / Mgmt
- −$354
- Net cashflow
- $554
Break-even live
Sensitivity live
| Price | -10% $632 | -5% $593 | +0% $554 | +5% $515 | +10% $477 |
|---|---|---|---|---|---|
| Rent | -10% $421 | -5% $488 | +0% $554 | +5% $621 | +10% $687 |
| Rate | -1.0pp $611 | -0.5pp $583 | base $554 | +0.5pp $525 | +1.0pp $495 |
UW: 25.0% down · 7.5% · 30yr · 1.5% tax · 5.0% vac · 8.0% maint · 8.0% mgmt
Financing live
Cash to close
- Down payment
- $28,062
- Closing costs
- $3,368
- Reserves months
- —
- Total cash needed
- —
Loan-product check · same deal, 3 products live
Conventional
25% down · 7.5% · 30yr
- Down + closing
- —
- Monthly P&I
- —
- Monthly cashflow
- —
- DSCR
- —
- Eligible?
- —
Personal DTI + credit; lowest rate.
DSCR
20% down · 8.5% · 30yr
- Down + closing
- —
- Monthly P&I
- —
- Monthly cashflow
- —
- DSCR
- —
- Eligible?
- —
No personal income docs; deal must DSCR.
Hard money
10% down · 12.0% · 12mo
- Down + closing
- —
- Monthly P&I
- —
- Monthly cashflow
- —
- DSCR
- —
- Eligible?
- —
Short-term bridge; refi at stabilization.
Listing history 20 events
-
2026-06-21days on market $112,250 Active 59 DOM
-
2026-06-19days on market $112,250 Active 57 DOM
-
2026-06-18days on market $112,250 Active 56 DOM
-
2026-06-17days on market $112,250 Active 55 DOM
-
2026-06-16days on market $112,250 Active 54 DOM
-
2026-06-15days on market $112,250 Active 53 DOM
-
2026-06-14days on market $112,250 Active 51 DOM
-
2026-06-13days on market $112,250 Active 50 DOM
-
2026-06-10days on market $112,250 Active 48 DOM
-
2026-06-09days on market $112,250 Active 47 DOM
-
2026-06-08days on market $112,250 Active 46 DOM
-
2026-06-07days on market $112,250 Active 45 DOM
-
2026-06-03days on market $112,250 Active 41 DOM
-
2026-06-02days on market $112,250 Active 40 DOM
-
2026-06-01days on market $112,250 Active 39 DOM
-
2026-05-31days on market $112,250 Active 38 DOM
-
2026-05-30days on market $112,250 Active 37 DOM
-
2026-05-20price $112,250
-
2026-04-24$122,250 Active
-
2026-04-23historical $122,250
ⓘ Source: listings_history table (triggers on properties + properties_extension) + one-shot
backfill from property_details.listing_events for pre-trigger history.
Nearby sold comps map
Loading sold comps map…
Walkable amenities ~0.75 mi
Loading nearby amenities…
Taxation est. · year 1
- Rental income
- $20,201
- − Mortgage interest
- −$6,288
- − Property taxes
- −$1,684
- − Insurance
- −$561
- − Repairs & maintenance
- −$1,616
- − Management
- −$1,616
- − Depreciation
- −$3,265
- Taxable income
- $5,171
- Est. tax owed @ 24.0%
- −$1,241
- After-tax cash flow
- $5,409/yr
For passive investors: Depreciation is non-cash, so a rental often shows a tax loss while cash-flowing — sheltering income. Rental losses are passive: they offset passive income freely, and up to $25,000/yr can offset ordinary (W-2) income if you actively participate and your MAGI is under $100k (phasing out to $0 by $150k); unused losses carry forward. On sale, claimed depreciation is recaptured at up to 25%, and gains may owe capital-gains tax (a 1031 exchange can defer both). Figures are a year-1 estimate at your 24.0% rate — not tax advice; consult a CPA.
Condition & rehab AI · 12 photos
This beautifully renovated 2-bedroom, 2-bath home in the Chapman’s community is move-in ready with fresh paint, new flooring, and energy-efficient windows.
Value-add opportunities
- Both landscaping — enhances curb appeal and adds value
- Both upgraded lighting — improves ambiance and safety
- Both new flooring in bathrooms — enhances aesthetics and durability
Renovation cost estimate screening
Value-add ROI direction
- Both landscaping — enhances curb appeal and adds value ↑
- Both upgraded lighting — improves ambiance and safety ↑
- Both new flooring in bathrooms — enhances aesthetics and durability ↑
ⓘ Cost ranges are severity-bucket heuristics (US national rule-of-thumb). Get contractor quotes + a written scope before underwriting a rehab budget.
Schools (NCES district)
- District
- Vineland Public School District
- NCES district ID
- 3416800
- Math proficiency
- 9% ▼ -17.00%
- Reading proficiency
- 34% ▬ 0.00%
- Median HH income
- $51,168
- Composite
- 19.17/100
- National rank
- #8819
- State rank
- #418 of 472 in NJ
Livability — Vineland
- Score
- 66/100
- State rank
- #363
- US rank
- #12180
Category grades
Schools grade is shown separately in the Schools card above.
Census & demographics
- Census place
- Vineland, NJ
- County
- Cumberland County · 80,266 people
- City population
- 45,038
- Metro
- Vineland-Bridgeton, NJ
- Population (ZIP)
- 45,038
- Household income
- $65,359
- Rent vs Own
- Severe rent burden
- 1328.0
Population outlook (Cumberland County) Hauer SSP2
- Today (2025)
- 152,743 people
- By 2030
- 150,373 · -1.6%
- By 2040
- 146,881 · -3.8%
- By 2050
- 142,653 · -6.6%
- By 2075
- 129,468 · -15.2%
- By 2100
- 107,456 · -29.6%
Race, ethnicity, and origin ACS 2023
- Neighborhood character
- Diverse neighborhood (Simpson 0.62)
- Race & ethnicity
- Hispanic / Latino 51% White 32% Two or more races 17% Black 11% Asian 1%
- Hispanic origin (detail)
- Mexican 11% Puerto Rican 33% Dominican 2%
- Common ancestry
- Romanian 2% Subsaharan African 1% Scotch-Irish 1%
- Foreign-born
- 14% · Canada, Jamaica
- Languages at home
- 59% English-only · Spanish 37% Russian/Polish/Slavic 2% Other Indo-European 1%
Political lean MEDSL · Cumberland
- 2024 margin
- Toss-up / Even · D 47.6% · R 51.3% · Other 1.1%
- 2008→2024 swing
- -25.4pp toward R · 2008: 21.6pp · 2024: -3.8pp
- All cycles
- 2024: R+3.8 2020: D+6.0 2016: D+5.3 2012: D+23.1 2008: D+21.6
Not yet ingested
- Civics
- —
Market trends
- HPI YoY
- ▼ -320.06%
- Current HPI
- 278.786
- Rent YoY
- —
- Metro
- Vineland-Bridgeton, NJ
- State GDP YoY
- ▲ 2.05%
- F500 in state
- 34
Industry mix (Fortune 500 HQ in NJ)
| Industry | F500 HQs | Revenue |
|---|---|---|
| Consumer Goods | 3 | $31B |
|
||
| Pharmaceuticals | 2 | $153B |
|
||
| Technology | 2 | $21B |
|
||
| Insurance | 2 | $20B |
|
||
| Healthcare | 2 | $19B |
|
||
| Financial Services | 1 | $70B |
|
||
Price history
-8.2% since first listed3 events — show timeline
- 2026-05-20 Price Changed $112,250 BRIGHT MLS
- 2026-04-24 Listed $122,250 BRIGHT MLS
- 2026-04-23 Coming Soon $122,250 BRIGHT MLS
Cash-flow waterfall
monthlySold comps — $/sqft
last 12 mo · ≤1 miLoading sold comps…