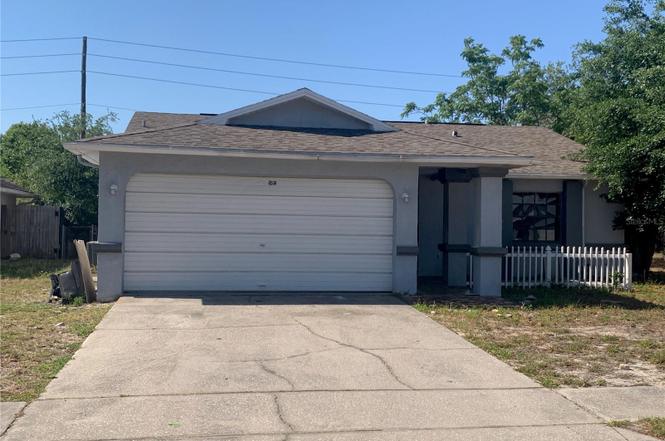
8518 Huntsman Ln · Bayonet Point, FL
Flood risk 1/10 · Minimal
- FEMA flood zone
- X (unshaded)
- Chance of flooding over 30 yrs
- 0.0%
- Est. flood insurance / yr
- $507 – $1,088
Fire risk 1/10 · Minimal
- Est. fire insurance / yr
- $947 – $1,759
Heat risk 10/10 · Severe
- Hot days now (above 108°F)
- 7 days/yr
- Hot days in 30 yrs
- 26 days/yr
Wind risk 10/10 · Severe
- Chance of severe wind over 30 yrs
- 99.0%
Air-quality risk 2/10 · Minimal
- Unhealthy air days now
- 1 days/yr
- Unhealthy air days in 30 yrs
- 3 days/yr
Risk factors via First Street. Map © Google.
Why this score? — see what drove the C+ grade
The composite is a weighted blend of 9 inputs, each scored 0–100. Each bar is that input's sub-score; the figure is the points it added to the 100-point composite (weight × sub-score).
- Cash flow +21.1/30.0
- ARV discount +15.0/15.0
- DSCR +6.7/10.0
- 1% rule +5.8/10.0
- Schools +4.3/10.0
- Livability +3.5/5.0
- Rent growth +2.8/5.0
- Condition / age +2.5/5.0
- Appreciation +0.0/10.0
$169,000
🖨 Deal sheet 📄 Offer letter ✓ Due diligence
Listing remarks MLS
Don't miss the opportunity to own this remodeled property in the heart of Port Richey!! Remodeled kitchen and bathroom, open concept and big backyard. Perfect for first time home buyers or investors; close to malls, beaches and airport. This house won't last in the market, call for your private showing today!!
Key facts
- 6,000 sq ft lot
- 2 garage spots
- Built 1985
Property features AI
Exterior
- Parking: Driveway; Attached 2-car garage
- Utilities: Public water; Public sewer; Electricity connected; Broadband/high-speed internet available; Water connected
- Home design: Single-family residence; Residential property; Fixer condition; North-facing; One-story
- Construction: Block construction; Shingle roof; Slab foundation; Built on a 0.14-acre lot
- Exterior features: Rear screened porch; Private mailbox; Chain link fencing; Paved road access
Interior
- Kitchen: Range; Refrigerator
- Bedrooms: 3 bedrooms
- Flooring: Carpet; Ceramic tile; Laminate
- Bathrooms: 2 full bathrooms
- Heating & cooling: Central heating; Central air; Wall/window unit(s)
- Interior features: Ceiling fans
- Laundry & utility: Laundry area in garage; Electric water heater
Neighborhood map
What this means for you Summary
Snapshot
- This is a 3-bed/2.0-bath single-family listed at $169k.
Deal economics
- At list price, monthly cash flow is $242 ($3k/yr) — positive.
- The deal already cash-flows at list — no discount required.
- Meets the 1% rule at list price ($2k rent vs $169k).
- Recommended offer: $164k (3.0% below list) — sets the bar for market timing.
- Cap rate 8.0% vs local median 5.3% in Bayonet Point — top-decile yield for the area; either an underpriced asset or a hidden risk that comps aren't pricing in. Stress-test before assuming the spread holds.
Location & tenants
- Location reads 69/100 on livability (#485 in FL) — a middle-class / working-renter tenant base. Strengths: cost of living A+, housing A+, health & safety A+; Watch: crime D+, amenities D+, schools F.
- Pasco (suburban): math 50% / reading 52% proficiency, ranked #32 of 73 in FL (top 44%) — acceptable for families but not a draw, mixed tenant base, ~2y average lease.
- Market conditions: Rents rising (+1.3%/yr); 577 active listings in the ZIP; 40 comparable units currently listed for rent nearby; rentals at typical pace (median 24d on market — plan ~3-4 weeks tenant-placement turnaround); 6,765 units permitted in Pasco County in 2024 (1,250 in 5+ unit buildings).
- At $1,825/mo this rent would consume 46% of the median local household income ($47k/yr) (locally 2699% of renters already pay >50% of income on rent) — very limited rent-growth headroom before tenants either downsize or default.
Forward outlook
- Local home prices are declining (-3.0%/yr); year-one equity from $1k of loan paydown is wiped out by about $5k of value loss. Plan a longer hold.
- Pasco County population projected at +29% by 2050 — long-run rental-demand tailwind backs the buy-and-hold thesis.
Negotiation context
- It's been on market 35 days — a 3% lower offer ($164k) is reasonable based on typical stale-listing flexibility.
- 5 sale attempts since 5y ago; this cycle's ask is 47% above the opening price — seller raised mid-cycle; expect resistance to lowballs.
Risks & watch-outs
- Climate carrying-cost: severe wind risk, 99% chance of damaging wind over 30y; extreme-heat days projected 7→26/yr by 2055 (HVAC capex compounding) — expect insurance premiums to compound above CPI over the hold.
Questions for the listing agent
- It's been on market 35 days. Have you received any prior offers? Is the seller open to a 3% concession, seller financing, or rate buy-down credit?
- Is there a deadline driving the sale (1031 exchange, divorce, estate, relocation)? That informs how much negotiation room exists.
- Schools are F-rated, which usually means shorter tenancies and higher turnover. Who's the typical renter profile here, and what's been the actual vacancy rate?
- Crime grade is D in this area — have there been break-ins, vandalism, or insurance claims at this property in the last 3 years? What carrier currently insures it and at what premium?
- What's the average days-on-market for RENTAL listings here right now (not sales)? A rising rental-DOM trend means longer vacancies and softer asking-rent achievability than the comps imply.
- What's the recent tenant-quality profile in this submarket — average credit score on applications, eviction rate, late-payment / NSF rate, and stable-employment percentage? A property-management company in the area should have these aggregated.
- How much new for-sale + rental construction is in the pipeline within 1–3 miles? Heavy new supply typically softens prices + rents 12–24 months out; constrained supply supports both.
Investment metrics
- 1% rule
- 1.08% ✓
- Cap rate
- 8.01%
- Cash-on-cash
- 6.13%
- DSCR
- 1.27
- GRM
- 7.7
CMA / ARV
- ARV (on-the-fly)
- $246,024
- Comps found
- 12
Show comp detail 12 sales within ~0.75 mi
| Address | Dist | Beds/Ba | Sqft | Sold | Price | $/sf | Match |
|---|---|---|---|---|---|---|---|
| 11238 Owl Ln | 0.27mi | 2/2.0 (-1) | 1,169 (-3%) | 1mo | $281,000 | $240 | 77 |
| 11525 Forest Run Ct | 0.44mi | 2/2.0 (-1) | 1,274 (+6%) | 2mo | $225,000 | $177 | 63 |
| 8034 Merrimac Dr | 0.55mi | 2/2.0 (-1) | 1,260 (+4%) | 3mo | $260,000 | $206 | 59 |
| 8718 Benton Dr | 0.68mi | 2/2.0 (-1) | 1,218 (+1%) | 3mo | $170,000 | $140 | 59 |
| 11615 Nature Trl | 0.37mi | 2/2.0 (-1) | 1,065 (-12%) | 1mo | $245,000 | $230 | 57 |
| 11341 Winwood Pl | 0.51mi | 2/2.0 (-1) | 1,107 (-8%) | 1mo | $189,000 | $171 | 56 |
| 10715 Hachita Dr | 0.67mi | 2/2.0 (-1) | 1,142 (-5%) | 4mo | $260,000 | $228 | 51 |
| 7835 Birchwood Dr | 0.69mi | 3/2.0 | 1,306 (+8%) | 3mo | $299,900 | $230 | 51 |
| 11200 Tamarix Ave | 0.65mi | 2/2.0 (-1) | 1,306 (+8%) | 1mo | $187,000 | $143 | 50 |
| 8222 Leafy Ct | 0.62mi | 2/2.0 (-1) | 1,050 (-13%) | 3mo | $187,500 | $179 | 42 |
| 11230 Rhonda Ave | 0.73mi | 2/2.0 (-1) | 1,046 (-13%) | 1mo | $130,000 | $124 | 38 |
| 10803 Hachita Dr | 0.63mi | 2/1.5 (-1) | 1,034 (-14%) | 3mo | $211,000 | $204 | 37 |
Match score weights: distance 35% · size 25% · config 20% · recency 20%. Top-matched comps best support the ARV.
Projected returns pro-forma
-3.0% appreciation · 1.28% rent growth · sell at horizon
- IRR
- -8.8%
- Equity multiple
- 0.68×
- Total profit
- $-15,047
- Equity at exit
- $25,198
- IRR
- -1.8%
- Equity multiple
- 0.89×
- Total profit
- $-5,394
- Equity at exit
- $14,612
Cash invested: $47,320 (down + closing). Projections, not guarantees.
Landlord ↔ Tenant lean methodology
- Overall (STATE)
- 87 Strongly Landlord-Friendly
- State Florida
- 87 Strongly Landlord-Friendly · R+3
- County
- — inherits STATE
- City
- — inherits STATE
ZIP-level market 34668
- Home prices YoY
- -17.4%
- Rents YoY
- 1.3%
- Active inventory
- 577
- Price-to-rent
- 7.7×
Monthly cashflow live
- Estimated rent
- $1,825 high interval (Pro) →
- Mortgage (P&I)
- −$886
- Tax from tax record
- −$243 /mo · $2,918/yr
- Insurance
- −$70
- HOA
- −$0
- Vacancy / Maint / Mgmt
- −$383
- Net cashflow
- $242
Break-even live
UW: 25.0% down · 7.5% · 30yr · 1.5% tax · 5.0% vac · 8.0% maint · 8.0% mgmt
Financing live
Cash to close
- Down payment
- $42,250
- Closing costs
- $5,070
- Reserves months
- —
- Total cash needed
- —
Loan-product check · same deal, 3 products live
Conventional
25% down · 7.5% · 30yr
- Down + closing
- —
- Monthly P&I
- —
- Monthly cashflow
- —
- DSCR
- —
- Eligible?
- —
Personal DTI + credit; lowest rate.
DSCR
20% down · 8.5% · 30yr
- Down + closing
- —
- Monthly P&I
- —
- Monthly cashflow
- —
- DSCR
- —
- Eligible?
- —
No personal income docs; deal must DSCR.
Hard money
10% down · 12.0% · 12mo
- Down + closing
- —
- Monthly P&I
- —
- Monthly cashflow
- —
- DSCR
- —
- Eligible?
- —
Short-term bridge; refi at stabilization.
Rent comps 40 comps
| Address | Beds | Baths | Sqft | Rent | $/sqft | DOM | Units | Dist |
|---|---|---|---|---|---|---|---|---|
| 8161 Braddock Cir #1 Port Richey, FL | 2.0 | 2.0 | 1000 | $1,595 | $1.59 | 17d | 1 | 0.36mi |
| 11635 Salmon Dr Port Richey, FL | 2.0 | 1.5 | 816 | $1,500 | $1.84 | 24d | 1 | 0.41mi |
| 11138 Yellowwood Ln Unit NA Port Richey, FL | 3.0 | 1.0 | 1000 | $1,800 | $1.80 | 24d | 1 | 0.56mi |
| 11630 Paige Dr Port Richey, FL | 3.0 | 1.0 | 1152 | $1,680 | $1.46 | 12d | 1 | 0.67mi |
| 8024 Las Cruces Ct Port Richey, FL | 2.0 | 2.0 | 1371 | $1,900 | $1.39 | 24d | 1 | 0.67mi |
| 11611 Constance Dr Port Richey, FL | 3.0 | 1.0 | 984 | $1,540 | $1.57 | 11d | 1 | 0.70mi |
| 11611 Constance Dr Port Richey, FL | 3.0 | 1.0 | 984 | $1,540 | $1.57 | 24d | 1 | 0.70mi |
| 11610 Meadow Dr Port Richey, FL | 2.0 | 2.0 | 1128 | $1,570 | $1.39 | 12d | 1 | 0.72mi |
| 10816 Piccadilly Rd Port Richey, FL | 3.0 | 2.0 | 1408 | $1,550 | $1.10 | 12d | 1 | 0.74mi |
| 7804 Topay Ln Port Richey, FL | 3.0 | 2.0 | 1125 | $1,811 | $1.61 | 4d | 1 | 0.75mi |
| 12200 Hudson Ridge Dr Port Richey, FL | 2.0–3.0 | 2.0 | 1107 | $1,704 | $1.54 | 2d | 10 | 0.76mi |
| 7924 Halsey Dr Port Richey, FL | 3.0 | 2.0 | 1272 | $1,800 | $1.42 | 21d | 1 | 0.76mi |
| 7924 Halsey Dr Port Richey, FL | 3.0 | 2.0 | 1272 | $1,800 | $1.42 | 4d | 1 | 0.76mi |
| 11241 Yewtree Ave Port Richey, FL | 3.0 | 2.0 | 1306 | $1,950 | $1.49 | 23d | 1 | 0.78mi |
| 10802 Laburnum Dr Port Richey, FL | 2.0 | 2.0 | 1002 | $1,545 | $1.54 | 24d | 1 | 0.80mi |
| 8431 Duval Dr Port Richey, FL | 3.0 | 2.0 | 1408 | $1,731 | $1.23 | 4d | 1 | 0.81mi |
| 10632 Laburnum Dr Port Richey, FL | 2.0 | 2.0 | 1193 | $1,583 | $1.33 | 24d | 1 | 0.82mi |
| 10801 Oldham Rd Port Richey, FL | 2.0 | 2.0 | 1182 | $1,500 | $1.27 | 1d | 1 | 0.82mi |
| 7715 Sue Ellen Dr Port Richey, FL | 2.0 | 2.0 | 1080 | $1,495 | $1.38 | 3d | 1 | 0.84mi |
| 7705 Ilex Dr Port Richey, FL | 3.0 | 2.0 | 1349 | $2,000 | $1.48 | 24d | 1 | 0.84mi |
| 10331 Flagship Ave Port Richey, FL | 3.0 | 2.0 | 1400 | $2,000 | $1.43 | 24d | 1 | 0.93mi |
| 10905 Kingsbridge Rd Port Richey, FL | 3.0 | 2.0 | 1176 | $1,566 | $1.33 | 4d | 1 | 0.94mi |
| 7540 Venice Dr Port Richey, FL | 3.0 | 2.0 | 1394 | $1,775 | $1.27 | 4d | 1 | 0.94mi |
| 7608 Sue Ellen Dr Port Richey, FL | 3.0 | 2.0 | 1310 | $2,400 | $1.83 | 24d | 1 | 0.95mi |
| 10502 Laburnum Dr Port Richey, FL | 2.0 | 2.0 | 1002 | $1,545 | $1.54 | 24d | 1 | 0.95mi |
| 7531 Greybirch Ter Port Richey, FL | 3.0 | 2.0 | 1400 | $2,000 | $1.43 | 24d | 1 | 0.96mi |
| 11902 Oceanside Dr Port Richey, FL | 4.0 | 2.0 | 1200 | $1,800 | $1.50 | 2d | 1 | 0.96mi |
| 7530 Judith Cres Port Richey, FL | 2.0 | 2.0 | 1446 | $1,695 | $1.17 | 20d | 1 | 0.97mi |
| 7530 Judith Cres Port Richey, FL | 2.0 | 2.0 | 1446 | $2,200 | $1.52 | 24d | 1 | 0.97mi |
| 7808 Talisman Dr Port Richey, FL | 3.0 | 2.0 | 1063 | $2,100 | $1.98 | 24d | 1 | 0.98mi |
| 12221 Holbrook Dr Bayonet Point, FL | 1.0–2.0 | 1.0–2.0 | 761 | $1,685 | $2.21 | 1d | 59 | 0.98mi |
| 7839 Canna Dr Port Richey, FL | 2.0 | 2.0 | 1095 | $1,450 | $1.32 | 10d | 1 | 0.98mi |
| 7520 Hawthorn Dr Unit NA Port Richey, FL | 2.0 | 2.0 | 1303 | $1,900 | $1.46 | 24d | 1 | 0.98mi |
| 7520 Hawthorn Dr Port Richey, FL | 2.0 | 2.0 | 1303 | $1,800 | $1.38 | 23d | 1 | 0.98mi |
| 9440 Bourbon St Unit 9 New Port Richey, FL | 2.0 | 1.0 | 700 | $1,275 | $1.82 | 24d | 1 | 0.99mi |
| 9444 Bourbon St Unit 12 New Port Richey, FL | 3.0 | 2.0 | 1152 | $1,875 | $1.63 | 24d | 1 | 1.00mi |
| 7539 Gulf Highlands Dr Port Richey, FL | 2.0 | 1.5 | 936 | $1,550 | $1.66 | 4d | 1 | 1.00mi |
| 10629 Cymbid Dr Port Richey, FL | 3.0 | 2.0 | 1400 | $1,700 | $1.21 | 24d | 1 | 1.03mi |
| 12027 Hoosier Ct #203 Hudson, FL | 2.0 | 2.0 | 1103 | $1,550 | $1.41 | 24d | 1 | 1.13mi |
| 12041 Hoosier Ct #204 Hudson, FL | 2.0 | 2.0 | 1103 | $1,495 | $1.36 | 17d | 1 | 1.14mi |
Listing history 16 events
-
2026-04-29status Pending
-
2026-04-16price $169,000
-
2026-04-06price $179,000
-
2026-03-25status Active
-
2026-03-25price $182,500
-
2025-05-01status Pending
-
2025-04-30$114,900 Active
-
2022-03-16soldstatus $249,900
-
2022-03-09soldstatus $249,900 Closed 312-char remark
Show marketing remark (312 chars)
Don't miss the opportunity to own this remodeled property in the heart of Port Richey!! Remodeled kitchen and bathroom, open concept and big backyard. Perfect for first time home buyers or investors; close to malls, beaches and airport. This house won't last in the market, call for your private showing today!!
-
2022-02-01status Pending 312-char remark
Show marketing remark (312 chars)
Don't miss the opportunity to own this remodeled property in the heart of Port Richey!! Remodeled kitchen and bathroom, open concept and big backyard. Perfect for first time home buyers or investors; close to malls, beaches and airport. This house won't last in the market, call for your private showing today!!
-
2022-01-22$249,900 Active 312-char remark
Show marketing remark (312 chars)
Don't miss the opportunity to own this remodeled property in the heart of Port Richey!! Remodeled kitchen and bathroom, open concept and big backyard. Perfect for first time home buyers or investors; close to malls, beaches and airport. This house won't last in the market, call for your private showing today!!
-
2021-07-06status Active
-
2021-06-23status Pending
-
2021-06-11$160,000 Active
-
2020-11-30soldstatus $55,000
-
2001-06-29soldstatus $70,000
ⓘ Source: listings_history table (triggers on properties + properties_extension) + one-shot
backfill from property_details.listing_events for pre-trigger history.
Tax reassessment forecast FL · Resets to sale price
- Current annual tax
- $2,918 · $243/mo
- Projected year-2 tax
- $2,918 · $243/mo
- Expected delta
- $0/yr ($0/mo · 0.0%)
ⓘ Screening estimate from a state-policy table — verify with the county assessor before closing.
Climate risk First Street
- Flood 1/10 Low FEMA zone X (unshaded) · 0% chance over 30 yrs
- Wildfire 1/10 Low
- Heat 10/10 Extreme 7 d/yr ≥108°F today · 26 d/yr by 30 yrs out
- Wind 10/10 Extreme 99% chance of damaging wind over 30 yrs
- Air quality 2/10 Low 1 unhealthy d/yr today · 3 by 30 yrs out
Nearby sold comps map
Loading sold comps map…
Walkable amenities ~0.75 mi
Loading nearby amenities…
Taxation est. · year 1
- Rental income
- $21,897
- − Mortgage interest
- −$9,467
- − Property taxes
- −$2,918
- − Insurance
- −$845
- − Repairs & maintenance
- −$1,752
- − Management
- −$1,752
- − Depreciation
- −$4,916
- Taxable income
- $248
- Est. tax owed @ 24.0%
- −$59
- After-tax cash flow
- $2,841/yr
For passive investors: Depreciation is non-cash, so a rental often shows a tax loss while cash-flowing — sheltering income. Rental losses are passive: they offset passive income freely, and up to $25,000/yr can offset ordinary (W-2) income if you actively participate and your MAGI is under $100k (phasing out to $0 by $150k); unused losses carry forward. On sale, claimed depreciation is recaptured at up to 25%, and gains may owe capital-gains tax (a 1031 exchange can defer both). Figures are a year-1 estimate at your 24.0% rate — not tax advice; consult a CPA.
Schools (NCES district)
- District
- Pasco
- NCES district ID
- 1201530
- Math proficiency
- 50% ▼ -10.00%
- Reading proficiency
- 52% ▼ -5.00%
- Median HH income
- $45,039
- Composite
- 43.14/100
- National rank
- #3074
- State rank
- #32 of 73 in FL
Livability — Bayonet Point
- Score
- 69/100
- State rank
- #485
- US rank
- #8934
Category grades
Schools grade is shown separately in the Schools card above.
Census & demographics
- Census place
- Bayonet Point, FL
- County
- Pasco County · 524,098 people
- Metro
- Tampa-St. Petersburg-Clearwater, FL
- Population (ZIP)
- 49,442
- Household income
- $47,401
- Rent vs Own
- Severe rent burden
- 2699.0
Population outlook (Pasco County) Hauer SSP2
- Today (2025)
- 570,045 people
- By 2030
- 605,844 · +6.3%
- By 2040
- 674,806 · +18.4%
- By 2050
- 736,022 · +29.1%
- By 2075
- 862,900 · +51.4%
- By 2100
- 906,364 · +59.0%
Race, ethnicity, and origin ACS 2023
- Neighborhood character
- Predominantly White (70%)
- Race & ethnicity
- White 70% Hispanic / Latino 23% Two or more races 14% Black 4%
- Hispanic origin (detail)
- Mexican 3% Puerto Rican 10% Cuban 5% Dominican 1%
- Common ancestry
- Romanian 3% Lithuanian 3% Slovak 2%
- Foreign-born
- 11% · Canada, Jamaica
- Languages at home
- 82% English-only · Spanish 14% Other Indo-European 1% French/Haitian/Cajun 1%
Political lean MEDSL · Pasco
- 2024 margin
- Strong R (+25.2) · D 36.9% · R 62.1% · Other 1.0%
- 2008→2024 swing
- -21.6pp toward R · 2008: -3.6pp · 2024: -25.2pp
- All cycles
- 2024: R+25.2 2020: R+20.1 2016: R+21.6 2012: R+6.7 2008: R+3.6
Not yet ingested
- Civics
- —
Market trends
- HPI YoY
- ▼ -75.64%
- Current HPI
- 359.7163
- Rent YoY
- ▲ 1.28%
- Metro
- Tampa-St. Petersburg-Clearwater, FL
- State GDP YoY
- ▲ 3.28%
- F500 in state
- 36
Industry mix (Fortune 500 HQ in FL)
| Industry | F500 HQs | Revenue |
|---|---|---|
| Industrial Technology | 2 | $29B |
|
||
| Insurance | 2 | $17B |
|
||
| Retail | 1 | $60B |
|
||
| Technology Distribution | 1 | $58B |
|
||
| Homebuilding | 1 | $35B |
|
||
| Technology Manufacturing | 1 | $35B |
|
||
Price history
+141.4% since first listed16 events — show timeline
- 2026-04-29 Pending — Stellar MLS as Distributed by MLS Grid
- 2026-04-16 Price Changed $169,000 Stellar MLS as Distributed by MLS Grid
- 2026-04-06 Price Changed $179,000 Stellar MLS as Distributed by MLS Grid
- 2026-03-25 Relisted — Stellar MLS as Distributed by MLS Grid
- 2026-03-25 Price Changed $182,500 Stellar MLS as Distributed by MLS Grid
- 2025-05-01 Pending — Stellar MLS as Distributed by MLS Grid
- 2025-04-30 Listed $114,900 Stellar MLS as Distributed by MLS Grid
- 2022-03-16 Sold (Public Records) $249,900 Public Records
- 2022-03-09 Sold (MLS) $249,900 Stellar MLS as Distributed by MLS Grid
- 2022-02-01 Pending — Stellar MLS as Distributed by MLS Grid
- 2022-01-22 Listed $249,900 Stellar MLS as Distributed by MLS Grid
- 2021-07-06 Relisted — Stellar MLS as Distributed by MLS Grid
- 2021-06-23 Pending — Stellar MLS as Distributed by MLS Grid
- 2021-06-11 Listed $160,000 Stellar MLS as Distributed by MLS Grid
- 2020-11-30 Sold (Public Records) $55,000 Public Records
- 2001-06-29 Sold (Public Records) $70,000 Public Records
Property tax history
+17.7%/yrLatest (2025): $2,918 · -2.1% YoY. Source: county tax records.
Cash-flow waterfall
monthlySold comps — $/sqft
last 12 mo · ≤1 miLoading sold comps…