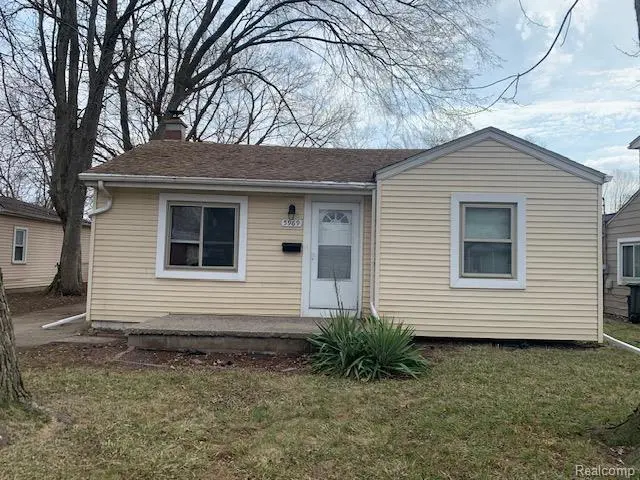
5969 Fellrath St · Taylor, MI
Flood risk 1/10 · Minimal
- FEMA flood zone
- X (unshaded)
- Chance of flooding over 30 yrs
- 0.0%
- Est. flood insurance / yr
- $507 – $1,088
Fire risk 1/10 · Minimal
- Est. fire insurance / yr
- $784 – $1,456
Heat risk 3/10 · Minor
- Hot days now (above 98°F)
- 7 days/yr
- Hot days in 30 yrs
- 15 days/yr
Wind risk 2/10 · Minimal
- Chance of severe wind over 30 yrs
- —
Air-quality risk 2/10 · Minimal
- Unhealthy air days now
- 1 days/yr
- Unhealthy air days in 30 yrs
- 2 days/yr
Risk factors via First Street. Map © Google.
Why this score? — see what drove the C- grade
The composite is a weighted blend of 9 inputs, each scored 0–100. Each bar is that input's sub-score; the figure is the points it added to the 100-point composite (weight × sub-score).
- Cash flow +20.5/30.0
- ARV discount +9.0/15.0
- DSCR +6.5/10.0
- 1% rule +5.1/10.0
- Livability +3.8/5.0
- Rent growth +3.7/5.0
- Condition / age +2.5/5.0
- Schools +1.8/10.0
- Appreciation +0.0/10.0
$129,900
🖨 Deal sheet (PDF) 📄 Offer letter ✓ Due diligence
Listing remarks MLS
Clean Fully updated Ranch Home! Nice Kitchen with Granite Countertops and Backsplash! Kitchen has Dine in area as well. Newer Carpet and Flooring throughout the home. Large Utility room with newer flooring. Large Backyard! Appliances included! Immediate Occupancy! C of O from City Provided. This is a must See!
Key facts
- Dine in area
- Large backyard
- Appliances included
Tags
Neighborhood map
What this means for you Summary
Snapshot
- This is a 2-bed/1.0-bath single-family listed at $130k.
Deal economics
- At list price, monthly cash flow is $172 ($2k/yr) — positive.
- The deal already cash-flows at list — no discount required.
- Meets the 1% rule at list price ($1k rent vs $130k).
- Recommended offer: $126k (3.0% below list) — sets the bar for market timing.
- Cap rate 7.9% vs local median 5.4% in Taylor — top-decile yield for the area; either an underpriced asset or a hidden risk that comps aren't pricing in. Stress-test before assuming the spread holds.
Location & tenants
- Location reads 76/100 on livability (#144 in MI, #3,684 nationally) — a middle-class / working-renter tenant base. Strengths: commute A+, cost of living A+, housing A+; Watch: employment D+, crime F.
- Taylor School District (urban): math 14% / reading 27% proficiency, ranked #462 of 540 in MI (top 86%) — low school quality limits family demand, transient renter base, plan for 1-2y turnover; 68% free/reduced lunch — lower-income household profile, screen leases tightly.
- Zoned schools: Clarence Randall Elem School (math 10% / reading 10%, grade F, #1,230 of 1,397 statewide, top 91%, 461 students, 81% FRL); Hoover Middle School (math 12% / reading 27%, grade F, #425 of 493 statewide, top 87%, 490 students, 81% FRL); Taylor High School (math 37% / reading 52%, grade F, #214 of 713 statewide, top 36%, 1,394 students, 66% FRL).
- Market conditions: Rents rising fast (+4.9%/yr); 289 active listings in the ZIP; 2 comparable units currently listed for rent nearby; 2,639 units permitted in Wayne County in 2024 (1,216 in 5+ unit buildings).
Forward outlook
- Local home prices are declining (-3.0%/yr); year-one equity from $898 of loan paydown is wiped out by about $4k of value loss. Plan a longer hold.
- Wayne County population projected at -17% by 2050 — secular population decline; favor cash flow + early exit over multi-decade hold.
Negotiation context
- It's been on market 57 days — a 3% lower offer ($126k) is reasonable based on typical stale-listing flexibility.
- 4 sale attempts since 8y ago with the ask held roughly flat each time — persistent listings suggest the price (not the market) is what's stuck; bring a comps-based counter.
- Current owner paid $95k; 37% above their basis — modest negotiation headroom, anchor on the comps not their cost.
Risks & watch-outs
- Watch-outs: built in 1948 — expect roof / HVAC / electrical / plumbing capex.
Questions for the listing agent
- It's been on market 57 days. Have you received any prior offers? Is the seller open to a 3% concession, seller financing, or rate buy-down credit?
- Built in 1948 — when were the roof, HVAC, electrical panel, plumbing, and water heater last replaced?
- Is there a deadline driving the sale (1031 exchange, divorce, estate, relocation)? That informs how much negotiation room exists.
- Schools are F-rated, which usually means shorter tenancies and higher turnover. Who's the typical renter profile here, and what's been the actual vacancy rate?
- Crime grade is F in this area — have there been break-ins, vandalism, or insurance claims at this property in the last 3 years? What carrier currently insures it and at what premium?
- What's the average days-on-market for RENTAL listings here right now (not sales)? A rising rental-DOM trend means longer vacancies and softer asking-rent achievability than the comps imply.
- What's the recent tenant-quality profile in this submarket — average credit score on applications, eviction rate, late-payment / NSF rate, and stable-employment percentage? A property-management company in the area should have these aggregated.
- How much new for-sale + rental construction is in the pipeline within 1–3 miles? Heavy new supply typically softens prices + rents 12–24 months out; constrained supply supports both.
Investment metrics
- 1% rule
- 1.01% ✓
- Cap rate
- 7.88%
- Cash-on-cash
- 5.68%
- DSCR
- 1.25
- GRM
- 8.3
CMA / ARV
- ARV (median comp)
- $134,521
- List price
- $129,900
- Delta
- -3.43%
- Verdict
- FAIR
- Comps
- 20 within 1.0 mi
Show comp detail 12 sales within ~0.75 mi
| Address | Dist | Beds/Ba | Sqft | Sold | Price | $/sf | Match |
|---|---|---|---|---|---|---|---|
| 6029 Fellrath St | 0.06mi | 2/1.0 | 696 (-4%) | 12mo | $130,000 | $187 | 80 |
| 6019 John Daly St | 0.31mi | 2/1.0 | 721 (-1%) | 9mo | $134,000 | $186 | 77 |
| 5961 Mcguire St | 0.13mi | 3/1.0 (+1) | 780 (+7%) | 9mo | $139,900 | $179 | 70 |
| 6139 Hampden St | 0.28mi | 2/1.0 | 648 (-11%) | 2mo | $100,000 | $154 | 67 |
| 6160 Mcguire St | 0.18mi | 2/1.0 | 660 (-9%) | 12mo | $89,000 | $135 | 66 |
| 26389 Annapolis St | 0.66mi | 2/1.0 | 729 (+0%) | 9mo | $126,500 | $174 | 61 |
| 26252 Eton Ave | 0.54mi | 2/1.0 | 696 (-4%) | 8mo | $123,000 | $177 | 60 |
| 26241 Annapolis St | 0.63mi | 2/1.0 | 696 (-4%) | 6mo | $54,500 | $78 | 58 |
| 6739 Marvin St | 0.61mi | 2/1.0 | 702 (-4%) | 10mo | $135,000 | $192 | 57 |
| 6348 Dean St | 0.34mi | 2/1.0 | 824 (+13%) | 8mo | $65,000 | $79 | 56 |
| 6049 Michael St | 0.50mi | 3/1.0 (+1) | 792 (+9%) | 11mo | $160,000 | $202 | 47 |
| 5940 Daniels St | 0.64mi | 2/1.0 | 833 (+14%) | 3mo | $146,999 | $176 | 43 |
Match score weights: distance 35% · size 25% · config 20% · recency 20%. Top-matched comps best support the ARV.
Projected returns pro-forma
-3.0% appreciation · 4.9% rent growth · sell at horizon
- IRR
- -5.5%
- Equity multiple
- 0.79×
- Total profit
- $-7,535
- Equity at exit
- $19,369
- IRR
- 6.3%
- Equity multiple
- 1.51×
- Total profit
- $18,438
- Equity at exit
- $11,231
Cash invested: $36,372 (down + closing). Projections, not guarantees.
Landlord ↔ Tenant lean methodology
- Overall (STATE)
- 62 Landlord-Friendly
- State Michigan
- 62 Landlord-Friendly · EVEN
- County
- — inherits STATE
- City
- — inherits STATE
ZIP-level market 48180
- Rents YoY
- 4.9%
- Active inventory
- 289
- Price-to-rent
- 8.3×
Monthly cashflow live
- Estimated rent
- $1,310 medium interval (Pro) →
- Mortgage (P&I)
- −$681
- Tax from tax record
- −$128 /mo · $1,531/yr
- Insurance
- −$54
- HOA
- −$0
- Vacancy / Maint / Mgmt
- −$275
- Net cashflow
- $172
Break-even live
Sensitivity live
| Price | -10% $246 | -5% $209 | +0% $172 | +5% $135 | +10% $99 |
|---|---|---|---|---|---|
| Rent | -10% $69 | -5% $120 | +0% $172 | +5% $224 | +10% $276 |
| Rate | -1.0pp $238 | -0.5pp $205 | base $172 | +0.5pp $138 | +1.0pp $104 |
UW: 25.0% down · 7.5% · 30yr · 1.5% tax · 5.0% vac · 8.0% maint · 8.0% mgmt
Financing live
Cash to close
- Down payment
- $32,475
- Closing costs
- $3,897
- Reserves months
- —
- Total cash needed
- —
Loan-product check · same deal, 3 products live
Conventional
25% down · 7.5% · 30yr
- Down + closing
- —
- Monthly P&I
- —
- Monthly cashflow
- —
- DSCR
- —
- Eligible?
- —
Personal DTI + credit; lowest rate.
DSCR
20% down · 8.5% · 30yr
- Down + closing
- —
- Monthly P&I
- —
- Monthly cashflow
- —
- DSCR
- —
- Eligible?
- —
No personal income docs; deal must DSCR.
Hard money
10% down · 12.0% · 12mo
- Down + closing
- —
- Monthly P&I
- —
- Monthly cashflow
- —
- DSCR
- —
- Eligible?
- —
Short-term bridge; refi at stabilization.
Rent comps 2 comps
| Address | Beds | Baths | Sqft | Rent | $/sqft | DOM | Units | Dist |
|---|---|---|---|---|---|---|---|---|
| 5845 Michael St Taylor, MI | 2.0 | 1.0 | 618 | $1,325 | $2.14 | 6d | 1 | 0.50mi |
| 6477 Westpoint St Taylor, MI | 1.0 | 1.0 | 650 | $900 | $1.38 | 6d | 1 | 1.29mi |
Listing history 12 events
-
2026-04-10price $129,900 311-char remark
Show marketing remark (311 chars)
Clean Fully updated Ranch Home! Nice Kitchen with Granite Countertops and Backsplash! Kitchen has Dine in area as well. Newer Carpet and Flooring throughout the home. Large Utility room with newer flooring. Large Backyard! Appliances included! Immediate Occupancy! C of O from City Provided. This is a must See!
-
2026-04-09price $129,900 311-char remark
Show marketing remark (311 chars)
Clean Fully updated Ranch Home! Nice Kitchen with Granite Countertops and Backsplash! Kitchen has Dine in area as well. Newer Carpet and Flooring throughout the home. Large Utility room with newer flooring. Large Backyard! Appliances included! Immediate Occupancy! C of O from City Provided. This is a must See!
-
2026-03-31price $139,000 311-char remark
Show marketing remark (311 chars)
Clean Fully updated Ranch Home! Nice Kitchen with Granite Countertops and Backsplash! Kitchen has Dine in area as well. Newer Carpet and Flooring throughout the home. Large Utility room with newer flooring. Large Backyard! Appliances included! Immediate Occupancy! C of O from City Provided. This is a must See!
-
2026-03-26$129,000 Active 311-char remark
Show marketing remark (311 chars)
Clean Fully updated Ranch Home! Nice Kitchen with Granite Countertops and Backsplash! Kitchen has Dine in area as well. Newer Carpet and Flooring throughout the home. Large Utility room with newer flooring. Large Backyard! Appliances included! Immediate Occupancy! C of O from City Provided. This is a must See!
-
2018-03-05soldstatus $95,000 Sold
-
2018-03-05soldstatus $95,000 Closed
-
2018-03-04status Pending
-
2018-03-04status Pending
-
2018-02-03$120,000 Active
-
2018-02-03$120,000 Active
ⓘ Source: listings_history table (triggers on properties + properties_extension) + one-shot
backfill from property_details.listing_events for pre-trigger history.
Tax reassessment forecast MI · Partial reset (capped growth)
- Current annual tax
- $1,531 · $128/mo
- Projected year-2 tax
- $1,766 · $147/mo
- Expected delta
- +$235/yr (+$20/mo · 15.4%)
ⓘ Screening estimate from a state-policy table — verify with the county assessor before closing.
Climate risk First Street
- Flood 1/10 Low FEMA zone X (unshaded) · 0% chance over 30 yrs
- Wildfire 1/10 Low
- Heat 3/10 Moderate 7 d/yr ≥98°F today · 15 d/yr by 30 yrs out
- Wind 2/10 Low
- Air quality 2/10 Low 1 unhealthy d/yr today · 2 by 30 yrs out
Nearby sold comps map
Loading sold comps map…
Walkable amenities ~0.75 mi
Loading nearby amenities…
Taxation est. · year 1
- Rental income
- $15,722
- − Mortgage interest
- −$7,276
- − Property taxes
- −$1,531
- − Insurance
- −$650
- − Repairs & maintenance
- −$1,258
- − Management
- −$1,258
- − Depreciation
- −$3,779
- Taxable loss
- −$29
- Est. tax savings @ 24.0%
- +$7
- After-tax cash flow
- $2,073/yr
For passive investors: Depreciation is non-cash, so a rental often shows a tax loss while cash-flowing — sheltering income. Rental losses are passive: they offset passive income freely, and up to $25,000/yr can offset ordinary (W-2) income if you actively participate and your MAGI is under $100k (phasing out to $0 by $150k); unused losses carry forward. On sale, claimed depreciation is recaptured at up to 25%, and gains may owe capital-gains tax (a 1031 exchange can defer both). Figures are a year-1 estimate at your 24.0% rate — not tax advice; consult a CPA.
Schools (NCES district)
- District
- Taylor School District
- NCES district ID
- 2633540
- Math proficiency
- 14% ▼ -7.00%
- Reading proficiency
- 27% ▼ -4.00%
- Median HH income
- $43,062
- Composite
- 17.62/100
- National rank
- #9034
- State rank
- #462 of 540 in MI
Livability — Taylor
- Score
- 76/100
- State rank
- #144
- US rank
- #3684
Category grades
Schools grade is shown separately in the Schools card above.
Census & demographics
- Census place
- Taylor, MI
- County
- Wayne County · 1,562,939 people
- City population
- 62,081
- Metro
- Detroit-Warren-Dearborn, MI
- Population (ZIP)
- 62,081
- Household income
- $61,081
- Rent vs Own
- Severe rent burden
- 1957.0
Population outlook (Wayne County) Hauer SSP2
- Today (2025)
- 1,675,273 people
- By 2030
- 1,620,300 · -3.3%
- By 2040
- 1,502,341 · -10.3%
- By 2050
- 1,384,039 · -17.4%
- By 2075
- 1,124,592 · -32.9%
- By 2100
- 881,193 · -47.4%
Race, ethnicity, and origin ACS 2023
- Neighborhood character
- Majority White (65%)
- Race & ethnicity
- White 65% Black 19% Two or more races 9% Hispanic / Latino 9% Asian 2%
- Hispanic origin (detail)
- Mexican 6% Puerto Rican 2%
- Common ancestry
- Romanian 8% Lithuanian 3% Slovak 2%
- Foreign-born
- 7% · Canada
- Languages at home
- 89% English-only · Spanish 4% Arabic 3% Other Indo-European 3%
Political lean MEDSL · Wayne
- 2024 margin
- Strong D (+29.0) · D 62.7% · R 33.7% · Other 3.6%
- 2008→2024 swing
- -20.5pp toward R · 2008: 49.5pp · 2024: 29.0pp
- All cycles
- 2024: D+29.0 2020: D+38.1 2016: D+37.3 2012: D+46.9 2008: D+49.5
Not yet ingested
- Civics
- —
Market trends
- HPI YoY
- ▼ -212.33%
- Current HPI
- 228.921
- Rent YoY
- ▲ 4.90%
- Metro
- Detroit-Warren-Dearborn, MI
- State GDP YoY
- ▲ 1.37%
- F500 in state
- 28
Industry mix (Fortune 500 HQ in MI)
| Industry | F500 HQs | Revenue |
|---|---|---|
| Automotive Parts | 3 | $48B |
|
||
| Automotive | 2 | $372B |
|
||
| Chemicals | 1 | $45B |
|
||
| Automotive Retail | 1 | $29B |
|
||
| Healthcare / Medical Devices | 1 | $23B |
|
||
| Automotive Technology | 1 | $20B |
|
||
Price history
+8.2% since first listed12 events — show timeline
- 2026-04-10 Price Changed $129,900 MiRealSource-MiMLS
- 2026-04-09 Price Changed $129,900 REALCOMP
- 2026-03-31 Price Changed $139,000 MiRealSource-MiMLS
- 2026-03-31 Price Changed $139,000 REALCOMP
- 2026-03-26 Listed $129,000 REALCOMP
- 2026-03-26 Listed $129,000 MiRealSource-MiMLS
- 2018-03-05 Sold (MLS) $95,000 MiRealSource-MiMLS
- 2018-03-05 Sold (MLS) $95,000 REALCOMP
- 2018-03-04 Pending — MiRealSource-MiMLS
- 2018-03-04 Pending — REALCOMP
- 2018-02-03 Listed $120,000 MiRealSource-MiMLS
- 2018-02-03 Listed $120,000 REALCOMP
Property tax history
+1.0%/yrLatest (2025): $1,531 · -9.5% YoY. Source: county tax records.
Cash-flow waterfall
monthlySold comps — $/sqft
last 12 mo · ≤1 miLoading sold comps…