1036 Lake Franklin Dr · Winnsboro, TX
Flood risk 1/10 · Minimal
- FEMA flood zone
- —
- Chance of flooding over 30 yrs
- 0.0%
- Est. flood insurance / yr
- —
Fire risk 4/10 · Minor
- Est. fire insurance / yr
- $1,222 – $2,270
Heat risk 6/10 · Moderate
- Hot days now (above 110°F)
- 7 days/yr
- Hot days in 30 yrs
- 22 days/yr
Wind risk 6/10 · Moderate
- Chance of severe wind over 30 yrs
- 27.0%
Air-quality risk 2/10 · Minimal
- Unhealthy air days now
- 0 days/yr
- Unhealthy air days in 30 yrs
- 1 days/yr
Risk factors via First Street. Map © Google.
Why this score? — see what drove the B- grade
The composite is a weighted blend of 9 inputs, each scored 0–100. Each bar is that input's sub-score; the figure is the points it added to the 100-point composite (weight × sub-score).
- Cash flow +30.0/30.0
- DSCR +10.0/10.0
- 1% rule +8.4/10.0
- ARV discount +7.5/15.0
- Schools +3.6/10.0
- Livability +3.5/5.0
- Rent growth +2.5/5.0
- Condition / age +2.5/5.0
- Appreciation +0.0/10.0
$120,000
🖨 Deal sheet (PDF) 📄 Offer letter ✓ Due diligence
Listing remarks
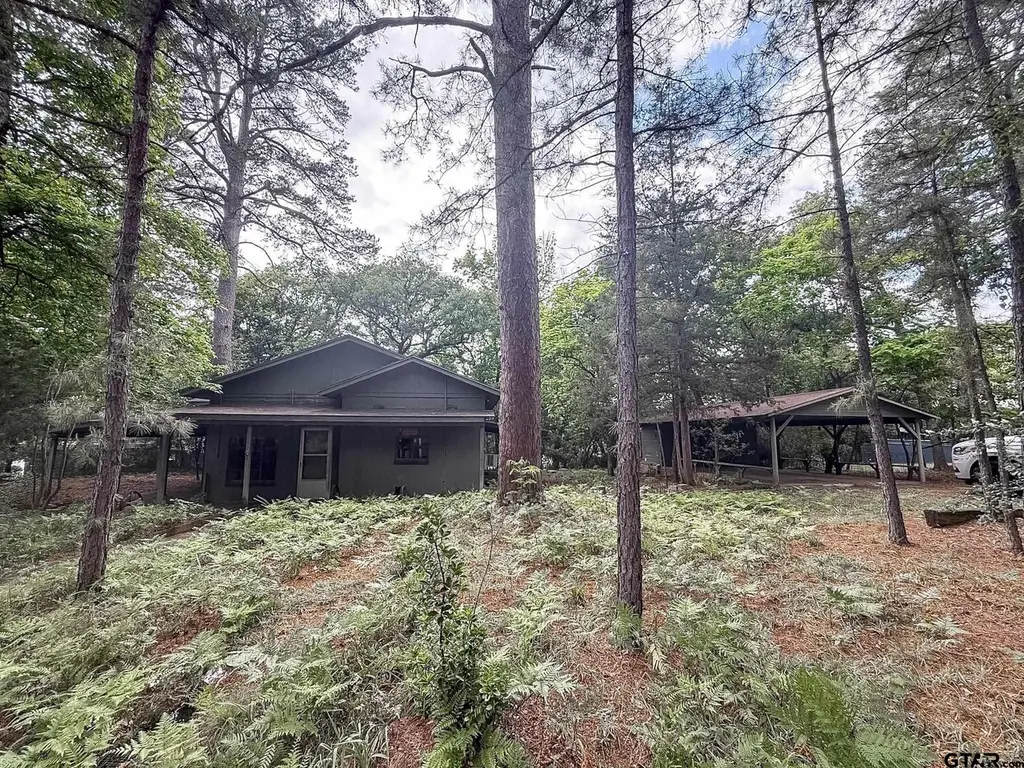
Tucked among the tall trees on beautiful Lake Franklin in the Winnsboro Fishing & Hunting Club, this water-view cabin offers a rare opportunity to create your own private getaway in a peaceful, member-only setting. Surrounded by the natural beauty of East Texas, the property features a covered carport, shaded walkway, and a quiet, secluded feel just steps from the water. Inside, you’ll find an open living and kitchen area with good natural light, and plenty of potential to update and make it your own. The home offers multiple living spaces, wood-style flooring, and a fireplace that adds character and charm. A window-lined sunroom area provides a relaxing spot to enjoy the wooded
Key facts
- Covered carport
- Water view cabin
- Shaded walkway
Tags
Property features AI
Finance
- Other: Located in the Fishing and Hunting Club subdivision; directions: drive into the Winnsboro Fishing and Hunting Club, property on your right
- HOA & community: Homeowners association with annual fee of $500 (approximately $41.67/month); Located in a senior community
Exterior
- Home design: Single-family detached residence; One story
- Construction: Stucco exterior; Composition roof
- Exterior features: Covered porch; Storage building/area; Views of Lake Franklin
Interior
- Kitchen: Electric oven; Electric range
- Bathrooms: 2 full bathrooms
- Heating & cooling: Window unit cooling
- Interior features: Electric oven; Electric range; Window cooling units
Neighborhood map
What this means for you Summary
Snapshot
- This is a 2-bed/1.0-bath single-family listed at $120k.
Deal economics
- At list price, monthly cash flow is $500 ($6k/yr) — positive.
- The deal already cash-flows at list — no discount required.
- Meets the 1% rule at list price ($2k rent vs $120k).
- Recommended offer: $116k (3.0% below list) — sets the bar for market timing.
- Cap rate 11.3% vs local median 3.8% in Winnsboro — top-decile yield for the area; either an underpriced asset or a hidden risk that comps aren't pricing in. Stress-test before assuming the spread holds.
Location & tenants
- Location reads 69/100 on livability (#416 in TX) — a middle-class / working-renter tenant base. Strengths: cost of living A+, housing A+, crime B; Watch: employment D+, amenities F, commute F.
- Winnsboro ISD (town): math 46% / reading 40% proficiency, ranked #330 of 826 in TX (top 40%) — families likely to look elsewhere, expect single-tenant / working-renter base with shorter leases.
- Zoned schools: Winnsboro El (355 students, 71% FRL); Winnsboro J H (math 48% / reading 40%, grade D, #512 of 1,662 statewide, top 32%, 360 students, 53% FRL); Winnsboro H S (math 67% / reading 62%, grade B-, #199 of 1,632 statewide, top 14%, 492 students, 65% FRL).
- Market conditions: 220 active listings in the ZIP; 7 units permitted in Franklin County in 2024 (0 in 5+ unit buildings).
Forward outlook
- Local home prices are declining (-3.0%/yr); year-one equity from $830 of loan paydown is wiped out by about $4k of value loss. Plan a longer hold.
- At projected returns (-3.0% appreciation + 3.0% rent growth), your $34k cash investment doubles in ~7 years — after that, you're playing with house money.
Negotiation context
- It's been on market 53 days — a 3% lower offer ($116k) is reasonable based on typical stale-listing flexibility.
Risks & watch-outs
- Watch-outs: built in 1800 — expect roof / HVAC / electrical / plumbing capex.
- Climate carrying-cost: major wind risk, 27% chance of damaging wind over 30y; extreme-heat days projected 7→22/yr by 2055 (HVAC capex compounding) — expect insurance premiums to compound above CPI over the hold.
Questions for the listing agent
- It's been on market 53 days. Have you received any prior offers? Is the seller open to a 3% concession, seller financing, or rate buy-down credit?
- Built in 1800 — when were the roof, HVAC, electrical panel, plumbing, and water heater last replaced?
- What does the HOA fee cover, when was the last increase, and are there any pending special assessments or reserve-fund shortfalls?
- Is there a deadline driving the sale (1031 exchange, divorce, estate, relocation)? That informs how much negotiation room exists.
- What's the average days-on-market for RENTAL listings here right now (not sales)? A rising rental-DOM trend means longer vacancies and softer asking-rent achievability than the comps imply.
- What's the recent tenant-quality profile in this submarket — average credit score on applications, eviction rate, late-payment / NSF rate, and stable-employment percentage? A property-management company in the area should have these aggregated.
- How much new for-sale + rental construction is in the pipeline within 1–3 miles? Heavy new supply typically softens prices + rents 12–24 months out; constrained supply supports both.
Investment metrics
- 1% rule
- 1.34% ✓
- Cap rate
- 11.29%
- Cash-on-cash
- 17.85%
- DSCR
- 1.79
- GRM
- 6.2
CMA / ARV
- ARV (median comp)
- $243,050
- List price
- $120,000
- Delta
- -50.63%
- Verdict
- UNDERPRICED
- Comps
- 3 within 1.0 mi
Projected returns pro-forma
-3.0% appreciation · 3.0% rent growth · sell at horizon
- IRR
- 9.4%
- Equity multiple
- 1.37×
- Total profit
- $12,374
- Equity at exit
- $17,892
- IRR
- 18.5%
- Equity multiple
- 2.54×
- Total profit
- $51,717
- Equity at exit
- $10,375
Cash invested: $33,600 (down + closing). Projections, not guarantees.
Landlord ↔ Tenant lean methodology
- Overall (STATE)
- 87 Strongly Landlord-Friendly
- State Texas
- 87 Strongly Landlord-Friendly · R+5
- County
- — inherits STATE
- City
- — inherits STATE
ZIP-level market 75494
- Home prices YoY
- -10.9%
- Active inventory
- 220
- Price-to-rent
- 6.2×
Monthly cashflow live
- Estimated rent
- $1,610 medium interval (Pro) →
- Mortgage (P&I)
- −$629
- Tax from tax record
- −$51 /mo · $608/yr
- Insurance
- −$50
- HOA
- −$42
- Vacancy / Maint / Mgmt
- −$338
- Net cashflow
- $500
Break-even live
Sensitivity live
| Price | -10% $568 | -5% $534 | +0% $500 | +5% $466 | +10% $432 |
|---|---|---|---|---|---|
| Rent | -10% $373 | -5% $436 | +0% $500 | +5% $563 | +10% $627 |
| Rate | -1.0pp $560 | -0.5pp $530 | base $500 | +0.5pp $469 | +1.0pp $437 |
UW: 25.0% down · 7.5% · 30yr · 1.5% tax · 5.0% vac · 8.0% maint · 8.0% mgmt
Financing live
Cash to close
- Down payment
- $30,000
- Closing costs
- $3,600
- Reserves months
- —
- Total cash needed
- —
Loan-product check · same deal, 3 products live
Conventional
25% down · 7.5% · 30yr
- Down + closing
- —
- Monthly P&I
- —
- Monthly cashflow
- —
- DSCR
- —
- Eligible?
- —
Personal DTI + credit; lowest rate.
DSCR
20% down · 8.5% · 30yr
- Down + closing
- —
- Monthly P&I
- —
- Monthly cashflow
- —
- DSCR
- —
- Eligible?
- —
No personal income docs; deal must DSCR.
Hard money
10% down · 12.0% · 12mo
- Down + closing
- —
- Monthly P&I
- —
- Monthly cashflow
- —
- DSCR
- —
- Eligible?
- —
Short-term bridge; refi at stabilization.
HOA detail
- Monthly dues
- $42 · $504/yr
- Likely covers
- water
Listing history 21 events
-
2026-06-21days on market $120,000 Active 53 DOM
-
2026-06-21days on market $120,000 Active 52 DOM
-
2026-06-18days on market $120,000 Active 50 DOM
-
2026-06-17days on market $120,000 Active 49 DOM
-
2026-06-16days on market $120,000 Active 48 DOM
-
2026-06-15days on market $120,000 Active 47 DOM
-
2026-06-15days on market $120,000 Active 46 DOM
-
2026-06-13days on market $120,000 Active 45 DOM
-
2026-06-12days on market $120,000 Active 44 DOM
-
2026-06-09days on market $120,000 Active 41 DOM
-
2026-06-08days on market $120,000 Active 40 DOM
-
2026-06-08days on market $120,000 Active 39 DOM
-
2026-06-07days on market $120,000 Active 38 DOM
-
2026-06-03days on market $120,000 Active 35 DOM
-
2026-06-02days on market $120,000 Active 34 DOM
-
2026-06-01days on market $120,000 Active 33 DOM
-
2026-05-31days on market $120,000 Active 32 DOM
-
2026-04-29$139,000 Active 1144-char remark
-
2006-06-20soldstatus
-
2006-06-20soldstatus
-
1990-04-17soldstatus
ⓘ Source: listings_history table (triggers on properties + properties_extension) + one-shot
backfill from property_details.listing_events for pre-trigger history.
Tax reassessment forecast TX · Resets to sale price
- Current annual tax
- $608 · $51/mo
- Projected year-2 tax
- $2,196 · $183/mo
- Expected delta
- +$1,588/yr (+$132/mo · 261.4%)
ⓘ Screening estimate from a state-policy table — verify with the county assessor before closing.
Climate risk First Street
- Flood 1/10 Low 0% chance over 30 yrs
- Wildfire 4/10 Moderate
- Heat 6/10 Major 7 d/yr ≥110°F today · 22 d/yr by 30 yrs out
- Wind 6/10 Major 27% chance of damaging wind over 30 yrs
- Air quality 2/10 Low 0 unhealthy d/yr today · 1 by 30 yrs out
Nearby sold comps map
Loading sold comps map…
Walkable amenities ~0.75 mi
Loading nearby amenities…
Taxation est. · year 1
- Rental income
- $19,317
- − Mortgage interest
- −$6,722
- − Property taxes
- −$608
- − Insurance
- −$600
- − Repairs & maintenance
- −$1,545
- − Management
- −$1,545
- − HOA
- −$504
- − Depreciation
- −$3,491
- Taxable income
- $4,302
- Est. tax owed @ 24.0%
- −$1,032
- After-tax cash flow
- $4,965/yr
For passive investors: Depreciation is non-cash, so a rental often shows a tax loss while cash-flowing — sheltering income. Rental losses are passive: they offset passive income freely, and up to $25,000/yr can offset ordinary (W-2) income if you actively participate and your MAGI is under $100k (phasing out to $0 by $150k); unused losses carry forward. On sale, claimed depreciation is recaptured at up to 25%, and gains may owe capital-gains tax (a 1031 exchange can defer both). Figures are a year-1 estimate at your 24.0% rate — not tax advice; consult a CPA.
Schools (NCES district)
- District
- Winnsboro ISD
- NCES district ID
- 4846200
- Math proficiency
- 46% ▼ -4.00%
- Reading proficiency
- 40% ▼ -10.00%
- Median HH income
- $40,192
- Composite
- 36.07/100
- National rank
- #4769
- State rank
- #330 of 826 in TX
Livability — Winnsboro
- Score
- 69/100
- State rank
- #416
- US rank
- #8564
Category grades
Schools grade is shown separately in the Schools card above.
Census & demographics
- Population (ZIP)
- 11,685
Population outlook (Franklin County) Hauer SSP2
- Today (2025)
- 10,621 people
- By 2030
- 10,648 · +0.3%
- By 2040
- 10,629 · +0.1%
- By 2050
- 10,486 · -1.3%
- By 2075
- 10,038 · -5.5%
- By 2100
- 8,816 · -17.0%
Race, ethnicity, and origin ACS 2023
- Neighborhood character
- Predominantly White (82%)
- Race & ethnicity
- White 82% Hispanic / Latino 13% Two or more races 10% Black 1% Asian 1%
- Hispanic origin (detail)
- Mexican 12%
- Common ancestry
- Serbian 2% Iranian 2% Slovak 1%
- Foreign-born
- 7% · Canada, South Korea
- Languages at home
- 89% English-only · Spanish 8% German/W. Germanic 1% Arabic 1%
Political lean MEDSL · Franklin
- 2024 margin
- Solid R (+68.9) · D 15.3% · R 84.2%
- 2008→2024 swing
- -16.5pp toward R · 2008: -52.5pp · 2024: -68.9pp
- All cycles
- 2024: R+68.9 2020: R+67.0 2016: R+67.0 2012: R+63.4 2008: R+52.5
Not yet ingested
- Civics
- —
Market trends
- HPI YoY
- ▼ -28.64%
- Current HPI
- 234.6203
- Rent YoY
- —
- Metro
- —
- State GDP YoY
- ▲ 3.95%
- F500 in state
- 110
Industry mix (Fortune 500 HQ in TX)
| Industry | F500 HQs | Revenue |
|---|---|---|
| Energy | 16 | $1,198B |
|
||
| Technology | 5 | $198B |
|
||
| Engineering / Construction | 4 | $72B |
|
||
| Energy Services | 3 | $60B |
|
||
| Utilities | 3 | $41B |
|
||
| Healthcare | 2 | $330B |
|
||
Price history
-13.7% since first listed5 events — show timeline
- 2026-05-27 Price Changed $120,000 GTAR
- 2026-04-29 Listed $139,000 GTAR
- 2006-06-20 Sold (Public Records) — Public Records
- 2006-06-20 Sold (Public Records) — Public Records
- 1990-04-17 Sold (Public Records) — Public Records
Property tax history
+9.9%/yrLatest (2025): $608 · +121.8% YoY. Source: county tax records.
Cash-flow waterfall
monthlySold comps — $/sqft
last 12 mo · ≤1 miLoading sold comps…