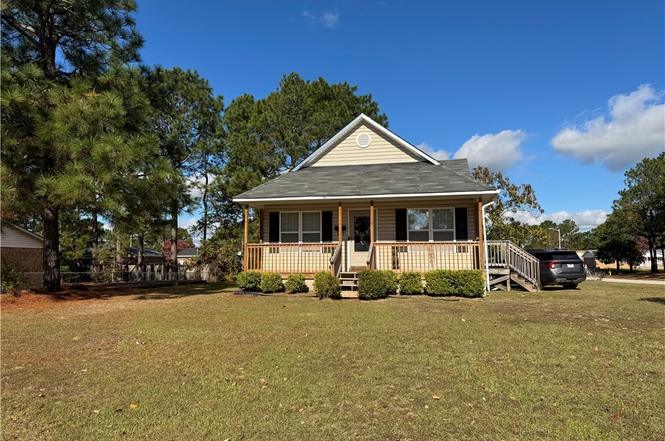
310 Nugget Ct · Fayetteville, NC
Flood risk 1/10 · Minimal
- FEMA flood zone
- X (unshaded)
- Chance of flooding over 30 yrs
- 0.0%
- Est. flood insurance / yr
- $507 – $1,088
Fire risk 5/10 · Moderate
- Est. fire insurance / yr
- $906 – $1,684
Heat risk 7/10 · Major
- Hot days now (above 105°F)
- 7 days/yr
- Hot days in 30 yrs
- 16 days/yr
Wind risk 6/10 · Moderate
- Chance of severe wind over 30 yrs
- 73.0%
Air-quality risk 2/10 · Minimal
- Unhealthy air days now
- 0 days/yr
- Unhealthy air days in 30 yrs
- 1 days/yr
Risk factors via First Street. Map © Google.
Why this score? — see what drove the D grade
The composite is a weighted blend of 9 inputs, each scored 0–100. Each bar is that input's sub-score; the figure is the points it added to the 100-point composite (weight × sub-score).
- Cash flow +12.9/30.0
- ARV discount +8.5/15.0
- DSCR +3.9/10.0
- Livability +3.8/5.0
- 1% rule +3.4/10.0
- Rent growth +3.2/5.0
- Schools +3.1/10.0
- Condition / age +2.5/5.0
- Appreciation +0.0/10.0
$173,900
🖨 Deal sheet 📄 Offer letter ✓ Due diligence
Listing remarks MLS
Great investment property, wonderful tenant and great price! $$500.00 BONUS IF SOLD BEFORE 12/01/2017
Key facts
- Built 2007
- Listed 228 days
Property features AI
Finance
- Other: Zoned SF10 (Single Family Res 10); Subdivision: TIFFANY PIN
Exterior
- Parking: No garage
- Utilities: Public water; Public sewer
- Home design: Single-family residence; One story
- Construction: Vinyl siding construction
- Exterior features: Front covered porch
Interior
- Kitchen: Refrigerator
- Bedrooms: Total of 5 rooms (bedrooms included)
- Flooring: Vinyl flooring
- Bathrooms: 2 full bathrooms
- Heating & cooling: Heat pump heating; Central electric air conditioning
- Interior features: Refrigerator included; No fireplace
Neighborhood map
What this means for you Summary
Snapshot
- This is a 3-bed/2.0-bath single-family listed at $174k.
Deal economics
- At list price, monthly cash flow is $-12 ($-139/yr) — negative.
- To cash-flow at today's rent, offer at most $172k (1.2% below list).
- To meet the 1% rule (rent ≥ 1% of price), the offer needs to be $147k (15.6% below list).
- Recommended offer: $147k (15.6% below list) — sets the bar for 1% rule.
- Cap rate 6.2% vs local median 4.9% in Fayetteville — meaningfully above typical; check what's discounted (condition, days-on-market, listing class) to confirm the premium yield is real.
Location & tenants
- Location reads 75/100 on livability (#45 in NC, #4,031 nationally) — a middle-class / working-renter tenant base. Strengths: commute A+, cost of living A+, housing A+; Watch: schools C-, crime F, employment D-.
- Cumberland County Schools (urban): math 32% / reading 41% proficiency, ranked #126 of 178 in NC (top 71%) — families likely to look elsewhere, expect single-tenant / working-renter base with shorter leases.
- Market conditions: Rents rising (+2.8%/yr); 360 active listings in the ZIP; 25 comparable units currently listed for rent nearby; rentals at typical pace (median 24d on market — plan ~3-4 weeks tenant-placement turnaround); 1,125 units permitted in Cumberland County in 2024 (104 in 5+ unit buildings).
Forward outlook
- Local home prices are declining (-3.0%/yr); year-one equity from $1k of loan paydown is wiped out by about $5k of value loss. Plan a longer hold.
Negotiation context
- It's been on market 228 days — a 12% lower offer ($153k) is reasonable based on typical stale-listing flexibility.
- 4 sale attempts since 11y ago; this cycle's ask has dropped $821k (83%) from the opening price — seller is motivated, your offer sets the floor, not the list.
- Current owner paid $57k; list at $174k implies a 205% gain — meaningful room to come down on a strong offer.
Risks & watch-outs
- Climate carrying-cost: major wind risk, 73% chance of damaging wind over 30y; moderate wildfire risk; extreme-heat days projected 7→16/yr by 2055 (HVAC capex compounding) — expect insurance premiums to compound above CPI over the hold.
Questions for the listing agent
- What do current leases actually rent for vs. the listed asking? Can we see a recent rent roll and the last 12 months of T-12 income?
- It's been on market 228 days. Have you received any prior offers? Is the seller open to a 16% concession, seller financing, or rate buy-down credit?
- Why hasn't it sold? Are there any deal-killer items the seller is aware of (foundation, flood, title, zoning, code violations)?
- Is there a deadline driving the sale (1031 exchange, divorce, estate, relocation)? That informs how much negotiation room exists.
- Crime grade is F in this area — have there been break-ins, vandalism, or insurance claims at this property in the last 3 years? What carrier currently insures it and at what premium?
- The area grade is low — what's the realistic commute time and amenity access for the typical tenant pool here? Any planned neighborhood developments (good or bad) we should know about?
- What's the average days-on-market for RENTAL listings here right now (not sales)? A rising rental-DOM trend means longer vacancies and softer asking-rent achievability than the comps imply.
- What's the recent tenant-quality profile in this submarket — average credit score on applications, eviction rate, late-payment / NSF rate, and stable-employment percentage? A property-management company in the area should have these aggregated.
- How much new for-sale + rental construction is in the pipeline within 1–3 miles? Heavy new supply typically softens prices + rents 12–24 months out; constrained supply supports both.
Investment metrics
- 1% rule
- 0.84% ✗
- Cap rate
- 6.21%
- Cash-on-cash
- -0.29%
- DSCR
- 0.99
- GRM
- 9.9
CMA / ARV
- ARV (on-the-fly)
- $177,705
- Comps found
- 12
Show comp detail 12 sales within ~0.75 mi
| Address | Dist | Beds/Ba | Sqft | Sold | Price | $/sf | Match |
|---|---|---|---|---|---|---|---|
| 319 Nugget Ct | 0.08mi | 3/1.5 | 1,132 (+5%) | 2mo | $195,000 | $172 | 84 |
| 707 Zircon Ct | 0.14mi | 3/2.0 | 1,099 (+2%) | 14mo | $175,000 | $159 | 79 |
| 725 Mosswood Ln | 0.37mi | 3/2.0 | 1,105 (+3%) | 2mo | $210,000 | $190 | 77 |
| 674 Walker St | 0.27mi | 3/2.0 | 1,092 (+1%) | 14mo | $180,000 | $165 | 73 |
| 1526 Argon Ave | 0.29mi | 3/2.0 | 1,116 (+4%) | 9mo | $189,000 | $169 | 73 |
| 801 Darlington Dr | 0.63mi | 3/2.0 | 1,066 (-1%) | 1mo | $100,000 | $94 | 68 |
| 873 Kaywood Dr | 0.48mi | 3/1.5 | 1,088 (+1%) | 14mo | $169,500 | $156 | 62 |
| 758 Amber Dr | 0.32mi | 3/1.5 | 1,195 (+11%) | 6mo | $150,000 | $126 | 60 |
| 735 Amber Dr | 0.30mi | 3/1.5 | 1,184 (+10%) | 13mo | $160,000 | $135 | 57 |
| 595 Sheringham Dr | 0.64mi | 3/2.0 | 1,149 (+7%) | 4mo | $200,000 | $174 | 55 |
| 601 Ryder St | 0.45mi | 3/2.0 | 1,225 (+14%) | 13mo | $235,500 | $192 | 45 |
| 556 Waterbury Dr | 0.74mi | 3/2.0 | 1,236 (+15%) | 5mo | $195,000 | $158 | 37 |
Match score weights: distance 35% · size 25% · config 20% · recency 20%. Top-matched comps best support the ARV.
Projected returns pro-forma
-3.0% appreciation · 2.82% rent growth · sell at horizon
- IRR
- -17.0%
- Equity multiple
- 0.40×
- Total profit
- $-29,180
- Equity at exit
- $25,929
- IRR
- -9.2%
- Equity multiple
- 0.44×
- Total profit
- $-27,433
- Equity at exit
- $15,036
Cash invested: $48,692 (down + closing). Projections, not guarantees.
Landlord ↔ Tenant lean methodology
- Overall (STATE)
- 85 Strongly Landlord-Friendly
- State North Carolina
- 85 Strongly Landlord-Friendly · R+3
- County
- — inherits STATE
- City
- — inherits STATE
ZIP-level market 28311
- Home prices YoY
- -18.4%
- Rents YoY
- 2.8%
- Active inventory
- 360
- Price-to-rent
- 9.9×
Monthly cashflow live
- Estimated rent
- $1,468 high interval (Pro) →
- Mortgage (P&I)
- −$912
- Tax from tax record
- −$187 /mo · $2,241/yr
- Insurance
- −$72
- HOA
- −$0
- Vacancy / Maint / Mgmt
- −$308
- Net cashflow
- $-12
Break-even live
UW: 25.0% down · 7.5% · 30yr · 1.5% tax · 5.0% vac · 8.0% maint · 8.0% mgmt
Financing live
Cash to close
- Down payment
- $43,475
- Closing costs
- $5,217
- Reserves months
- —
- Total cash needed
- —
Loan-product check · same deal, 3 products live
Conventional
25% down · 7.5% · 30yr
- Down + closing
- —
- Monthly P&I
- —
- Monthly cashflow
- —
- DSCR
- —
- Eligible?
- —
Personal DTI + credit; lowest rate.
DSCR
20% down · 8.5% · 30yr
- Down + closing
- —
- Monthly P&I
- —
- Monthly cashflow
- —
- DSCR
- —
- Eligible?
- —
No personal income docs; deal must DSCR.
Hard money
10% down · 12.0% · 12mo
- Down + closing
- —
- Monthly P&I
- —
- Monthly cashflow
- —
- DSCR
- —
- Eligible?
- —
Short-term bridge; refi at stabilization.
Rent comps 25 comps
| Address | Beds | Baths | Sqft | Rent | $/sqft | DOM | Units | Dist |
|---|---|---|---|---|---|---|---|---|
| 318 Nugget Ct Fayetteville, NC | 4.0 | 2.0 | 1425 | $1,650 | $1.16 | 13d | 1 | 0.04mi |
| 4736 Rosehill Rd Fayetteville, NC | 3.0 | 2.0 | 1000 | $1,240 | $1.24 | 23d | 1 | 0.52mi |
| 909 Southview Cir Unit B Fayetteville, NC | 2.0 | 1.5 | 923 | $945 | $1.02 | 23d | 1 | 0.56mi |
| 1003 Madiera Ct Fayetteville, NC | 2.0 | 2.0 | 950 | $1,275 | $1.34 | 23d | 1 | 0.57mi |
| 790 Arthington St Fayetteville, NC | 2.0 | 2.5 | 1000 | $1,350 | $1.35 | 23d | 1 | 0.63mi |
| 2523 Mulranny Dr Fayetteville, NC | 1.0–3.0 | 1.0–2.0 | 1112 | $1,589 | $1.43 | 13d | 9 | 0.69mi |
| 4310 Coolidge St Fayetteville, NC | 3.0 | 1.5 | 1212 | $1,250 | $1.03 | 13d | 1 | 0.76mi |
| 4206 S Dowfield Dr Fayetteville, NC | 2.0 | 1.0 | 900 | $895 | $0.99 | 23d | 1 | 0.76mi |
| 4202 S Dowfield Dr Fayetteville, NC | 2.0 | 1.0 | 800 | $930 | $1.16 | 23d | 1 | 0.76mi |
| 3963 Loufield Dr Fayetteville, NC | 3.0 | 2.0 | 1446 | $1,500 | $1.04 | 23d | 1 | 0.84mi |
| 5327 Chesapeake Rd Fayetteville, NC | 3.0 | 2.0 | 1400 | $1,600 | $1.14 | 13d | 1 | 0.86mi |
| 2500 McArthur Landing Cir Fayetteville, NC | 2.0–3.0 | 2.0 | 1226 | $1,420 | $1.16 | 13d | 13 | 0.89mi |
| 2641 McArthur Landing Cir Fayetteville, NC | 3.0 | 2.0 | 1450 | $1,500 | $1.03 | 23d | 1 | 0.89mi |
| 2641 McArthur Landing Cir #102 Fayetteville, NC | 3.0 | 2.0 | 1400 | $1,375 | $0.98 | 23d | 1 | 0.89mi |
| 2641 McArthur Landing Cir Fayetteville, NC | 3.0 | 2.0 | 1450 | $1,400 | $0.97 | 21d | 1 | 0.89mi |
| 848 Tamarack Dr Fayetteville, NC | 1.0–2.0 | 1.0 | 705 | $1,171 | $1.66 | 13d | 49 | 1.02mi |
| 927 Fiske Dr Fayetteville, NC | 3.0 | 1.0 | 926 | $1,200 | $1.30 | 23d | 1 | 1.22mi |
| 3613 Pine Lake Dr Fayetteville, NC | 1.0–3.0 | 1.0–2.0 | 1116 | $1,645 | $1.47 | 13d | 31 | 1.25mi |
| 5523 Livingston Dr Fayetteville, NC | 4.0 | 1.5 | 1305 | $1,600 | $1.23 | 23d | 1 | 1.26mi |
| 319 Idlewild Dr Fayetteville, NC | 2.0 | 2.0–2.5 | 1080 | $1,340 | $1.24 | 13d | 9 | 1.37mi |
| 319 Idlewild Dr Fayetteville, NC | 2.0 | 2.0–2.5 | 1080 | $1,350 | $1.25 | 23d | 3 | 1.37mi |
| 1547 Center St Fayetteville, NC | 2.0 | 1.0 | 802 | $850 | $1.06 | 23d | 1 | 1.37mi |
| 417 Nottingham Dr Fayetteville, NC | 3.0 | 2.0 | 1024 | $1,400 | $1.37 | 23d | 1 | 1.43mi |
| 3523 Rosehill Rd Fayetteville, NC | 4.0 | 1.0 | 1448 | $1,450 | $1.00 | 13d | 1 | 1.47mi |
| 1527 McArthur Rd Fayetteville, NC | 3.0 | 1.0 | 864 | $925 | $1.07 | 23d | 1 | 1.47mi |
Listing history 29 events
-
2026-06-18days on market $173,900 Active 228 DOM
-
2026-06-17days on market $173,900 Active 227 DOM
-
2026-06-16days on market $173,900 Active 226 DOM
-
2026-06-15days on market $173,900 Active 225 DOM
-
2026-06-14days on market $173,900 Active 223 DOM
-
2026-06-13days on market $173,900 Active 222 DOM
-
2026-06-10days on market $173,900 Active 220 DOM
-
2026-06-09days on market $173,900 Active 219 DOM
-
2026-06-08days on market $173,900 Active 218 DOM
-
2026-06-07days on market $173,900 Active 217 DOM
-
2026-06-03days on market $173,900 Active 213 DOM
-
2026-06-02days on market $173,900 Active 212 DOM
-
2026-06-01days on market $173,900 Active 211 DOM
-
2026-05-31days on market $173,900 Active 210 DOM
-
2026-05-30days on market $173,900 Active 209 DOM
-
2026-05-01price $173,900
-
2026-04-03price $184,900
-
2026-03-03price $189,000
-
2026-02-13price $195,000
-
2026-02-13price $957,000
-
2025-10-29$995,000 Active
-
2018-01-05soldstatus $57,000 103-char remark
Show marketing remark (103 chars)
Great investment property, wonderful tenant and great price! $$500.00 BONUS IF SOLD BEFORE 12/01/2017
-
2017-09-18$59,990 103-char remark
Show marketing remark (103 chars)
Great investment property, wonderful tenant and great price! $$500.00 BONUS IF SOLD BEFORE 12/01/2017
-
2017-08-09historical
-
2016-09-25historical
-
2016-03-28$74,900
-
2015-02-01$74,990
-
1986-07-17soldstatus $54,000
-
1984-07-01soldstatus $47,000
ⓘ Source: listings_history table (triggers on properties + properties_extension) + one-shot
backfill from property_details.listing_events for pre-trigger history.
Tax reassessment forecast NC · Resets to sale price
- Current annual tax
- $2,241 · $187/mo
- Projected year-2 tax
- $2,241 · $187/mo
- Expected delta
- $0/yr ($0/mo · 0.0%)
ⓘ Screening estimate from a state-policy table — verify with the county assessor before closing.
Climate risk First Street
- Flood 1/10 Low FEMA zone X (unshaded) · 0% chance over 30 yrs
- Wildfire 5/10 Major
- Heat 7/10 Severe 7 d/yr ≥105°F today · 16 d/yr by 30 yrs out
- Wind 6/10 Major 73% chance of damaging wind over 30 yrs
- Air quality 2/10 Low 0 unhealthy d/yr today · 1 by 30 yrs out
Nearby sold comps map
Loading sold comps map…
Walkable amenities ~0.75 mi
Loading nearby amenities…
Taxation est. · year 1
- Rental income
- $17,613
- − Mortgage interest
- −$9,741
- − Property taxes
- −$2,241
- − Insurance
- −$870
- − Repairs & maintenance
- −$1,409
- − Management
- −$1,409
- − Depreciation
- −$5,059
- Taxable loss
- −$3,115
- Est. tax savings @ 24.0%
- +$748
- After-tax cash flow
- $608/yr
For passive investors: Depreciation is non-cash, so a rental often shows a tax loss while cash-flowing — sheltering income. Rental losses are passive: they offset passive income freely, and up to $25,000/yr can offset ordinary (W-2) income if you actively participate and your MAGI is under $100k (phasing out to $0 by $150k); unused losses carry forward. On sale, claimed depreciation is recaptured at up to 25%, and gains may owe capital-gains tax (a 1031 exchange can defer both). Figures are a year-1 estimate at your 24.0% rate — not tax advice; consult a CPA.
Schools (NCES district)
- District
- Cumberland County Schools
- NCES district ID
- 3700011
- Math proficiency
- 32% ▼ -2.00%
- Reading proficiency
- 41% ▼ -1.00%
- Median HH income
- $44,168
- Composite
- 31.0/100
- National rank
- #6096
- State rank
- #126 of 178 in NC
Livability — Fayetteville
- Score
- 75/100
- State rank
- #45
- US rank
- #4031
Category grades
Schools grade is shown separately in the Schools card above.
Census & demographics
- Census place
- Fayetteville, NC
- County
- Cumberland County · 265,314 people
- City population
- 226,118
- Metro
- Fayetteville, NC
- Population (ZIP)
- 36,629
- Household income
- $62,170
- Rent vs Own
- Severe rent burden
- 1645.0
Population outlook (Cumberland County) Hauer SSP2
- Today (2025)
- 330,855 people
- By 2030
- 333,523 · +0.8%
- By 2040
- 335,583 · +1.4%
- By 2050
- 335,325 · +1.4%
- By 2075
- 342,853 · +3.6%
- By 2100
- 340,698 · +3.0%
Race, ethnicity, and origin ACS 2023
- Neighborhood character
- Diverse neighborhood (Simpson 0.67)
- Race & ethnicity
- Black 42% White 38% Hispanic / Latino 9% Two or more races 8% Asian 3% Native American 1%
- Hispanic origin (detail)
- Mexican 3% Puerto Rican 4%
- Common ancestry
- Slovak 1% Lithuanian 1% Italian 1%
- Foreign-born
- 7% · Canada, South Korea, Jamaica
- Languages at home
- 89% English-only · Spanish 6% German/W. Germanic 1% Other Indo-European 1%
Political lean MEDSL · Cumberland
- 2024 margin
- D (+13.4) · D 56.1% · R 42.7% · Other 1.2%
- 2008→2024 swing
- -4.3pp toward R · 2008: 17.7pp · 2024: 13.4pp
- All cycles
- 2024: D+13.4 2020: D+16.6 2016: D+16.0 2012: D+19.7 2008: D+17.7
Not yet ingested
- Civics
- —
Market trends
- HPI YoY
- ▼ -45.88%
- Current HPI
- 203.0731
- Rent YoY
- ▲ 2.82%
- Metro
- Fayetteville, NC
- State GDP YoY
- ▲ 3.28%
- F500 in state
- 26
Industry mix (Fortune 500 HQ in NC)
| Industry | F500 HQs | Revenue |
|---|---|---|
| Financial Services | 2 | $213B |
|
||
| Retail | 2 | $95B |
|
||
| Industrial Conglomerate | 1 | $38B |
|
||
| Metals / Steel | 1 | $35B |
|
||
| Utilities | 1 | $30B |
|
||
| Industrial Machinery | 1 | $19B |
|
||
Price history
+270.0% since first listed14 events — show timeline
- 2026-05-01 Price Changed $173,900 LPRMLS
- 2026-04-03 Price Changed $184,900 LPRMLS
- 2026-03-03 Price Changed $189,000 LPRMLS
- 2026-02-13 Price Changed $195,000 LPRMLS
- 2026-02-13 Price Changed $957,000 LPRMLS
- 2025-10-29 Listed $995,000 LPRMLS
- 2018-01-05 Sold (MLS) $57,000 TMLS
- 2017-09-18 Listed $59,990 TMLS
- 2017-08-09 Listing Removed — TMLS
- 2016-09-25 Listing Removed — TMLS
- 2016-03-28 Listed $74,900 TMLS
- 2015-02-01 Listed $74,990 TMLS
- 1986-07-17 Sold (Public Records) $54,000 Public Records
- 1984-07-01 Sold (Public Records) $47,000 Public Records
Property tax history
+6.2%/yrLatest (2025): $2,241 · +49.4% YoY. Source: county tax records.
Cash-flow waterfall
monthlySold comps — $/sqft
last 12 mo · ≤1 miLoading sold comps…