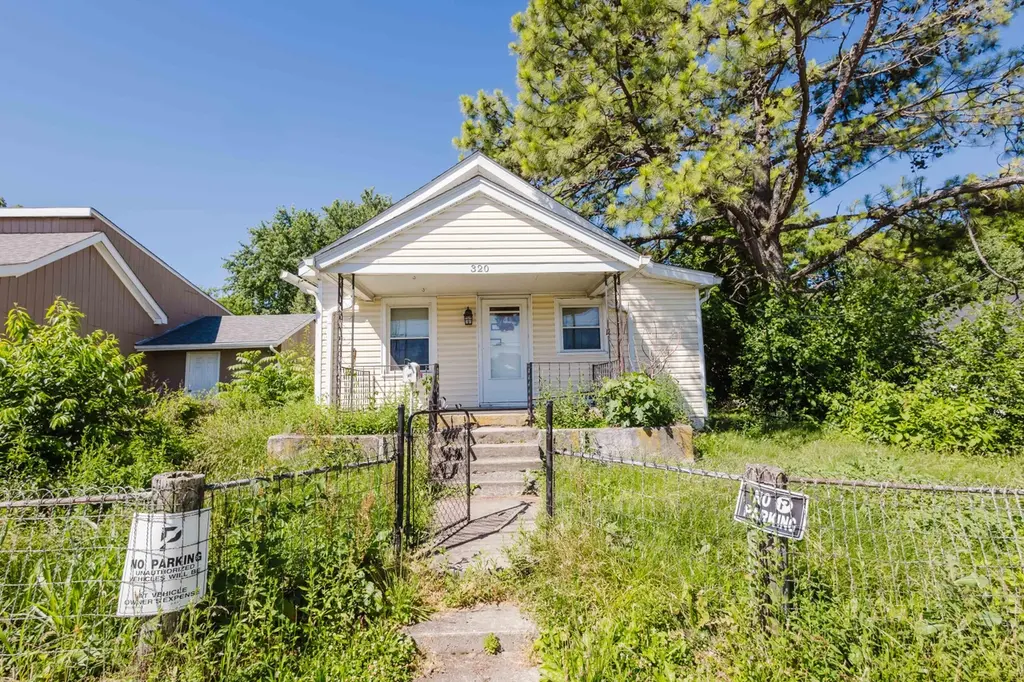
320 Burley Ave · Lexington-Fayette, KY
Flood risk 1/10 · Minimal
- FEMA flood zone
- X (unshaded)
- Chance of flooding over 30 yrs
- 0.0%
- Est. flood insurance / yr
- $507 – $1,088
Fire risk 1/10 · Minimal
- Est. fire insurance / yr
- $839 – $1,559
Heat risk 4/10 · Minor
- Hot days now (above 101°F)
- 7 days/yr
- Hot days in 30 yrs
- 19 days/yr
Wind risk 2/10 · Minimal
- Chance of severe wind over 30 yrs
- 1.0%
Air-quality risk 1/10 · Minimal
- Unhealthy air days now
- 0 days/yr
- Unhealthy air days in 30 yrs
- 0 days/yr
Risk factors via First Street. Map © Google.
Why this score? — see what drove the D+ grade
The composite is a weighted blend of 9 inputs, each scored 0–100. Each bar is that input's sub-score; the figure is the points it added to the 100-point composite (weight × sub-score).
- Cash flow +16.2/30.0
- ARV discount +12.9/15.0
- DSCR +5.0/10.0
- Rent growth +3.6/5.0
- Schools +3.4/10.0
- 1% rule +3.2/10.0
- Livability +2.5/5.0
- Condition / age +2.5/5.0
- Appreciation +0.0/10.0
$200,000
🖨 Deal sheet (PDF) 📄 Offer letter ✓ Due diligence
Listing remarks
An exceptional real estate opportunity is coming to Lexington. On Tuesday, June 30, 2026, at 12:00 PM EST, the Central Kentucky Multi-Property Investment Auction will take place live at The Campbell House (1375 S. Broadway, Lexington, KY 40503), parking will be in the back of The Campbell House. Simultaneous online bidding available. This is a true Absolute Auction, meaning every property sells to the highest bidder regardless of price. All properties are offered AS-IS, WHERE-IS with no contingencies. A buyer's premium will be added to the final bid, and a non-refundable earnest money deposit is required. Successful bidders must close on or before July 24, 2026. Do not miss this rare chance
Key facts
- 6,229 sq ft lot
- 2 garage spots
- Built 1916
Property features AI
Finance
- Other: Lot approximately 0.143 acres (6,229 sq ft); Not on waterfront
- Financial info: Parcel number 40567800
- HOA & community: Subdivision: Lynn Grove
Exterior
- Parking: Detached garage; Property has a garage
- Security: Security details not specified
- Utilities: Public sewer
- Home design: One-story house
- Construction: Vinyl siding exterior; Block foundation; Built area listed as 870
- Exterior features: Neighborhood view; Public water
Interior
- Kitchen: Appliances not specified
- Bedrooms: Bedrooms not specified
- Flooring: Flooring details not specified
- Bathrooms: 1 full bathroom
- Heating & cooling: Natural gas heating; Electric cooling
- Interior features: No fireplace; Total of 2 rooms
- Laundry & utility: Laundry details not specified
Neighborhood map
What this means for you Summary
Snapshot
- This is a 2-bed/1.0-bath single-family listed at $200k.
Deal economics
- At list price, monthly cash flow is $105 ($1k/yr) — positive.
- The deal already cash-flows at list — no discount required.
- To meet the 1% rule (rent ≥ 1% of price), the offer needs to be $164k (18.0% below list).
- Recommended offer: $164k (18.0% below list) — sets the bar for 1% rule.
- Cap rate 6.9% vs local median 3.8% in Lexington-Fayette — top-decile yield for the area; either an underpriced asset or a hidden risk that comps aren't pricing in. Stress-test before assuming the spread holds.
Location & tenants
- Location reads: area grade D — affects rentability + tenant quality, not the cash-flow math above.
- Fayette County (urban): math 35% / reading 45% proficiency, ranked #27 of 165 in KY (top 16%) — families likely to look elsewhere, expect single-tenant / working-renter base with shorter leases.
- Zoned schools: Picadome Elementary School (math 32% / reading 42%, grade F, #255 of 676 statewide, top 42%, 430 students, 56% FRL); Morton Middle School (math 41% / reading 58%, grade C, #25 of 217 statewide, top 12%, 705 students, 43% FRL); Lafayette High School (math 47% / reading 54%, grade D+, #10 of 254 statewide, top 4%, 2,432 students, 38% FRL) — zoned schools at 46% FRL track the district average.
- Market conditions: Rents rising fast (+4.4%/yr); 81 active listings in the ZIP; 27 comparable units currently listed for rent nearby; rentals at typical pace (median 26d on market — plan ~3-4 weeks tenant-placement turnaround); solid renter incomes; 1,036 units permitted in Fayette County in 2024 (542 in 5+ unit buildings).
Forward outlook
- Local home prices are declining (-3.0%/yr); year-one equity from $1k of loan paydown is wiped out by about $6k of value loss. Plan a longer hold.
- Fayette County population projected at +35% by 2050 — long-run rental-demand tailwind backs the buy-and-hold thesis.
Negotiation context
- Only 13 days on market — expect competitive offers; lowballing is unlikely to land.
Risks & watch-outs
- Watch-outs: built in 1916 — expect roof / HVAC / electrical / plumbing capex.
Questions for the listing agent
- Built in 1916 — when were the roof, HVAC, electrical panel, plumbing, and water heater last replaced?
- Is there a deadline driving the sale (1031 exchange, divorce, estate, relocation)? That informs how much negotiation room exists.
- The area grade is low — what's the realistic commute time and amenity access for the typical tenant pool here? Any planned neighborhood developments (good or bad) we should know about?
- What's the average days-on-market for RENTAL listings here right now (not sales)? A rising rental-DOM trend means longer vacancies and softer asking-rent achievability than the comps imply.
- What's the recent tenant-quality profile in this submarket — average credit score on applications, eviction rate, late-payment / NSF rate, and stable-employment percentage? A property-management company in the area should have these aggregated.
- How much new for-sale + rental construction is in the pipeline within 1–3 miles? Heavy new supply typically softens prices + rents 12–24 months out; constrained supply supports both.
Investment metrics
- 1% rule
- 0.82% ✗
- Cap rate
- 6.92%
- Cash-on-cash
- 2.25%
- DSCR
- 1.10
- GRM
- 10.2
CMA / ARV
- ARV (on-the-fly)
- $227,070
- Comps found
- 6
Show comp detail 6 sales within ~0.75 mi
| Address | Dist | Beds/Ba | Sqft | Sold | Price | $/sf | Match |
|---|---|---|---|---|---|---|---|
| 346 Hummingbird Ln | 0.36mi | 2/1.0 | 768 (-12%) | 1mo | $215,000 | $280 | 63 |
| 326 Hummingbird Ln | 0.39mi | 2/1.0 | 768 (-12%) | 10mo | $180,000 | $234 | 54 |
| 268 Mockingbird Ln | 0.54mi | 3/1.0 (+1) | 900 (+3%) | 13mo | $234,900 | $261 | 53 |
| 284 Mockingbird Ln | 0.51mi | 2/1.0 | 825 (-5%) | 20mo | $205,000 | $248 | 51 |
| 1553 Bluebird Ln | 0.52mi | 3/1.0 (+1) | 865 (-1%) | 23mo | $224,900 | $260 | 51 |
| 342 Hummingbird Ln | 0.37mi | 2/1.0 | 768 (-12%) | 20mo | $215,000 | $280 | 46 |
Match score weights: distance 35% · size 25% · config 20% · recency 20%. Top-matched comps best support the ARV.
Projected returns pro-forma
-3.0% appreciation · 4.4% rent growth · sell at horizon
- IRR
- -11.4%
- Equity multiple
- 0.58×
- Total profit
- $-23,482
- Equity at exit
- $29,821
- IRR
- -0.6%
- Equity multiple
- 0.96×
- Total profit
- $-2,332
- Equity at exit
- $17,292
Cash invested: $56,000 (down + closing). Projections, not guarantees.
Landlord ↔ Tenant lean methodology
- Overall (STATE)
- 83 Strongly Landlord-Friendly
- State Kentucky
- 83 Strongly Landlord-Friendly · R+16
- County
- — inherits STATE
- City
- — inherits STATE
ZIP-level market 40503
- Rents YoY
- 4.4%
- Active inventory
- 81
- Price-to-rent
- 10.2×
Monthly cashflow live
- Estimated rent
- $1,641 high interval (Pro) →
- Mortgage (P&I)
- −$1,049
- Tax from tax record
- −$59 /mo · $713/yr
- Insurance
- −$83
- HOA
- −$0
- Vacancy / Maint / Mgmt
- −$345
- Net cashflow
- $105
Break-even live
Sensitivity live
| Price | -10% $218 | -5% $161 | +0% $105 | +5% $48 | +10% $-8 |
|---|---|---|---|---|---|
| Rent | -10% $-25 | -5% $40 | +0% $105 | +5% $170 | +10% $234 |
| Rate | -1.0pp $206 | -0.5pp $156 | base $105 | +0.5pp $53 | +1.0pp $0 |
UW: 25.0% down · 7.5% · 30yr · 1.5% tax · 5.0% vac · 8.0% maint · 8.0% mgmt
Financing live
Cash to close
- Down payment
- $50,000
- Closing costs
- $6,000
- Reserves months
- —
- Total cash needed
- —
Loan-product check · same deal, 3 products live
Conventional
25% down · 7.5% · 30yr
- Down + closing
- —
- Monthly P&I
- —
- Monthly cashflow
- —
- DSCR
- —
- Eligible?
- —
Personal DTI + credit; lowest rate.
DSCR
20% down · 8.5% · 30yr
- Down + closing
- —
- Monthly P&I
- —
- Monthly cashflow
- —
- DSCR
- —
- Eligible?
- —
No personal income docs; deal must DSCR.
Hard money
10% down · 12.0% · 12mo
- Down + closing
- —
- Monthly P&I
- —
- Monthly cashflow
- —
- DSCR
- —
- Eligible?
- —
Short-term bridge; refi at stabilization.
Rent comps 27 comps
| Address | Beds | Baths | Sqft | Rent | $/sqft | DOM | Units | Dist |
|---|---|---|---|---|---|---|---|---|
| 261 Simpson Ave Lexington, KY | 3.0 | 2.0 | 1025 | $1,710 | $1.67 | 16d | 1 | 0.11mi |
| 120 Burley Ave Lexington, KY | 3.0 | 1.0 | 928 | $1,500 | $1.62 | 25d | 1 | 0.16mi |
| 1232 Man O War Pl Unit 2917 Lexington, KY | 1.0 | 1.0 | 689 | $1,125 | $1.63 | 25d | 1 | 0.18mi |
| 380 Virginia Ave Lexington, KY | 2.0 | 1.0–2.0 | 771 | $2,615 | $3.39 | 16d | 50 | 0.26mi |
| 805 Press Ave Lexington, KY | 1.0–2.0 | 1.0 | 507 | $1,450 | $2.86 | 25d | 1 | 0.32mi |
| 342 Waller Ave Lexington, KY | 1.0–2.0 | 1.0–1.5 | 720 | $1,400 | $1.94 | 25d | 1 | 0.40mi |
| 140 Gazette Ave Lexington, KY | 3.0 | 1.5 | 875 | $1,750 | $2.00 | 25d | 1 | 0.43mi |
| 476 Bob O Link Dr Unit B Lexington, KY | 2.0 | 1.0 | 1002 | $1,300 | $1.30 | 25d | 1 | 0.51mi |
| 845 Red Mile Rd Lexington, KY | 1.0–3.0 | 1.0–2.0 | 821 | $1,487 | $1.81 | 16d | 33 | 0.75mi |
| 585 S Upper St #114 Lexington, KY | 2.0 | 2.0 | 1000 | $1,995 | $2.00 | 25d | 1 | 0.80mi |
| 700 Red Mile Rd Lexington, KY | 1.0–2.0 | 1.0 | 699 | $1,295 | $1.85 | 23d | 1 | 0.91mi |
| 330 Rose St Lexington, KY | 1.0–2.0 | 1.0 | 627 | $1,450 | $2.31 | 25d | 1 | 1.11mi |
| 275 S Limestone #115 Lexington, KY | 2.0 | 2.0 | 1010 | $2,500 | $2.48 | 25d | 1 | 1.11mi |
| 261 S Limestone #303 Lexington, KY | 2.0 | 2.0 | 1102 | $2,995 | $2.72 | 25d | 1 | 1.12mi |
| 1729 Nicholasville Rd Unit 1737-313 Lexington, KY | 2.0 | 1.0 | 741 | $1,800 | $2.43 | 25d | 1 | 1.13mi |
| 832 W High St Unit 1 Lexington, KY | 3.0 | 1.5 | 900 | $1,400 | $1.56 | 25d | 1 | 1.21mi |
| 342 Grosvenor Ave Apt 2 Lexington, KY | 1.0 | 1.0 | 650 | $850 | $1.31 | 25d | 1 | 1.27mi |
| 341 Grosvenor Ave Unit 1 Lexington, KY | 3.0 | 2.0 | 700 | $2,050 | $2.93 | 25d | 1 | 1.29mi |
| 341 Grosvenor Ave #4 Lexington, KY | 3.0 | 3.0 | 859 | $2,600 | $3.03 | 25d | 1 | 1.29mi |
| 341 Grosvenor Ave Unit 3 Lexington, KY | 3.0 | 3.0 | 875 | $2,500 | $2.86 | 25d | 1 | 1.29mi |
| 120 E Main St Lexington, KY | 2.0 | 1.0–2.0 | 710 | $2,486 | $3.50 | 16d | 20 | 1.36mi |
| 530 E High St Lexington, KY | 1.0 | 1.0 | 685 | $1,171 | $1.71 | 16d | 1 | 1.39mi |
| 2050 Garden Springs Dr Lexington, KY | 1.0 | 1.0 | 434 | $992 | $2.29 | 25d | 1 | 1.44mi |
| 168 Woodland Ave Unit 2 Lexington, KY | 1.0 | 1.0 | 620 | $925 | $1.49 | 25d | 1 | 1.44mi |
| 1901 Nicholasville Rd Unit 2 Lexington, KY | 2.0 | 1.0 | 1100 | $1,450 | $1.32 | 25d | 1 | 1.45mi |
| 143 Woodland Ave Lexington, KY | 2.0 | 1.0 | 1100 | $1,650 | $1.50 | 25d | 1 | 1.49mi |
| 2070 Garden Springs Dr Lexington, KY | 1.0–2.0 | 1.0 | 712 | $1,150 | $1.61 | 23d | 9 | 1.49mi |
Listing history 10 events
-
2026-06-22days on market $200,000 Active 13 DOM
-
2026-06-18days on market $200,000 Active 10 DOM
-
2026-06-17days on market $200,000 Active 9 DOM
-
2026-06-16days on market $200,000 Active 8 DOM
-
2026-06-15days on market $200,000 Active 7 DOM
-
2026-06-14days on market $200,000 Active 5 DOM
-
2026-06-13days on market $200,000 Active 4 DOM
-
2026-06-10days on market $200,000 Active 2 DOM
-
2026-06-09remarks 699-char remark
-
2026-06-09$200,000 Active 1 DOM
ⓘ Source: listings_history table (triggers on properties + properties_extension) + one-shot
backfill from property_details.listing_events for pre-trigger history.
Tax reassessment forecast KY · Resets to sale price
- Current annual tax
- $713 · $59/mo
- Projected year-2 tax
- $1,720 · $143/mo
- Expected delta
- +$1,007/yr (+$84/mo · 141.3%)
ⓘ Screening estimate from a state-policy table — verify with the county assessor before closing.
Climate risk First Street
- Flood 1/10 Low FEMA zone X (unshaded) · 0% chance over 30 yrs
- Wildfire 1/10 Low
- Heat 4/10 Moderate 7 d/yr ≥101°F today · 19 d/yr by 30 yrs out
- Wind 2/10 Low 100% chance of damaging wind over 30 yrs
- Air quality 1/10 Low 0 unhealthy d/yr today · 0 by 30 yrs out
Nearby sold comps map
Loading sold comps map…
Walkable amenities ~0.75 mi
Loading nearby amenities…
Taxation est. · year 1
- Rental income
- $19,691
- − Mortgage interest
- −$11,203
- − Property taxes
- −$713
- − Insurance
- −$1,000
- − Repairs & maintenance
- −$1,575
- − Management
- −$1,575
- − Depreciation
- −$5,818
- Taxable loss
- −$2,193
- Est. tax savings @ 24.0%
- +$526
- After-tax cash flow
- $1,784/yr
For passive investors: Depreciation is non-cash, so a rental often shows a tax loss while cash-flowing — sheltering income. Rental losses are passive: they offset passive income freely, and up to $25,000/yr can offset ordinary (W-2) income if you actively participate and your MAGI is under $100k (phasing out to $0 by $150k); unused losses carry forward. On sale, claimed depreciation is recaptured at up to 25%, and gains may owe capital-gains tax (a 1031 exchange can defer both). Figures are a year-1 estimate at your 24.0% rate — not tax advice; consult a CPA.
Schools (NCES district)
- District
- Fayette County
- NCES district ID
- 2101860
- Math proficiency
- 35% ▼ -16.00%
- Reading proficiency
- 45% ▼ -13.00%
- Median HH income
- $49,245
- Composite
- 34.38/100
- National rank
- #5211
- State rank
- #27 of 165 in KY
Livability — Lexington-Fayette
No livability data for this city. (Only ~50 U.S. cities are tracked.)
Census & demographics
- Census place
- Lexington-Fayette, KY
- County
- Fayette County · 317,143 people
- City population
- 321,882
- Metro
- Lexington-Fayette, KY
- Population (ZIP)
- 27,451
- Household income
- $76,482
- Rent vs Own
- Severe rent burden
- 1151.0
Population outlook (Fayette County) Hauer SSP2
- Today (2025)
- 363,454 people
- By 2030
- 388,270 · +6.8%
- By 2040
- 438,688 · +20.7%
- By 2050
- 490,667 · +35.0%
- By 2075
- 625,394 · +72.1%
- By 2100
- 721,354 · +98.5%
Race, ethnicity, and origin ACS 2023
- Neighborhood character
- Predominantly White (81%)
- Race & ethnicity
- White 81% Hispanic / Latino 7% Two or more races 7% Asian 6% Black 3%
- Hispanic origin (detail)
- Mexican 4%
- Common ancestry
- Slovak 4% Italian 3% Serbian 3%
- Foreign-born
- 11% · Canada, China, India
- Languages at home
- 87% English-only · Spanish 4% Other Indo-European 3% Other Asian/Pacific 1%
Political lean MEDSL · Fayette
- 2024 margin
- D (+18.1) · D 58.0% · R 39.9% · Other 2.1%
- 2008→2024 swing
- +13.3pp toward D · 2008: 4.8pp · 2024: 18.1pp
- All cycles
- 2024: D+18.1 2020: D+20.8 2016: D+9.5 2012: D+1.0 2008: D+4.8
Not yet ingested
- Civics
- —
Market trends
- HPI YoY
- ▼ -280.10%
- Current HPI
- 241.5612
- Rent YoY
- ▲ 4.40%
- Metro
- Lexington-Fayette, KY
- State GDP YoY
- ▲ 1.81%
- F500 in state
- 4
Industry mix (Fortune 500 HQ in KY)
| Industry | F500 HQs | Revenue |
|---|---|---|
| Healthcare | 1 | $118B |
|
||
| Food / Beverage | 1 | $7B |
|
||
Price history
1 event — show timeline
- 2026-06-08 Listed $200,000 ImagineMLS
Property tax history
+1.8%/yrLatest (2015): $713 · +1.8% YoY. Source: county tax records.
Cash-flow waterfall
monthlySold comps — $/sqft
last 12 mo · ≤1 miLoading sold comps…