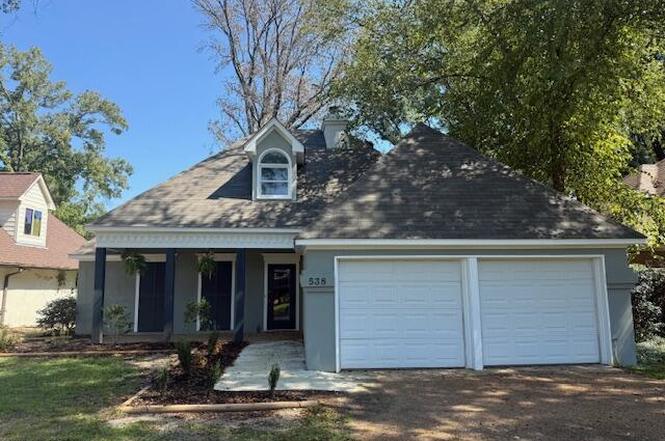
538 S Deerfield Dr · Gluckstadt, MS
Flood risk 7/10 · Major
- FEMA flood zone
- X (unshaded)
- Chance of flooding over 30 yrs
- 0.99%
- Est. flood insurance / yr
- $507 – $1,088
Fire risk 4/10 · Minor
- Est. fire insurance / yr
- $1,241 – $2,305
Heat risk 7/10 · Major
- Hot days now (above 108°F)
- 7 days/yr
- Hot days in 30 yrs
- 21 days/yr
Wind risk 7/10 · Major
- Chance of severe wind over 30 yrs
- 78.0%
Air-quality risk 2/10 · Minimal
- Unhealthy air days now
- 1 days/yr
- Unhealthy air days in 30 yrs
- 1 days/yr
Risk factors via First Street. Map © Google.
Why this score? — see what drove the C grade
The composite is a weighted blend of 9 inputs, each scored 0–100. Each bar is that input's sub-score; the figure is the points it added to the 100-point composite (weight × sub-score).
- Cash flow +20.5/30.0
- ARV discount +15.0/15.0
- DSCR +6.5/10.0
- 1% rule +5.0/10.0
- Schools +4.8/10.0
- Rent growth +2.5/5.0
- Livability +2.5/5.0
- Condition / age +2.5/5.0
- Appreciation +0.0/10.0
$229,000
🖨 Deal sheet 📄 Offer letter ✓ Due diligence
Listing remarks
Move In Ready! Located right on the golf course. 3 spacious bedrooms, 2 full bathrooms, Bonus Room - perfect for a playroom, large office, or guest space. Recently remodeled, with a new roof and new AC Unit. This home blends modern upgrades with a desirable location, making it a rare find you don't want to miss.
Key facts
- New floors
- Bonus room upstairs
- Split plan
Tags
Neighborhood map
What this means for you Summary
Snapshot
- This is a 3-bed/4.0-bath single-family listed at $229k.
Deal economics
- At list price, monthly cash flow is $236 ($3k/yr) — positive.
- The deal already cash-flows at list — no discount required.
- To meet the 1% rule (rent ≥ 1% of price), the offer needs to be $228k (0.4% below list).
- Recommended offer: $202k (12.0% below list) — sets the bar for market timing.
- Cap rate 7.9% vs local median 4.9% in Gluckstadt — top-decile yield for the area; either an underpriced asset or a hidden risk that comps aren't pricing in. Stress-test before assuming the spread holds.
Location & tenants
- Location reads: area grade C — affects rentability + tenant quality, not the cash-flow math above.
- Madison County School District (rural): math 54% / reading 54% proficiency, ranked #3 of 130 in MS (top 2%) — acceptable for families but not a draw, mixed tenant base, ~2y average lease.
- Zoned schools: Madison Crossing Elementary (math 52% / reading 55%, grade C, #49 of 375 statewide, top 13%, 775 students, 100% FRL); Germantown Middle School (math 55% / reading 58%, grade B, #14 of 179 statewide, top 7%, 1,008 students, 100% FRL); Germantown High School (math 34% / reading 41%, grade F, #59 of 197 statewide, top 30%, 1,396 students, 100% FRL) — zoned schools average 100% FRL vs 29% district-wide (70 pts higher); higher-poverty schools than district average — tighter screening recommended.
- Market conditions: 358 active listings in the ZIP; 4 comparable units currently listed for rent nearby; rentals lingering (median 44d on market — plan ~5-8 weeks vacancy on turnover, expect pricing pressure); 50% of comp listings sitting > 30 days — soft ceiling on asking rent; 553 units permitted in Madison County in 2024 (0 in 5+ unit buildings).
Forward outlook
- Local home prices are declining (-3.0%/yr); year-one equity from $2k of loan paydown is wiped out by about $7k of value loss. Plan a longer hold.
- Madison County population projected at +34% by 2050 — long-run rental-demand tailwind backs the buy-and-hold thesis.
Negotiation context
- It's been on market 276 days — a 12% lower offer ($202k) is reasonable based on typical stale-listing flexibility.
- 4 sale attempts since 21y ago; this cycle's ask has dropped $60k (21%) from the opening price — seller is motivated, your offer sets the floor, not the list.
Risks & watch-outs
- Watch-outs: flood insurance adds $66/mo.
- Climate carrying-cost: major flood risk; major wind risk, 78% chance of damaging wind over 30y; extreme-heat days projected 7→21/yr by 2055 (HVAC capex compounding) — expect insurance premiums to compound above CPI over the hold.
Questions for the listing agent
- It's been on market 276 days. Have you received any prior offers? Is the seller open to a 12% concession, seller financing, or rate buy-down credit?
- What's the actual annual flood-insurance premium (NFIP or private), and is the property in a SFHA with mandatory coverage?
- What does the HOA fee cover, when was the last increase, and are there any pending special assessments or reserve-fund shortfalls?
- Why hasn't it sold? Are there any deal-killer items the seller is aware of (foundation, flood, title, zoning, code violations)?
- Is there a deadline driving the sale (1031 exchange, divorce, estate, relocation)? That informs how much negotiation room exists.
- What's the average days-on-market for RENTAL listings here right now (not sales)? A rising rental-DOM trend means longer vacancies and softer asking-rent achievability than the comps imply.
- What's the recent tenant-quality profile in this submarket — average credit score on applications, eviction rate, late-payment / NSF rate, and stable-employment percentage? A property-management company in the area should have these aggregated.
- How much new for-sale + rental construction is in the pipeline within 1–3 miles? Heavy new supply typically softens prices + rents 12–24 months out; constrained supply supports both.
Investment metrics
- 1% rule
- 1.00% ✗
- Cap rate
- 7.88%
- Cash-on-cash
- 5.65%
- DSCR
- 1.25
- GRM
- 8.4
CMA / ARV
- ARV (on-the-fly)
- $301,000
- Comps found
- 12
Show comp detail 12 sales within ~0.75 mi
| Address | Dist | Beds/Ba | Sqft | Sold | Price | $/sf | Match |
|---|---|---|---|---|---|---|---|
| 538 S Deerfield Dr | 0.00mi | 3/2.0 | 1,798 (+3%) | 0mo | $229,000 | $127 | 87 |
| 414 Spike Rdg | 0.18mi | 3/2.0 | 1,890 (+8%) | 1mo | $249,500 | $132 | 69 |
| 712 Honeysuckle Loop | 0.49mi | 3/2.0 | 1,706 (-2%) | 3mo | $314,900 | $185 | 62 |
| 144 Porter Ridge Dr | 0.59mi | 3/2.0 | 1,711 (-2%) | 1mo | $294,900 | $172 | 60 |
| 718 Honeysuckle Loop | 0.47mi | 4/2.0 (+1) | 1,835 (+5%) | 2mo | $349,900 | $191 | 55 |
| 194 Harvey Xing | 0.62mi | 3/2.0 | 1,695 (-3%) | 4mo | $288,000 | $170 | 55 |
| 115 W Elbridge Way | 0.65mi | 3/2.0 | 1,694 (-3%) | 4mo | $275,000 | $162 | 53 |
| 107 Highbury Cv | 0.65mi | 3/2.0 | 1,690 (-3%) | 6mo | $249,900 | $148 | 51 |
| 105 Leah Cv | 0.65mi | 3/2.0 | 1,688 (-4%) | 8mo | $305,000 | $181 | 49 |
| 104 Leah Cv | 0.64mi | 3/2.0 | 1,640 (-6%) | 4mo | $299,900 | $183 | 48 |
| 136 Middlefield Dr #136 | 0.60mi | 3/2.0 | 1,980 (+13%) | 6mo | $280,000 | $141 | 37 |
| 716 Honeysuckle Loop | 0.51mi | 4/2.0 (+1) | 1,502 (-14%) | 3mo | $289,445 | $193 | 37 |
Match score weights: distance 35% · size 25% · config 20% · recency 20%. Top-matched comps best support the ARV.
Projected returns pro-forma
-3.0% appreciation · 3.0% rent growth · sell at horizon
- IRR
- -9.4%
- Equity multiple
- 0.66×
- Total profit
- $-22,072
- Equity at exit
- $34,145
- IRR
- 0.0%
- Equity multiple
- 1.00×
- Total profit
- $207
- Equity at exit
- $19,800
Cash invested: $64,120 (down + closing). Projections, not guarantees.
Landlord ↔ Tenant lean methodology
- Overall (STATE)
- 90 Strongly Landlord-Friendly
- State Mississippi
- 90 Strongly Landlord-Friendly · R+11
- County
- — inherits STATE
- City
- — inherits STATE
ZIP-level market 39046
- Home prices YoY
- -30.1%
- Active inventory
- 358
- Price-to-rent
- 8.4×
Monthly cashflow live
- Estimated rent
- $2,280 medium interval (Pro) →
- Mortgage (P&I)
- −$1,201
- Tax from tax record
- −$165 /mo · $1,979/yr
- Insurance
- −$95
- Flood insurance flood zone
- −$66 /mo · $798/yr
- HOA
- −$38
- Vacancy / Maint / Mgmt
- −$479
- Net cashflow
- $236
Break-even live
UW: 25.0% down · 7.5% · 30yr · 1.5% tax · 5.0% vac · 8.0% maint · 8.0% mgmt
Financing live
Cash to close
- Down payment
- $57,250
- Closing costs
- $6,870
- Reserves months
- —
- Total cash needed
- —
Loan-product check · same deal, 3 products live
Conventional
25% down · 7.5% · 30yr
- Down + closing
- —
- Monthly P&I
- —
- Monthly cashflow
- —
- DSCR
- —
- Eligible?
- —
Personal DTI + credit; lowest rate.
DSCR
20% down · 8.5% · 30yr
- Down + closing
- —
- Monthly P&I
- —
- Monthly cashflow
- —
- DSCR
- —
- Eligible?
- —
No personal income docs; deal must DSCR.
Hard money
10% down · 12.0% · 12mo
- Down + closing
- —
- Monthly P&I
- —
- Monthly cashflow
- —
- DSCR
- —
- Eligible?
- —
Short-term bridge; refi at stabilization.
Rent comps 4 comps
| Address | Beds | Baths | Sqft | Rent | $/sqft | DOM | Units | Dist |
|---|---|---|---|---|---|---|---|---|
| 104 Moss Crk Canton, MS | 3.0 | 2.0 | 1428 | $2,156 | $1.51 | 43d | 1 | 0.45mi |
| 102 Moss Crk Canton, MS | 3.0 | 2.0 | 1498 | $2,253 | $1.50 | 23d | 1 | 0.47mi |
| 161 Harvey Crossing Canton, MS | 3.0 | 2.0 | 1687 | $2,350 | $1.39 | 43d | 1 | 0.71mi |
| 125 Trailbridge Crossing Canton, MS | 3.0 | 2.0 | 1750 | $2,500 | $1.43 | 13d | 1 | 1.23mi |
HOA detail
- Monthly dues
- $38 · $456/yr
Listing history 25 events
-
2026-04-21status Pending
-
2026-04-14price $229,000
-
2026-03-23price $249,900
-
2026-01-01price $255,000
-
2025-12-05price $265,000
-
2025-11-24price $266,000
-
2025-11-11price $268,000
-
2025-09-29price $269,000
-
2025-08-15price $269,900
-
2025-08-08price $285,000
-
2025-07-19$289,000 Active
-
2021-10-20historical
-
2021-10-08historical
-
2019-09-08historical
-
2019-05-09$149,999
-
2018-07-10$159,999
-
2006-04-04soldstatus
-
2005-11-04$169,900
-
2004-09-29soldstatus
-
2001-12-05soldstatus
-
2001-02-12soldstatus
-
2000-04-06soldstatus
-
1996-05-16soldstatus
-
1996-04-23soldstatus
-
1988-05-06soldstatus
ⓘ Source: listings_history table (triggers on properties + properties_extension) + one-shot
backfill from property_details.listing_events for pre-trigger history.
Tax reassessment forecast MS · Resets to sale price
- Current annual tax
- $1,979 · $165/mo
- Projected year-2 tax
- $1,979 · $165/mo
- Expected delta
- $0/yr ($0/mo · -0.0%)
ⓘ Screening estimate from a state-policy table — verify with the county assessor before closing.
Climate risk First Street
- Flood 7/10 Severe FEMA zone X (unshaded) · 99% chance over 30 yrs
- Wildfire 4/10 Moderate
- Heat 7/10 Severe 7 d/yr ≥108°F today · 21 d/yr by 30 yrs out
- Wind 7/10 Severe 78% chance of damaging wind over 30 yrs
- Air quality 2/10 Low 1 unhealthy d/yr today · 1 by 30 yrs out
Nearby sold comps map
Loading sold comps map…
Walkable amenities ~0.75 mi
Loading nearby amenities…
Taxation est. · year 1
- Rental income
- $27,363
- − Mortgage interest
- −$12,828
- − Property taxes
- −$1,979
- − Insurance
- −$1,942
- − Repairs & maintenance
- −$2,189
- − Management
- −$2,189
- − HOA
- −$456
- − Depreciation
- −$6,662
- Taxable loss
- −$882
- Est. tax savings @ 24.0%
- +$212
- After-tax cash flow
- $3,040/yr
For passive investors: Depreciation is non-cash, so a rental often shows a tax loss while cash-flowing — sheltering income. Rental losses are passive: they offset passive income freely, and up to $25,000/yr can offset ordinary (W-2) income if you actively participate and your MAGI is under $100k (phasing out to $0 by $150k); unused losses carry forward. On sale, claimed depreciation is recaptured at up to 25%, and gains may owe capital-gains tax (a 1031 exchange can defer both). Figures are a year-1 estimate at your 24.0% rate — not tax advice; consult a CPA.
Schools (NCES district)
- District
- Madison County School District
- NCES district ID
- 2802790
- Math proficiency
- 54% ▼ -7.00%
- Reading proficiency
- 54% ▼ -7.00%
- Median HH income
- $70,579
- Composite
- 48.08/100
- National rank
- #2188
- State rank
- #3 of 130 in MS
Livability — Gluckstadt
No livability data for this city. (Only ~50 U.S. cities are tracked.)
Census & demographics
- Population (ZIP)
- 29,160
Population outlook (Madison County) Hauer SSP2
- Today (2025)
- 122,509 people
- By 2030
- 131,737 · +7.5%
- By 2040
- 148,930 · +21.6%
- By 2050
- 164,300 · +34.1%
- By 2075
- 197,495 · +61.2%
- By 2100
- 211,429 · +72.6%
Race, ethnicity, and origin ACS 2023
- Neighborhood character
- Majority Black (63%)
- Race & ethnicity
- Black 63% White 31% Hispanic / Latino 4% Two or more races 2%
- Common ancestry
- Italian 2% Slovak 1% Serbian 1%
- Foreign-born
- 2% · Canada, China
- Languages at home
- 95% English-only · Spanish 4%
Political lean MEDSL · Madison
- 2024 margin
- R (+17.3) · D 40.8% · R 58.0% · Other 1.2%
- 2008→2024 swing
- -1.7pp toward R · 2008: -15.6pp · 2024: -17.3pp
- All cycles
- 2024: R+17.3 2020: R+11.8 2016: R+16.1 2012: R+15.7 2008: R+15.6
Not yet ingested
- Civics
- —
Market trends
- HPI YoY
- ▼ -66.50%
- Current HPI
- 154.0441
- Rent YoY
- —
- Metro
- —
- State GDP YoY
- —
- F500 in state
- 0
Price history
+34.8% since first listed25 events — show timeline
- 2026-04-21 Pending — MLSU
- 2026-04-14 Price Changed $229,000 MLSU
- 2026-03-23 Price Changed $249,900 MLSU
- 2026-01-01 Price Changed $255,000 MLSU
- 2025-12-05 Price Changed $265,000 MLSU
- 2025-11-24 Price Changed $266,000 MLSU
- 2025-11-11 Price Changed $268,000 MLSU
- 2025-09-29 Price Changed $269,000 MLSU
- 2025-08-15 Price Changed $269,900 MLSU
- 2025-08-08 Price Changed $285,000 MLSU
- 2025-07-19 Listed $289,000 MLSU
- 2021-10-20 Listing Removed — MLSU
- 2021-10-08 Listing Removed — MLSU
- 2019-09-08 Listing Removed — MLSU
- 2019-05-09 Listed $149,999 MLSU
- 2018-07-10 Listed $159,999 MLSU
- 2006-04-04 Sold (Public Records) — Public Records
- 2005-11-04 Listed $169,900 MLSU
- 2004-09-29 Sold (Public Records) — Public Records
- 2001-12-05 Sold (Public Records) — Public Records
- 2001-02-12 Sold (Public Records) — Public Records
- 2000-04-06 Sold (Public Records) — Public Records
- 1996-05-16 Sold (Public Records) — Public Records
- 1996-04-23 Sold (Public Records) — Public Records
- 1988-05-06 Sold (Public Records) — Public Records
Property tax history
+3.8%/yrLatest (2025): $1,979 · +0.0% YoY. Source: county tax records.
Cash-flow waterfall
monthlySold comps — $/sqft
last 12 mo · ≤1 miLoading sold comps…