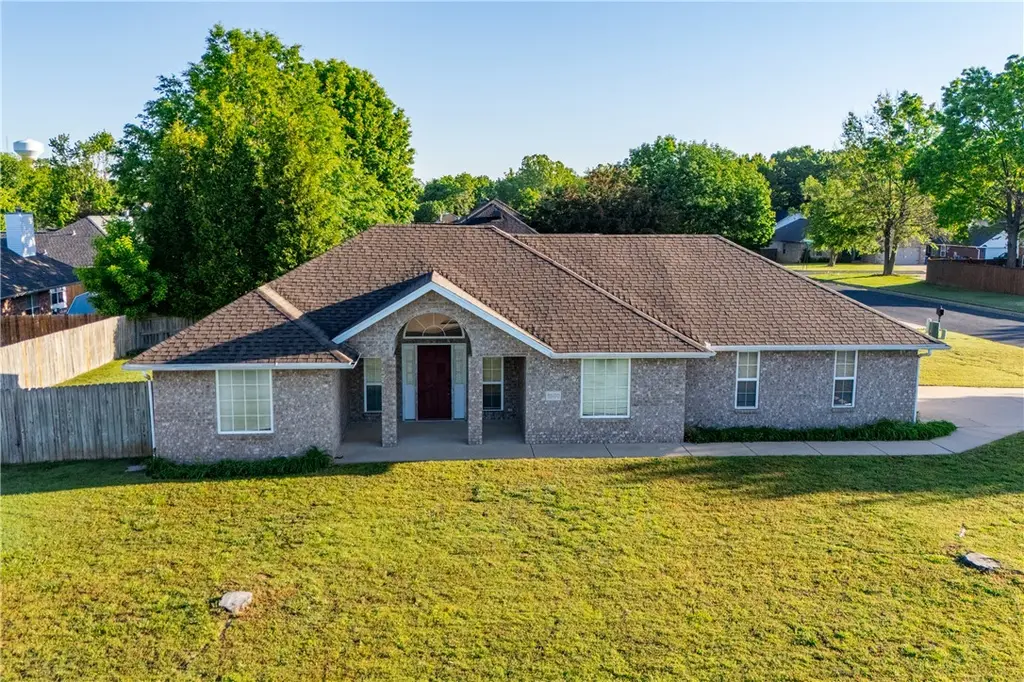
1500 Sanford Dr · Bentonville, AR
Flood risk 1/10 · Minimal
- FEMA flood zone
- X (unshaded)
- Chance of flooding over 30 yrs
- 0.0%
- Est. flood insurance / yr
- $507 – $1,088
Fire risk 4/10 · Minor
- Est. fire insurance / yr
- $1,499 – $2,785
Heat risk 5/10 · Moderate
- Hot days now (above 104°F)
- 7 days/yr
- Hot days in 30 yrs
- 21 days/yr
Wind risk 2/10 · Minimal
- Chance of severe wind over 30 yrs
- 2.0%
Air-quality risk 2/10 · Minimal
- Unhealthy air days now
- 1 days/yr
- Unhealthy air days in 30 yrs
- 1 days/yr
Risk factors via First Street. Map © Google.
Why this score? — see what drove the C+ grade
The composite is a weighted blend of 9 inputs, each scored 0–100. Each bar is that input's sub-score; the figure is the points it added to the 100-point composite (weight × sub-score).
- Cash flow +21.6/30.0
- ARV discount +15.0/15.0
- DSCR +6.9/10.0
- Schools +5.2/10.0
- 1% rule +4.5/10.0
- Livability +4.2/5.0
- Rent growth +3.6/5.0
- Condition / age +2.5/5.0
- Appreciation +0.0/10.0
$359,000
🖨 Deal sheet 📄 Offer letter ✓ Due diligence
Listing remarks
Located in the heart of Bentonville, this 3-bedroom, 2-bath home offers exceptional access to everything that makes Northwest Arkansas one of the country’s most sought-after places to live. Perfectly positioned between Coler Mountain Bike Preserve and Downtown Bentonville, you’re just minutes from world-class biking trails, dining, shopping, entertainment, and the Walmart Home Office. Bella Vista’s renowned trail system is also just a short drive away. Whether you’re looking for a primary residence, investment property, or short-term rental opportunity, this home offers outstanding potential in a highly desirable central location. Enjoy the convenience of the Bentonv
Key facts
- Access to shopping
- Access to dining
- 0.25 acre lot
Tags
Property features AI
Finance
- Other: Spa/Hot tub on property
- Financial info: Property tax information not included per instructions
- HOA & community: Association fee applies (fee details require agent) — $75 annually indicated; Community features: biking, park, trails/paths, shopping, near fire station, near schools
Exterior
- Parking: Attached garage; 2 covered spaces
- Security: No specific security features listed
- Utilities: Public water; Sewer available
- Home design: Single-story; Brick construction; Asphalt shingle roof; Slab foundation; 25+ years old
- Construction: Brick exterior; Asphalt shingle roof; Slab foundation; Built 25+ years ago
- Exterior features: Concrete driveway; Patio; Porch; Privacy wood fencing; Near park; Level lot; Subdivision setting; Central business district nearby; Public/shared paved road frontage
Interior
- Kitchen: Dishwasher; Electric range; Microwave; Disposal
- Bedrooms: Bedroom information not specified
- Flooring: Carpet; Tile
- Bathrooms: 2 full bathrooms
- Heating & cooling: Central heating
- Interior features: Ceiling fans; Eat-in kitchen; Hot tub/Spa; Walk-in closets; Window treatments; Blinds
- Laundry & utility: Washer hookup; Dryer hookup; Washer; Dryer; Gas water heater
Neighborhood map
What this means for you Summary
Snapshot
- This is a 3-bed/2.0-bath single-family listed at $359k.
Deal economics
- At list price, monthly cash flow is $543 ($7k/yr) — positive.
- The deal already cash-flows at list — no discount required.
- To meet the 1% rule (rent ≥ 1% of price), the offer needs to be $341k (5.1% below list).
- Recommended offer: $341k (5.1% below list) — sets the bar for 1% rule.
- Cap rate 8.1% vs local median 2.6% in Bentonville — top-decile yield for the area; either an underpriced asset or a hidden risk that comps aren't pricing in. Stress-test before assuming the spread holds.
Location & tenants
- Location reads 83/100 on livability (#2 in AR, #864 nationally) — a professional / high-income tenant draw. Strengths: employment A+, housing A+, health & safety A+; Watch: amenities F.
- Bentonville School District (urban): math 59% / reading 59% proficiency, ranked #3 of 238 in AR (top 1%) — acceptable for families but not a draw, mixed tenant base, ~2y average lease.
- Market conditions: Rents rising fast (+4.4%/yr); 736 active listings in the ZIP; 34 comparable units currently listed for rent nearby; rentals at typical pace (median 21d on market — plan ~3-4 weeks tenant-placement turnaround); high-income renter base; 4,359 units permitted in Benton County in 2024 (402 in 5+ unit buildings).
- This rent runs 37% of the median local income ($111k/yr) — at the standard rent-burdened threshold; future hikes will face affordability resistance.
Forward outlook
- Local home prices are declining (-3.0%/yr); year-one equity from $2k of loan paydown is wiped out by about $11k of value loss. Plan a longer hold.
- Benton County population projected at +56% by 2050 — long-run rental-demand tailwind backs the buy-and-hold thesis.
Negotiation context
- Only 4 days on market — expect competitive offers; lowballing is unlikely to land.
- Current owner paid $20k; list at $359k implies a 1695% gain — meaningful room to come down on a strong offer.
Risks & watch-outs
- Climate carrying-cost: extreme-heat days projected 7→21/yr by 2055 (HVAC capex compounding) — expect insurance premiums to compound above CPI over the hold.
Questions for the listing agent
- What does the HOA fee cover, when was the last increase, and are there any pending special assessments or reserve-fund shortfalls?
- Is there a deadline driving the sale (1031 exchange, divorce, estate, relocation)? That informs how much negotiation room exists.
- Schools are A-rated — typically a magnet for longer-tenancy family renters. What's the average tenant stay here, and is there a school-zone premium baked into asking?
- What's the average days-on-market for RENTAL listings here right now (not sales)? A rising rental-DOM trend means longer vacancies and softer asking-rent achievability than the comps imply.
- What's the recent tenant-quality profile in this submarket — average credit score on applications, eviction rate, late-payment / NSF rate, and stable-employment percentage? A property-management company in the area should have these aggregated.
- How much new for-sale + rental construction is in the pipeline within 1–3 miles? Heavy new supply typically softens prices + rents 12–24 months out; constrained supply supports both.
Investment metrics
- 1% rule
- 0.95% ✗
- Cap rate
- 8.11%
- Cash-on-cash
- 6.49%
- DSCR
- 1.29
- GRM
- 8.8
CMA / ARV
- ARV (on-the-fly)
- $445,464
- Comps found
- 12
Show comp detail 12 sales within ~0.75 mi
| Address | Dist | Beds/Ba | Sqft | Sold | Price | $/sf | Match |
|---|---|---|---|---|---|---|---|
| 1500 Sanford Dr | 0.00mi | 3/2.0 | 1,614 (0%) | 1mo | $349,000 | $216 | 100 |
| 202 Big Tree Dr | 0.48mi | 3/2.0 | 1,638 (+2%) | 10mo | $399,000 | $244 | 67 |
| 208 NW L St | 0.22mi | 4/2.0 (+1) | 1,728 (+7%) | 10mo | $492,000 | $285 | 65 |
| 708 NW J St | 0.44mi | 3/2.0 | 1,469 (-9%) | 1mo | $440,000 | $300 | 64 |
| 608 NW K St | 0.33mi | 4/2.0 (+1) | 1,796 (+11%) | 1mo | $485,000 | $270 | 60 |
| 9 NW K Pl | 0.69mi | 3/2.0 | 1,719 (+6%) | 2mo | $475,000 | $276 | 56 |
| 809 NW 11th St | 0.75mi | 3/2.0 | 1,526 (-6%) | 2mo | $410,000 | $269 | 55 |
| 718 SW 2nd St | 0.65mi | 2/2.0 (-1) | 1,702 (+6%) | 6mo | $690,000 | $405 | 51 |
| 915 NW 10th St | 0.55mi | 3/2.0 | 1,746 (+8%) | 14mo | $450,000 | $258 | 50 |
| 706 NW 5th St | 0.66mi | 4/2.0 (+1) | 1,810 (+12%) | 4mo | $585,000 | $323 | 40 |
| 305 Cross Ln | 0.70mi | 3/2.0 | 1,800 (+12%) | 9mo | $375,000 | $208 | 40 |
| 308 Crestview Dr | 0.58mi | 4/2.0 (+1) | 1,442 (-11%) | 13mo | $665,000 | $461 | 39 |
Match score weights: distance 35% · size 25% · config 20% · recency 20%. Top-matched comps best support the ARV.
Projected returns pro-forma
-3.0% appreciation · 4.39% rent growth · sell at horizon
- IRR
- -5.0%
- Equity multiple
- 0.81×
- Total profit
- $-18,897
- Equity at exit
- $53,528
- IRR
- 6.1%
- Equity multiple
- 1.48×
- Total profit
- $47,860
- Equity at exit
- $31,040
Cash invested: $100,520 (down + closing). Projections, not guarantees.
Landlord ↔ Tenant lean methodology
- Overall (STATE)
- 92 Strongly Landlord-Friendly
- State Arkansas
- 92 Strongly Landlord-Friendly · R+14
- County
- — inherits STATE
- City
- — inherits STATE
ZIP-level market 72712
- Home prices YoY
- -15.5%
- Rents YoY
- 4.4%
- Active inventory
- 736
- Price-to-rent
- 8.8×
Monthly cashflow live
- Estimated rent
- $3,406 high interval (Pro) →
- Mortgage (P&I)
- −$1,883
- Tax from tax record
- −$109 /mo · $1,307/yr
- Insurance
- −$150
- HOA
- −$6
- Vacancy / Maint / Mgmt
- −$715
- Net cashflow
- $543
Break-even live
UW: 25.0% down · 7.5% · 30yr · 1.5% tax · 5.0% vac · 8.0% maint · 8.0% mgmt
Financing live
Cash to close
- Down payment
- $89,750
- Closing costs
- $10,770
- Reserves months
- —
- Total cash needed
- —
Loan-product check · same deal, 3 products live
Conventional
25% down · 7.5% · 30yr
- Down + closing
- —
- Monthly P&I
- —
- Monthly cashflow
- —
- DSCR
- —
- Eligible?
- —
Personal DTI + credit; lowest rate.
DSCR
20% down · 8.5% · 30yr
- Down + closing
- —
- Monthly P&I
- —
- Monthly cashflow
- —
- DSCR
- —
- Eligible?
- —
No personal income docs; deal must DSCR.
Hard money
10% down · 12.0% · 12mo
- Down + closing
- —
- Monthly P&I
- —
- Monthly cashflow
- —
- DSCR
- —
- Eligible?
- —
Short-term bridge; refi at stabilization.
Rent comps 34 comps
| Address | Beds | Baths | Sqft | Rent | $/sqft | DOM | Units | Dist |
|---|---|---|---|---|---|---|---|---|
| 304 Coachlight Dr Unit 1221882P Bentonville, AR | 4.0 | 2.0 | 1926 | $5,773 | $3.00 | 14d | 1 | 0.05mi |
| 214 NW L St Unit 1363336P Bentonville, AR | 4.0 | 2.0 | 1377 | $3,995 | $2.90 | 21d | 1 | 0.17mi |
| 1802 NW Mustang Ave Unit 1241310P Bentonville, AR | 4.0 | 3.0 | 1991 | $3,625 | $1.82 | 21d | 1 | 0.29mi |
| 107 NW Winfield Ln Bentonville, AR | 3.0 | 2.0 | 2044 | $2,695 | $1.32 | 23d | 1 | 0.36mi |
| 312 Crestview Dr Unit 1297039P Bentonville, AR | 3.0 | 2.0 | 1291 | $2,402 | $1.86 | 21d | 1 | 0.57mi |
| 717 NW 6th St Bentonville, AR | 3.0 | 1.5 | 1320 | $1,795 | $1.36 | 14d | 1 | 0.59mi |
| 307 S Walton Blvd Bentonville, AR | 2.0 | 1.0–2.0 | 796 | $3,000 | $3.77 | 14d | 1 | 0.61mi |
| 406 NW Retreat Ln Bentonville, AR | 3.0 | 2.5 | 1750 | $4,400 | $2.51 | 23d | 1 | 0.75mi |
| 414 NW Retreat Ln Unit 1221809P Bentonville, AR | 3.0 | 2.5 | 1743 | $6,267 | $3.60 | 14d | 1 | 0.76mi |
| 649 SW 2nd St Bentonville, AR | 4.0 | 3.0 | 2176 | $4,700 | $2.16 | 23d | 1 | 0.77mi |
| 703 NW 10th St Unit 1221918P Bentonville, AR | 3.0 | 2.0 | 1280 | $3,785 | $2.96 | 14d | 1 | 0.80mi |
| 514 Hook St Unit 1363341P Bentonville, AR | 2.0 | 1.0 | 1119 | $3,551 | $3.17 | 14d | 1 | 0.80mi |
| 503 NW D St Unit 1363333P Bentonville, AR | 2.0 | 2.5 | 2163 | $5,414 | $2.50 | 14d | 1 | 0.81mi |
| 501 SW Duke Ave Unit 1221919P Bentonville, AR | 3.0 | 2.0 | 1722 | $4,245 | $2.47 | 14d | 1 | 0.85mi |
| 442 SW Glover St Bentonville, AR | 3.0 | 2.5 | 1893 | $5,000 | $2.64 | 23d | 1 | 0.92mi |
| 342 SW D St Bentonville, AR | 3.0 | 2.5 | 1660 | $1,995 | $1.20 | 23d | 1 | 0.97mi |
| 2312 SW Morris St Bentonville, AR | 3.0 | 2.0 | 1188 | $1,350 | $1.14 | 14d | 1 | 1.00mi |
| Stonegate Duplexes Bentonville, AR | 3.0 | 2.0 | 1225 | $1,350 | $1.10 | 23d | 2 | 1.06mi |
| Elm Tree Townhomes Bentonville, AR | 2.0–3.0 | 2.5 | 1486 | $1,795 | $1.21 | 14d | 2 | 1.11mi |
| 444 SW B St Bentonville, AR | 3.0 | 2.5 | 1608 | $2,550 | $1.59 | 23d | 1 | 1.12mi |
| 410 SW B St Unit B Bentonville, AR | 2.0 | 2.5 | 1680 | $2,550 | $1.52 | 23d | 1 | 1.12mi |
| 4 Jonquilla Way Unit B Bentonville, AR | 4.0 | 2.5 | 1716 | $1,900 | $1.11 | 23d | 1 | 1.13mi |
| 210 NW 9th St Unit 1 Bentonville, AR | 3.0 | 3.5 | 2146 | $4,150 | $1.93 | 23d | 1 | 1.15mi |
| 208 NW 9th St Unit 1 Bentonville, AR | 3.0 | 3.5 | 2147 | $4,150 | $1.93 | 21d | 1 | 1.15mi |
| 109 NW Ozark Way Unit 1221875P Bentonville, AR | 4.0 | 3.0 | 2055 | $9,114 | $4.44 | 21d | 1 | 1.15mi |
| 2607 SW 10th St Bentonville, AR | 3.0 | 2.0 | 1295 | $1,650 | $1.27 | 23d | 1 | 1.20mi |
| 644 SW B St Bentonville, AR | 2.0 | 2.5 | 1783 | $3,000 | $1.68 | 23d | 1 | 1.22mi |
| 911 SW Cheyenne Dr Bentonville, AR | 3.0 | 2.0 | 1388 | $1,700 | $1.22 | 23d | 1 | 1.23mi |
| 501 SW 11th St Unit A Bentonville, AR | 2.0 | 1.0 | 1050 | $1,150 | $1.10 | 21d | 1 | 1.33mi |
| 703 SE A St Unit 1241316P Bentonville, AR | 2.0 | 2.5 | 1528 | $2,409 | $1.58 | 23d | 1 | 1.42mi |
| 707 SE A St Unit 1241300P Bentonville, AR | 2.0 | 2.5 | 1506 | $3,375 | $2.24 | 14d | 1 | 1.42mi |
| 300 SE D St Bentonville, AR | 2.0 | 1.0–2.0 | 840 | $2,200 | $2.62 | 13d | 72 | 1.43mi |
| 3705 SW High Point Ave Bentonville, AR | 3.0 | 2.0 | 1625 | $1,800 | $1.11 | 23d | 1 | 1.45mi |
| 1525 NW Shores Loop Bentonville, AR | 1.0–2.0 | 1.0–2.5 | 1082 | $2,675 | $2.47 | 14d | 13 | 1.46mi |
HOA detail
- Monthly dues
- $6 · $72/yr
Listing history 3 events
-
2026-05-12status Pending
-
2026-05-08$359,000 Active
-
1995-04-19soldstatus $20,000
ⓘ Source: listings_history table (triggers on properties + properties_extension) + one-shot
backfill from property_details.listing_events for pre-trigger history.
Tax reassessment forecast AR · Resets to sale price
- Current annual tax
- $1,307 · $109/mo
- Projected year-2 tax
- $2,298 · $191/mo
- Expected delta
- +$990/yr (+$83/mo · 75.8%)
ⓘ Screening estimate from a state-policy table — verify with the county assessor before closing.
Climate risk First Street
- Flood 1/10 Low FEMA zone X (unshaded) · 0% chance over 30 yrs
- Wildfire 4/10 Moderate
- Heat 5/10 Major 7 d/yr ≥104°F today · 21 d/yr by 30 yrs out
- Wind 2/10 Low 2% chance of damaging wind over 30 yrs
- Air quality 2/10 Low 1 unhealthy d/yr today · 1 by 30 yrs out
Nearby sold comps map
Loading sold comps map…
Walkable amenities ~0.75 mi
Loading nearby amenities…
Taxation est. · year 1
- Rental income
- $40,867
- − Mortgage interest
- −$20,110
- − Property taxes
- −$1,307
- − Insurance
- −$1,795
- − Repairs & maintenance
- −$3,269
- − Management
- −$3,269
- − HOA
- −$72
- − Depreciation
- −$10,444
- Taxable income
- $601
- Est. tax owed @ 24.0%
- −$144
- After-tax cash flow
- $6,375/yr
For passive investors: Depreciation is non-cash, so a rental often shows a tax loss while cash-flowing — sheltering income. Rental losses are passive: they offset passive income freely, and up to $25,000/yr can offset ordinary (W-2) income if you actively participate and your MAGI is under $100k (phasing out to $0 by $150k); unused losses carry forward. On sale, claimed depreciation is recaptured at up to 25%, and gains may owe capital-gains tax (a 1031 exchange can defer both). Figures are a year-1 estimate at your 24.0% rate — not tax advice; consult a CPA.
Schools (NCES district)
- District
- Bentonville School District
- NCES district ID
- 0503060
- Math proficiency
- 59% ▼ -8.00%
- Reading proficiency
- 59% ▼ -6.00%
- Median HH income
- $66,721
- Composite
- 51.85/100
- National rank
- #1661
- State rank
- #3 of 238 in AR
Livability — Bentonville
- Score
- 83/100
- State rank
- #2
- US rank
- #864
Category grades
Schools grade is shown separately in the Schools card above.
Census & demographics
- Census place
- Bentonville, AR
- County
- Benton County · 259,241 people
- City population
- 67,689
- Metro
- Fayetteville-Springdale-Rogers, AR
- Population (ZIP)
- 38,690
- Household income
- $110,514
- Rent vs Own
- Severe rent burden
- 932.0
Population outlook (Benton County) Hauer SSP2
- Today (2025)
- 318,683 people
- By 2030
- 353,481 · +10.9%
- By 2040
- 425,280 · +33.4%
- By 2050
- 497,239 · +56.0%
- By 2075
- 662,114 · +107.8%
- By 2100
- 776,431 · +143.6%
Race, ethnicity, and origin ACS 2023
- Neighborhood character
- Diverse neighborhood (Simpson 0.55)
- Race & ethnicity
- White 66% Two or more races 17% Hispanic / Latino 10% Asian 6% Black 4%
- Hispanic origin (detail)
- Mexican 7%
- Common ancestry
- Slovak 3% Italian 2% Lithuanian 2%
- Foreign-born
- 11% · Canada, Vietnam, China
- Languages at home
- 89% English-only · Spanish 6% Other Asian/Pacific 2% Other Indo-European 2%
Political lean MEDSL · Benton
- 2024 margin
- Strong R (+27.0) · D 35.2% · R 62.1% · Other 2.7%
- 2008→2024 swing
- +9.6pp toward D · 2008: -36.5pp · 2024: -27.0pp
- All cycles
- 2024: R+27.0 2020: R+26.4 2016: R+34.9 2012: R+40.4 2008: R+36.5
Not yet ingested
- Civics
- —
Market trends
- HPI YoY
- ▼ -66.76%
- Current HPI
- 365.1641
- Rent YoY
- ▲ 4.39%
- Metro
- Fayetteville-Springdale-Rogers, AR
- State GDP YoY
- ▲ 3.80%
- F500 in state
- 10
Industry mix (Fortune 500 HQ in AR)
| Industry | F500 HQs | Revenue |
|---|---|---|
| Retail | 1 | $681B |
|
||
| Food / Agriculture | 1 | $53B |
|
||
| Retail / Energy | 1 | $22B |
|
||
| Transportation / Logistics | 1 | $12B |
|
||
| Energy | 1 | $4B |
|
||
Price history
+1695.0% since first listed3 events — show timeline
- 2026-05-12 Pending — NWARMLS
- 2026-05-08 Listed $359,000 NWARMLS
- 1995-04-19 Sold (Public Records) $20,000 Public Records
Property tax history
-0.9%/yrLatest (2025): $1,307 · -6.1% YoY. Source: county tax records.
Cash-flow waterfall
monthlySold comps — $/sqft
last 12 mo · ≤1 miLoading sold comps…