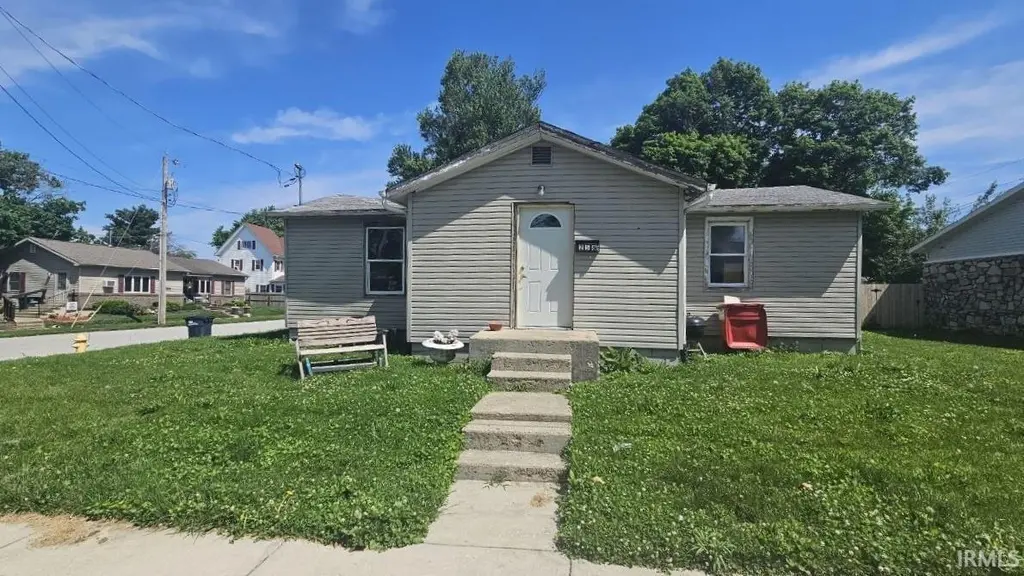
258 W White St · Frankfort, IN
Flood risk 1/10 · Minimal
- FEMA flood zone
- X (unshaded)
- Chance of flooding over 30 yrs
- 0.0%
- Est. flood insurance / yr
- $473 – $860
Fire risk 1/10 · Minimal
- Est. fire insurance / yr
- $717 – $1,331
Heat risk 3/10 · Minor
- Hot days now (above 100°F)
- 7 days/yr
- Hot days in 30 yrs
- 18 days/yr
Wind risk 2/10 · Minimal
- Chance of severe wind over 30 yrs
- 1.0%
Air-quality risk 3/10 · Minor
- Unhealthy air days now
- 2 days/yr
- Unhealthy air days in 30 yrs
- 3 days/yr
Risk factors via First Street. Map © Google.
Why this score? — see what drove the B- grade
The composite is a weighted blend of 9 inputs, each scored 0–100. Each bar is that input's sub-score; the figure is the points it added to the 100-point composite (weight × sub-score).
- Cash flow +30.0/30.0
- 1% rule +10.0/10.0
- DSCR +10.0/10.0
- ARV discount +7.5/15.0
- Livability +3.7/5.0
- Rent growth +2.5/5.0
- Condition / age +2.5/5.0
- Schools +2.4/10.0
- Appreciation +0.0/10.0
$46,500
🖨 Deal sheet 📄 Offer letter ✓ Due diligence
Listing remarks
Investor special! Located among many well maintained homes. Property is being sold as it is and will require significant repairs and updates. Great potential for renovation, possible rental or redevelopment. Cash or renovation financing likely best. Agents, please see agent remarks.
Key facts
- 4,138 sq ft lot
- Built 1947
Property features AI
Exterior
- Utilities: Public water; Public sewer
- Home design: Single-family residence (site-built); One story
- Construction: Vinyl siding; Asphalt roof
- Exterior features: Level lot; Shed(s) on property
Interior
- Bedrooms: Bedrooms located on main level
- Bathrooms: One full bathroom on the main level
- Heating & cooling: Natural gas forced-air heating; Central air conditioning
- Interior features: Full unfinished basement; Total of 4 rooms
- Laundry & utility: Main-level laundry
Neighborhood map
What this means for you Summary
Snapshot
- This is a 2-bed/1.0-bath single-family listed at $46k.
Deal economics
- At list price, monthly cash flow is $439 ($5k/yr) — positive.
- The deal already cash-flows at list — no discount required.
- Meets the 1% rule at list price ($972 rent vs $46k).
- Cap rate 17.6% vs local median 3.9% in Frankfort — top-decile yield for the area; either an underpriced asset or a hidden risk that comps aren't pricing in. Stress-test before assuming the spread holds.
Location & tenants
- Location reads 73/100 on livability (#107 in IN) — a middle-class / working-renter tenant base. Strengths: crime A+, cost of living A+, housing A+; Watch: amenities F, commute F, employment D-.
- Community Schools Of Frankfort (rural): math 27% / reading 30% proficiency, ranked #251 of 301 in IN (top 83%) — low school quality limits family demand, transient renter base, plan for 1-2y turnover; 68% free/reduced lunch — lower-income household profile, screen leases tightly.
- Zoned schools: Frankfort Middle School (math 19% / reading 27%, grade F, #263 of 330 statewide, top 80%, 706 students, 83% FRL); Frankfort High School (math 8% / reading 42%, grade F, #323 of 369 statewide, top 88%, 895 students, 75% FRL).
- Market conditions: 129 active listings in the ZIP; 13 comparable units currently listed for rent nearby; rentals leasing fast (median 12d on market — plan ~1-2 weeks tenant-placement turnaround); 59 units permitted in Clinton County in 2024 (0 in 5+ unit buildings).
Forward outlook
- Local home prices are declining (-3.0%/yr); year-one equity from $321 of loan paydown is wiped out by about $1k of value loss. Plan a longer hold.
- Clinton County population projected at -15% by 2050 — secular population decline; favor cash flow + early exit over multi-decade hold.
- At projected returns (-3.0% appreciation + 3.0% rent growth), your $13k cash investment doubles in ~3 years — after that, you're playing with house money.
Negotiation context
- Only 1 days on market — expect competitive offers; lowballing is unlikely to land.
Risks & watch-outs
- Watch-outs: built in 1947 — expect roof / HVAC / electrical / plumbing capex.
Questions for the listing agent
- Built in 1947 — when were the roof, HVAC, electrical panel, plumbing, and water heater last replaced?
- Is there a deadline driving the sale (1031 exchange, divorce, estate, relocation)? That informs how much negotiation room exists.
- Schools are F-rated, which usually means shorter tenancies and higher turnover. Who's the typical renter profile here, and what's been the actual vacancy rate?
- What's the average days-on-market for RENTAL listings here right now (not sales)? A rising rental-DOM trend means longer vacancies and softer asking-rent achievability than the comps imply.
- What's the recent tenant-quality profile in this submarket — average credit score on applications, eviction rate, late-payment / NSF rate, and stable-employment percentage? A property-management company in the area should have these aggregated.
- How much new for-sale + rental construction is in the pipeline within 1–3 miles? Heavy new supply typically softens prices + rents 12–24 months out; constrained supply supports both.
Investment metrics
- 1% rule
- 2.09% ✓
- Cap rate
- 17.62%
- Cash-on-cash
- 40.44%
- DSCR
- 2.80
- GRM
- 4.0
CMA / ARV
- ARV (on-the-fly)
- $133,632
- Comps found
- 11
Show comp detail 11 sales within ~0.75 mi
| Address | Dist | Beds/Ba | Sqft | Sold | Price | $/sf | Match |
|---|---|---|---|---|---|---|---|
| 1210 S Columbia St | 0.12mi | 2/1.0 | 936 (+1%) | 2mo | $110,000 | $118 | 91 |
| 1854 S Jackson St. St | 0.28mi | 2/1.0 | 940 (+1%) | 0mo | $135,000 | $144 | 84 |
| 854 S 1st St | 0.32mi | 2/1.0 | 980 (+6%) | 1mo | $175,000 | $179 | 75 |
| 1162 S Second St | 0.17mi | 2/1.0 | 984 (+6%) | 11mo | $168,500 | $171 | 72 |
| 1154 S Columbia St | 0.17mi | 2/1.0 | 988 (+6%) | 11mo | $95,000 | $96 | 72 |
| 301 W Wabash St | 0.68mi | 2/1.0 | 902 (-3%) | 10mo | $53,000 | $59 | 55 |
| 979 S Fifth St | 0.37mi | 3/1.0 (+1) | 960 (+3%) | 20mo | $125,000 | $130 | 55 |
| 556 Elmwood Dr | 0.44mi | 2/1.0 | 870 (-6%) | 21mo | $138,000 | $159 | 51 |
| 556 W Boone St | 0.61mi | 2/1.0 | 1,014 (+9%) | 6mo | $132,500 | $131 | 51 |
| 458 Hemlock Dr | 0.45mi | 3/1.0 (+1) | 970 (+4%) | 24mo | $164,900 | $170 | 47 |
| 408 W South St | 0.65mi | 2/1.0 | 990 (+7%) | 22mo | $155,000 | $157 | 41 |
Match score weights: distance 35% · size 25% · config 20% · recency 20%. Top-matched comps best support the ARV.
Projected returns pro-forma
-3.0% appreciation · 3.0% rent growth · sell at horizon
- IRR
- 36.9%
- Equity multiple
- 2.57×
- Total profit
- $20,432
- Equity at exit
- $6,933
- IRR
- 43.5%
- Equity multiple
- 5.14×
- Total profit
- $53,857
- Equity at exit
- $4,020
Cash invested: $13,020 (down + closing). Projections, not guarantees.
Landlord ↔ Tenant lean methodology
- Overall (STATE)
- 90 Strongly Landlord-Friendly
- State Indiana
- 90 Strongly Landlord-Friendly · R+11
- County
- — inherits STATE
- City
- — inherits STATE
ZIP-level market 46041
- Home prices YoY
- -17.8%
- Active inventory
- 129
- Price-to-rent
- 4.0×
Monthly cashflow live
- Estimated rent
- $972 high interval (Pro) →
- Mortgage (P&I)
- −$244
- Tax from tax record
- −$66 /mo · $790/yr
- Insurance
- −$19
- HOA
- −$0
- Vacancy / Maint / Mgmt
- −$204
- Net cashflow
- $439
Break-even live
UW: 25.0% down · 7.5% · 30yr · 1.5% tax · 5.0% vac · 8.0% maint · 8.0% mgmt
Financing live
Cash to close
- Down payment
- $11,625
- Closing costs
- $1,395
- Reserves months
- —
- Total cash needed
- —
Loan-product check · same deal, 3 products live
Conventional
25% down · 7.5% · 30yr
- Down + closing
- —
- Monthly P&I
- —
- Monthly cashflow
- —
- DSCR
- —
- Eligible?
- —
Personal DTI + credit; lowest rate.
DSCR
20% down · 8.5% · 30yr
- Down + closing
- —
- Monthly P&I
- —
- Monthly cashflow
- —
- DSCR
- —
- Eligible?
- —
No personal income docs; deal must DSCR.
Hard money
10% down · 12.0% · 12mo
- Down + closing
- —
- Monthly P&I
- —
- Monthly cashflow
- —
- DSCR
- —
- Eligible?
- —
Short-term bridge; refi at stabilization.
Rent comps 13 comps
| Address | Beds | Baths | Sqft | Rent | $/sqft | DOM | Units | Dist |
|---|---|---|---|---|---|---|---|---|
| 1053 S Jackson St Frankfort, IN | 1.0–2.0 | 1.0 | 850 | $995 | $1.17 | 12d | 2 | 0.29mi |
| 501 S Main St Unit 2 Frankfort, IN | 3.0 | 1.0 | 700 | $850 | $1.21 | 21d | 1 | 0.56mi |
| 453 E Walnut St Unit 3 Frankfort, IN | 1.0 | 1.0 | 600 | $875 | $1.46 | 12d | 1 | 0.80mi |
| 458 W Clinton St Unit 02 Frankfort, IN | 2.0 | 1.0 | 780 | $725 | $0.93 | 4d | 1 | 0.83mi |
| 757 E Clinton St Unit 3a Frankfort, IN | 1.0 | 1.0 | 900 | $800 | $0.89 | 43d | 1 | 0.96mi |
| 350 N Main St Unit 3C Frankfort, IN | 2.0 | 2.0 | 970 | $1,200 | $1.24 | 4d | 1 | 0.98mi |
| 457 N Main St Apt 3 Frankfort, IN | 1.0 | 1.0 | 750 | $900 | $1.20 | 20d | 1 | 1.07mi |
| 455 E Barner St Unit 1 Frankfort, IN | 2.0 | 1.0 | 640 | $975 | $1.52 | 12d | 1 | 1.23mi |
| 402 E Green St Frankfort, IN | 3.0 | 1.0 | 1100 | $1,000 | $0.91 | 43d | 1 | 1.36mi |
| 201 W Palmer St Frankfort, IN | 2.0 | 1.0 | 950 | $1,049 | $1.10 | 12d | 1 | 1.37mi |
| 201 W Palmer St Frankfort, IN | 2.0 | 1.0 | 950 | $1,049 | $1.10 | 43d | 1 | 1.37mi |
| 201 W Palmer St Frankfort, IN | 2.0 | 1.0 | 850 | $990 | $1.16 | 3d | 1 | 1.37mi |
| 1052 John St Frankfort, IN | 3.0 | 1.0 | 900 | $1,395 | $1.55 | 13d | 1 | 1.43mi |
Listing history 2 events
-
2026-06-02remarks 283-char remark
-
2026-06-02$46,500 Active 1 DOM
ⓘ Source: listings_history table (triggers on properties + properties_extension) + one-shot
backfill from property_details.listing_events for pre-trigger history.
Tax reassessment forecast IN · Partial reset (capped growth)
- Current annual tax
- $790 · $66/mo
- Projected year-2 tax
- $790 · $66/mo
- Expected delta
- $0/yr ($0/mo · 0.0%)
ⓘ Screening estimate from a state-policy table — verify with the county assessor before closing.
Climate risk First Street
- Flood 1/10 Low FEMA zone X (unshaded) · 0% chance over 30 yrs
- Wildfire 1/10 Low
- Heat 3/10 Moderate 7 d/yr ≥100°F today · 18 d/yr by 30 yrs out
- Wind 2/10 Low 100% chance of damaging wind over 30 yrs
- Air quality 3/10 Moderate 2 unhealthy d/yr today · 3 by 30 yrs out
Nearby sold comps map
Loading sold comps map…
Walkable amenities ~0.75 mi
Loading nearby amenities…
Taxation est. · year 1
- Rental income
- $11,664
- − Mortgage interest
- −$2,605
- − Property taxes
- −$790
- − Insurance
- −$232
- − Repairs & maintenance
- −$933
- − Management
- −$933
- − Depreciation
- −$1,353
- Taxable income
- $4,818
- Est. tax owed @ 24.0%
- −$1,156
- After-tax cash flow
- $4,109/yr
For passive investors: Depreciation is non-cash, so a rental often shows a tax loss while cash-flowing — sheltering income. Rental losses are passive: they offset passive income freely, and up to $25,000/yr can offset ordinary (W-2) income if you actively participate and your MAGI is under $100k (phasing out to $0 by $150k); unused losses carry forward. On sale, claimed depreciation is recaptured at up to 25%, and gains may owe capital-gains tax (a 1031 exchange can defer both). Figures are a year-1 estimate at your 24.0% rate — not tax advice; consult a CPA.
Schools (NCES district)
- District
- Community Schools Of Frankfort
- NCES district ID
- 1803660
- Math proficiency
- 27% ▼ -3.00%
- Reading proficiency
- 30% ▼ -6.00%
- Median HH income
- $42,144
- Composite
- 24.2/100
- National rank
- #7728
- State rank
- #251 of 301 in IN
Livability — Frankfort
- Score
- 73/100
- State rank
- #107
- US rank
- #5623
Category grades
Schools grade is shown separately in the Schools card above.
Census & demographics
- Census place
- Frankfort, IN
- Population (ZIP)
- 23,359
Population outlook (Clinton County) Hauer SSP2
- Today (2025)
- 31,197 people
- By 2030
- 30,257 · -3.0%
- By 2040
- 28,383 · -9.0%
- By 2050
- 26,644 · -14.6%
- By 2075
- 23,858 · -23.5%
- By 2100
- 22,236 · -28.7%
Race, ethnicity, and origin ACS 2023
- Neighborhood character
- Predominantly White (73%)
- Race & ethnicity
- White 73% Hispanic / Latino 24% Two or more races 11%
- Hispanic origin (detail)
- Mexican 22%
- Common ancestry
- Iranian 1% Italian 1% Slovak 1%
- Foreign-born
- 11% · Canada, Philippines
- Languages at home
- 86% English-only · Spanish 14%
Political lean MEDSL · Clinton
- 2024 margin
- Solid R (+48.0) · D 25.2% · R 73.2% · Other 1.6%
- 2008→2024 swing
- -35.0pp toward R · 2008: -13.0pp · 2024: -48.0pp
- All cycles
- 2024: R+48.0 2020: R+46.1 2016: R+48.0 2012: R+30.7 2008: R+13.0
Not yet ingested
- Civics
- —
Market trends
- HPI YoY
- ▼ -57.02%
- Current HPI
- 263.2258
- Rent YoY
- —
- Metro
- —
- State GDP YoY
- ▲ 2.90%
- F500 in state
- 18
Industry mix (Fortune 500 HQ in IN)
| Industry | F500 HQs | Revenue |
|---|---|---|
| Industrial Machinery | 2 | $37B |
|
||
| Healthcare | 1 | $177B |
|
||
| Pharmaceuticals | 1 | $45B |
|
||
| Metals / Steel | 1 | $18B |
|
||
| Agriculture | 1 | $17B |
|
||
| Packaging | 1 | $12B |
|
||
Price history
1 event — show timeline
- 2026-06-02 Listed $46,500 IRMLS
Property tax history
+1.9%/yrLatest (2024): $790 · -4.5% YoY. Source: county tax records.
Cash-flow waterfall
monthlySold comps — $/sqft
last 12 mo · ≤1 miLoading sold comps…