 🏗️ New Construction
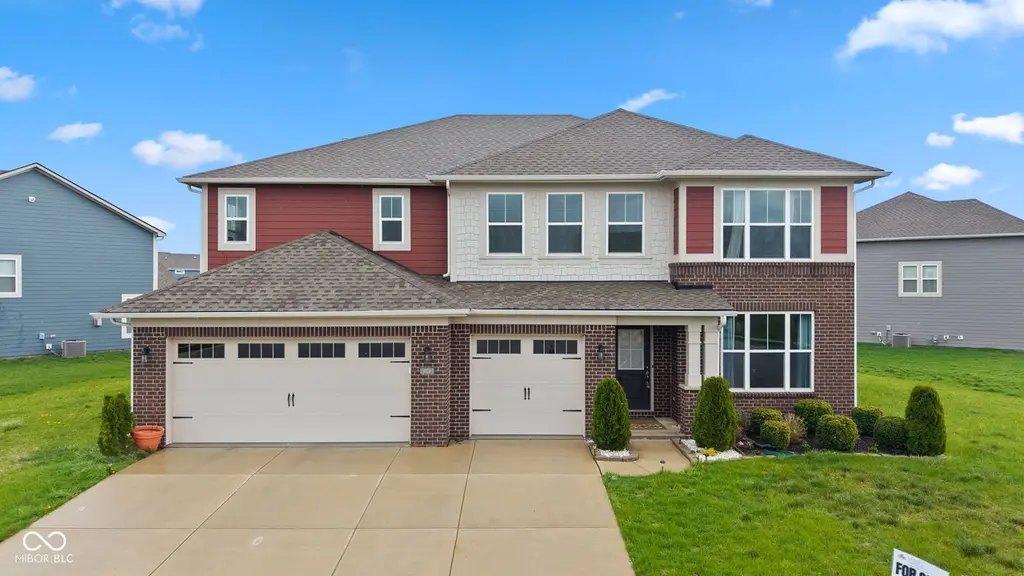
9719 Cimmaron Ave · McCordsville, IN
Flood risk 1/10 · Minimal
- FEMA flood zone
- X (unshaded)
- Chance of flooding over 30 yrs
- 0.0%
- Est. flood insurance / yr
- $507 – $1,088
Fire risk 1/10 · Minimal
- Est. fire insurance / yr
- $717 – $1,331
Heat risk 3/10 · Minor
- Hot days now (above 100°F)
- 7 days/yr
- Hot days in 30 yrs
- 18 days/yr
Wind risk 2/10 · Minimal
- Chance of severe wind over 30 yrs
- 1.0%
Air-quality risk 2/10 · Minimal
- Unhealthy air days now
- 1 days/yr
- Unhealthy air days in 30 yrs
- 2 days/yr
Risk factors via First Street. Map © Google.
Why this score? — see what drove the C grade
The composite is a weighted blend of 9 inputs, each scored 0–100. Each bar is that input's sub-score; the figure is the points it added to the 100-point composite (weight × sub-score).
- Cash flow +23.6/30.0
- DSCR +7.6/10.0
- ARV discount +7.5/15.0
- 1% rule +5.8/10.0
- Schools +4.1/10.0
- Rent growth +3.8/5.0
- Livability +3.5/5.0
- Condition / age +2.5/5.0
- Appreciation +0.0/10.0
$524,900
🖨 Deal sheet 📄 Offer letter ✓ Due diligence
Listing remarks MLS
Listed and Sold! For comp purposes only.
Key facts
- Large kitchen island
- Stone countertops
- Shaker cabinets
Tags
Property features AI
Finance
- HOA & community: HOA present; semi-annual fee (fee covers maintenance and snow removal); HOA disclosures include covenants & restrictions, rental restrictions, and rules & regulations; Community amenities include playground, pool, and sidewalks
Exterior
- Parking: Attached 3-car garage (approx. 660 sq ft)
- Utilities: Public water; Municipal sewer connected; No solid waste service listed
- Home design: Single family residence — new construction; Two levels; Attached property; Accessible entrance
- Construction: Vinyl with brick exterior; Brick and poured concrete foundation; Built by Lennar
- Exterior features: Quarter to half acre lot (approximately 0.31 acres)
Interior
- Kitchen: Gas cooktop; Double oven; Range hood; Oven; Microwave; Dishwasher; Disposal; Refrigerator
- Bedrooms: 5 bedrooms total (1 on main level, 4 on upper level); Primary bedroom with walk-in closet
- Bathrooms: 4 full bathrooms total (3 upper, 1 main); 1 half bathroom (main); Primary bathroom with double sinks and a full shower stall
- Heating & cooling: Forced air heating (natural gas and electric); Central air conditioning
- Interior features: Attic access with pull-down stairs; Breakfast bar; Kitchen island; Eat-in kitchen; Pantry; Walk-in closet(s); Accessible doors and entrance
- Laundry & utility: Upper-level laundry room (8x8)
Neighborhood map
What this means for you Summary
Snapshot
- This is a 5-bed/4.5-bath single-family listed at $525k.
Deal economics
- At list price, monthly cash flow is $1k ($12k/yr) — positive.
- The deal already cash-flows at list — no discount required.
- Meets the 1% rule at list price ($6k rent vs $525k).
- Recommended offer: $493k (6.0% below list) — sets the bar for market timing.
- Cap rate 8.6% vs local median 3.9% in McCordsville — top-decile yield for the area; either an underpriced asset or a hidden risk that comps aren't pricing in. Stress-test before assuming the spread holds.
Location & tenants
- Location reads 69/100 on livability (#181 in IN) — a middle-class / working-renter tenant base. Strengths: employment A+, cost of living A+, housing A+; Watch: amenities F, commute F, health & safety F.
- Mt Vernon Community School Corporation (rural): math 43% / reading 48% proficiency, ranked #70 of 301 in IN (top 23%) — families likely to look elsewhere, expect single-tenant / working-renter base with shorter leases; only 18% free/reduced lunch — higher-income household profile.
- Market conditions: Rents rising fast (+5.2%/yr); 422 active listings in the ZIP; 3 comparable units currently listed for rent nearby; rentals leasing fast (median 13d on market — plan ~1-2 weeks tenant-placement turnaround); high-income renter base; 1,091 units permitted in Hancock County in 2024 (0 in 5+ unit buildings).
- At $5,735/mo this rent would consume 60% of the median local household income ($114k/yr) (locally 58% of renters already pay >50% of income on rent) — very limited rent-growth headroom before tenants either downsize or default.
Forward outlook
- Local home prices are declining (-3.0%/yr); year-one equity from $4k of loan paydown is wiped out by about $16k of value loss. Plan a longer hold.
- Hancock County population projected at +7% by 2050 — modest demand growth; plan on rents tracking national, not racing it.
- At projected returns (-3.0% appreciation + 5.2% rent growth), your $149k cash investment doubles in ~10 years — after that, you're playing with house money.
Negotiation context
- It's been on market 90 days — a 6% lower offer ($493k) is reasonable based on typical stale-listing flexibility.
- 2 sale attempts since 5y ago with the ask held roughly flat each time — persistent listings suggest the price (not the market) is what's stuck; bring a comps-based counter.
- Current owner paid $433k; 21% above their basis — modest negotiation headroom, anchor on the comps not their cost.
Questions for the listing agent
- It's been on market 90 days. Have you received any prior offers? Is the seller open to a 6% concession, seller financing, or rate buy-down credit?
- What does the HOA fee cover, when was the last increase, and are there any pending special assessments or reserve-fund shortfalls?
- Why hasn't it sold? Are there any deal-killer items the seller is aware of (foundation, flood, title, zoning, code violations)?
- Is there a deadline driving the sale (1031 exchange, divorce, estate, relocation)? That informs how much negotiation room exists.
- Schools are B-rated — typically a magnet for longer-tenancy family renters. What's the average tenant stay here, and is there a school-zone premium baked into asking?
- What's the average days-on-market for RENTAL listings here right now (not sales)? A rising rental-DOM trend means longer vacancies and softer asking-rent achievability than the comps imply.
- What's the recent tenant-quality profile in this submarket — average credit score on applications, eviction rate, late-payment / NSF rate, and stable-employment percentage? A property-management company in the area should have these aggregated.
- How much new for-sale + rental construction is in the pipeline within 1–3 miles? Heavy new supply typically softens prices + rents 12–24 months out; constrained supply supports both.
Investment metrics
- 1% rule
- 1.08% ✓
- Cap rate
- 8.56%
- Cash-on-cash
- 8.09%
- DSCR
- 1.36
- GRM
- 7.7
CMA / ARV
- ARV (on-the-fly)
- $533,122
- Comps found
- 12
Show comp detail 12 sales within ~0.75 mi
| Address | Dist | Beds/Ba | Sqft | Sold | Price | $/sf | Match |
|---|---|---|---|---|---|---|---|
| 5401 W Stream Dr | 0.08mi | 5/4.5 | 3,690 (+3%) | 0mo | $565,000 | $153 | 91 |
| 9712 N Port Dr | 0.09mi | 5/3.5 | 3,487 (-2%) | 0mo | $484,000 | $139 | 87 |
| 9800 Ridgecrest Ln | 0.22mi | 5/3.5 | 3,344 (-6%) | 4mo | $405,000 | $121 | 72 |
| 5234 Pelion Pl | 0.51mi | 5/4.5 | 3,792 (+6%) | 0mo | $572,000 | $151 | 66 |
| 9091 Drakeswood Ave | 0.59mi | 5/4.5 | 3,716 (+4%) | 1mo | $555,500 | $149 | 66 |
| 9799 Creekside Cir | 0.68mi | 5/3.5 | 3,577 (-0%) | 4mo | $521,965 | $146 | 61 |
| 9690 Highview Ln | 0.11mi | 4/2.5 (-1) | 3,092 (-14%) | 1mo | $507,500 | $164 | 58 |
| 5047 Summerton St | 0.70mi | 5/4.5 | 3,726 (+4%) | 4mo | $490,000 | $132 | 57 |
| 4813 Rosie Blvd | 0.65mi | 5/3.5 | 3,744 (+5%) | 1mo | $599,995 | $160 | 57 |
| 5181 Golden Grove Dr | 0.56mi | 5/3.5 | 3,320 (-7%) | 6mo | $485,000 | $146 | 53 |
| 4913 Waterline St | 0.58mi | 4/3.5 (-1) | 3,159 (-12%) | 1mo | $519,990 | $165 | 44 |
| 8730 Alexander Ridge Dr | 0.74mi | 5/3.5 | 3,174 (-11%) | 6mo | $445,000 | $140 | 38 |
Match score weights: distance 35% · size 25% · config 20% · recency 20%. Top-matched comps best support the ARV.
Projected returns pro-forma
-3.0% appreciation · 5.18% rent growth · sell at horizon
- IRR
- -1.6%
- Equity multiple
- 0.94×
- Total profit
- $-9,489
- Equity at exit
- $79,490
- IRR
- 10.2%
- Equity multiple
- 1.87×
- Total profit
- $129,325
- Equity at exit
- $46,095
Cash invested: $149,274 (down + closing). Projections, not guarantees.
Landlord ↔ Tenant lean methodology
- Overall (STATE)
- 90 Strongly Landlord-Friendly
- State Indiana
- 90 Strongly Landlord-Friendly · R+11
- County
- — inherits STATE
- City
- — inherits STATE
ZIP-level market 46055
- Home prices YoY
- -20.1%
- Rents YoY
- 5.2%
- Active inventory
- 422
- Price-to-rent
- 7.6×
Monthly cashflow live
- Estimated rent
- $5,735 medium interval (Pro) →
- Mortgage (P&I)
- −$2,796
- Tax from tax record
- −$444 /mo · $5,329/yr
- Insurance
- −$222
- HOA
- −$63
- Vacancy / Maint / Mgmt
- −$1,204
- Net cashflow
- $1,006
Break-even live
UW: 25.0% down · 7.5% · 30yr · 1.5% tax · 5.0% vac · 8.0% maint · 8.0% mgmt
Financing live
Cash to close
- Down payment
- $133,280
- Closing costs
- $15,994
- Reserves months
- —
- Total cash needed
- —
Loan-product check · same deal, 3 products live
Conventional
25% down · 7.5% · 30yr
- Down + closing
- —
- Monthly P&I
- —
- Monthly cashflow
- —
- DSCR
- —
- Eligible?
- —
Personal DTI + credit; lowest rate.
DSCR
20% down · 8.5% · 30yr
- Down + closing
- —
- Monthly P&I
- —
- Monthly cashflow
- —
- DSCR
- —
- Eligible?
- —
No personal income docs; deal must DSCR.
Hard money
10% down · 12.0% · 12mo
- Down + closing
- —
- Monthly P&I
- —
- Monthly cashflow
- —
- DSCR
- —
- Eligible?
- —
Short-term bridge; refi at stabilization.
Rent comps 3 comps
| Address | Beds | Baths | Sqft | Rent | $/sqft | DOM | Units | Dist |
|---|---|---|---|---|---|---|---|---|
| 8775 N Springview Dr McCordsville, IN | 4.0 | 2.5 | 3062 | $2,476 | $0.81 | 12d | 1 | 1.00mi |
| 10599 Geist View Dr Fishers, IN | 5.0 | 4.5 | 5119 | $7,500 | $1.47 | 7d | 1 | 1.35mi |
| 10599 Geist View Dr Fishers, IN | 5.0 | 4.5 | 5119 | $11,900 | $2.32 | 44d | 1 | 1.35mi |
HOA detail
- Monthly dues
- $63 · $756/yr
Listing history 19 events
-
2026-06-18days on market $524,900 Active 90 DOM
-
2026-06-17days on market $524,900 Active 89 DOM
-
2026-06-16days on market $524,900 Active 88 DOM
-
2026-06-15days on market $524,900 Active 87 DOM
-
2026-06-13days on market $524,900 Active 85 DOM
-
2026-06-13days on market $524,900 Active 84 DOM
-
2026-06-09days on market $524,900 Active 81 DOM
-
2026-06-08pricedays on market $524,900 Active 80 DOM
-
2026-06-07days on market $534,900 Active 79 DOM
-
2026-06-05days on market $534,900 Active 76 DOM
-
2026-06-03days on market $534,900 Active 75 DOM
-
2026-06-02days on market $534,900 Active 74 DOM
-
2026-06-01days on market $534,900 Active 73 DOM
-
2026-05-31days on market $534,900 Active 72 DOM
-
2026-05-18price $534,900
-
2026-04-05price $539,900
-
2026-03-19$550,000 Active
-
2021-09-13soldstatus $432,585 40-char remark
Show marketing remark (40 chars)
Listed and Sold! For comp purposes only.
-
2021-09-11$432,585 40-char remark
Show marketing remark (40 chars)
Listed and Sold! For comp purposes only.
ⓘ Source: listings_history table (triggers on properties + properties_extension) + one-shot
backfill from property_details.listing_events for pre-trigger history.
Tax reassessment forecast IN · Partial reset (capped growth)
- Current annual tax
- $5,329 · $444/mo
- Projected year-2 tax
- $5,329 · $444/mo
- Expected delta
- $0/yr ($0/mo · 0.0%)
ⓘ Screening estimate from a state-policy table — verify with the county assessor before closing.
Climate risk First Street
- Flood 1/10 Low FEMA zone X (unshaded) · 0% chance over 30 yrs
- Wildfire 1/10 Low
- Heat 3/10 Moderate 7 d/yr ≥100°F today · 18 d/yr by 30 yrs out
- Wind 2/10 Low 100% chance of damaging wind over 30 yrs
- Air quality 2/10 Low 1 unhealthy d/yr today · 2 by 30 yrs out
Nearby sold comps map
Loading sold comps map…
Walkable amenities ~0.75 mi
Loading nearby amenities…
Taxation est. · year 1
- Rental income
- $68,821
- − Mortgage interest
- −$29,863
- − Property taxes
- −$5,329
- − Insurance
- −$2,666
- − Repairs & maintenance
- −$5,506
- − Management
- −$5,506
- − HOA
- −$756
- − Depreciation
- −$15,509
- Taxable income
- $3,687
- Est. tax owed @ 24.0%
- −$885
- After-tax cash flow
- $11,184/yr
For passive investors: Depreciation is non-cash, so a rental often shows a tax loss while cash-flowing — sheltering income. Rental losses are passive: they offset passive income freely, and up to $25,000/yr can offset ordinary (W-2) income if you actively participate and your MAGI is under $100k (phasing out to $0 by $150k); unused losses carry forward. On sale, claimed depreciation is recaptured at up to 25%, and gains may owe capital-gains tax (a 1031 exchange can defer both). Figures are a year-1 estimate at your 24.0% rate — not tax advice; consult a CPA.
Schools (NCES district)
- District
- Mt Vernon Community School Corporation
- NCES district ID
- 1807260
- Math proficiency
- 43% ▼ -12.00%
- Reading proficiency
- 48% ▼ -7.00%
- Median HH income
- $73,671
- Composite
- 41.3/100
- National rank
- #3514
- State rank
- #70 of 301 in IN
Livability — McCordsville
- Score
- 69/100
- State rank
- #181
- US rank
- #8388
Category grades
Schools grade is shown separately in the Schools card above.
Census & demographics
- Census place
- McCordsville, IN
- County
- Hancock County · 59,521 people
- City population
- 16,010
- Metro
- Indianapolis-Carmel-Anderson, IN
- Population (ZIP)
- 16,010
- Household income
- $113,784
- Rent vs Own
- Severe rent burden
- 58.0
Population outlook (Hancock County) Hauer SSP2
- Today (2025)
- 77,820 people
- By 2030
- 79,914 · +2.7%
- By 2040
- 82,734 · +6.3%
- By 2050
- 83,348 · +7.1%
- By 2075
- 82,439 · +5.9%
- By 2100
- 74,181 · -4.7%
Race, ethnicity, and origin ACS 2023
- Neighborhood character
- Predominantly White (77%)
- Race & ethnicity
- White 77% Black 13% Two or more races 6% Hispanic / Latino 4% Asian 1%
- Common ancestry
- Lithuanian 3% Italian 3% Romanian 3%
- Foreign-born
- 4% · Canada, Vietnam, Jamaica
- Languages at home
- 94% English-only · Spanish 4%
Political lean MEDSL · Hancock
- 2024 margin
- Solid R (+33.7) · D 32.2% · R 65.9% · Other 1.9%
- 2008→2024 swing
- -4.1pp toward R · 2008: -29.6pp · 2024: -33.7pp
- All cycles
- 2024: R+33.7 2020: R+37.5 2016: R+44.8 2012: R+41.0 2008: R+29.6
Not yet ingested
- Civics
- —
Market trends
- HPI YoY
- ▼ -52.35%
- Current HPI
- 207.9764
- Rent YoY
- ▲ 5.18%
- Metro
- Indianapolis-Carmel-Anderson, IN
- State GDP YoY
- ▲ 2.90%
- F500 in state
- 18
Industry mix (Fortune 500 HQ in IN)
| Industry | F500 HQs | Revenue |
|---|---|---|
| Industrial Machinery | 2 | $37B |
|
||
| Healthcare | 1 | $177B |
|
||
| Pharmaceuticals | 1 | $45B |
|
||
| Metals / Steel | 1 | $18B |
|
||
| Agriculture | 1 | $17B |
|
||
| Packaging | 1 | $12B |
|
||
Price history
+23.7% since first listed5 events — show timeline
- 2026-05-18 Price Changed $534,900 MIBOR as Distributed by MLS Grid
- 2026-04-05 Price Changed $539,900 MIBOR as Distributed by MLS Grid
- 2026-03-19 Listed $550,000 MIBOR as Distributed by MLS Grid
- 2021-09-13 Sold (MLS) $432,585 MIBOR as Distributed by MLS Grid
- 2021-09-11 Listed $432,585 MIBOR as Distributed by MLS Grid
Property tax history
+322.8%/yrLatest (2025): $5,329 · -5.1% YoY. Source: county tax records.
Cash-flow waterfall
monthlySold comps — $/sqft
last 12 mo · ≤1 miLoading sold comps…