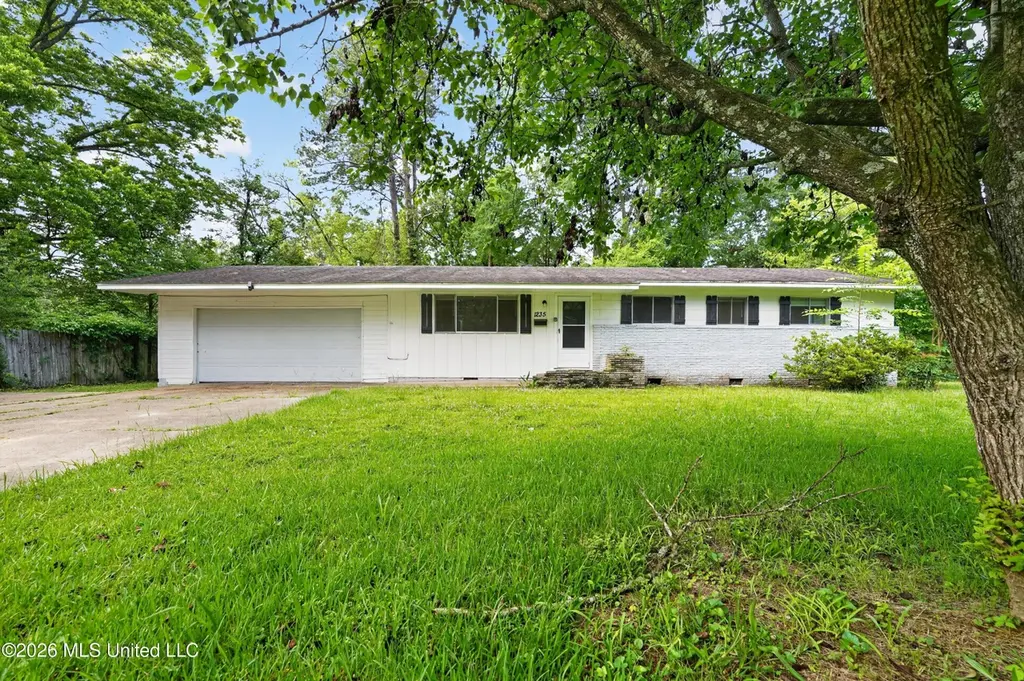
1235 Adkins Blvd · Jackson, MS
Flood risk 1/10 · Minimal
- FEMA flood zone
- X (unshaded)
- Chance of flooding over 30 yrs
- 0.0%
- Est. flood insurance / yr
- $507 – $1,088
Fire risk 1/10 · Minimal
- Est. fire insurance / yr
- $1,241 – $2,305
Heat risk 7/10 · Major
- Hot days now (above 108°F)
- 7 days/yr
- Hot days in 30 yrs
- 20 days/yr
Wind risk 8/10 · Major
- Chance of severe wind over 30 yrs
- 80.0%
Air-quality risk 2/10 · Minimal
- Unhealthy air days now
- 0 days/yr
- Unhealthy air days in 30 yrs
- 1 days/yr
Risk factors via First Street. Map © Google.
Why this score? — see what drove the C- grade
The composite is a weighted blend of 9 inputs, each scored 0–100. Each bar is that input's sub-score; the figure is the points it added to the 100-point composite (weight × sub-score).
- Cash flow +25.1/30.0
- DSCR +8.2/10.0
- 1% rule +6.7/10.0
- Rent growth +4.5/5.0
- Livability +3.4/5.0
- Condition / age +2.5/5.0
- Schools +1.1/10.0
- ARV discount +0.0/15.0
- Appreciation +0.0/10.0
$134,900
🖨 Deal sheet 📄 Offer letter ✓ Due diligence
Listing remarks MLS
This is an amazing opportunity to own this Ranch home that features 3 bedrooms, 2 full baths. With tons of character this home is situated on a nice size lot with easy access to main road and local amenities. Needs works. Bring your tool kits and design ideas to restore and upgrade to your taste. Great opportunity for homeowner looking to customize and add to investment portfolio. Property being sold ''AS IS''. More photos will be added soon.
Key facts
- Off street parking
- Mature surroundings
- Flat lot
Tags
Property features AI
Finance
- Other: Lot approximately 0.44 acre
- Financial info: Property zoned for single-family residential
Exterior
- Parking: Attached garage (1 car); Driveway with concrete surface
- Utilities: Public water; Sewer available; Electricity available; Water available; Sewer listed as unknown in specific field
- Home design: Single-family residence (house); One story
- Construction: Brick and siding exterior; Asphalt roof; Slab foundation; Built according to public records
- Exterior features: Back yard fencing; Other exterior features; Level lot
Interior
- Kitchen: Kitchen on main level; Includes other appliances
- Bedrooms: Primary bedroom on main level; Additional bedroom on main level
- Flooring: Hardwood
- Bathrooms: Two full bathrooms
- Heating & cooling: Central heating; Central air conditioning
- Interior features: Move-in ready; Five total rooms; Hardwood floors; Other built-in appliances
- Laundry & utility: Laundry room on main level; Laundry features: other
Neighborhood map
What this means for you Summary
Snapshot
- This is a 3-bed/2.0-bath single-family listed at $135k.
Deal economics
- At list price, monthly cash flow is $298 ($4k/yr) — positive.
- The deal already cash-flows at list — no discount required.
- Meets the 1% rule at list price ($2k rent vs $135k).
- Recommended offer: $133k (1.5% below list) — sets the bar for market timing.
Location & tenants
- Location reads 68/100 on livability (#66 in MS) — a middle-class / working-renter tenant base. Strengths: commute A+, cost of living A+, housing A+; Watch: amenities F, employment F, health & safety F.
- Jackson Public School District (urban): math 9% / reading 18% proficiency, ranked #112 of 130 in MS (top 86%) — low school quality limits family demand, transient renter base, plan for 1-2y turnover; 88% free/reduced lunch — lower-income household profile, screen leases tightly.
- Zoned schools: Casey Elementary School (math 17% / reading 42%, grade F, #188 of 375 statewide, top 51%, 279 students, 100% FRL); Murrah High School (math 12% / reading 27%, grade F, #130 of 197 statewide, top 68%, 1,326 students, 100% FRL).
- Market conditions: Rents rising fast (+7.9%/yr); 221 active listings in the ZIP; 15 comparable units currently listed for rent nearby; rentals at typical pace (median 24d on market — plan ~3-4 weeks tenant-placement turnaround); 40% of comp listings sitting > 30 days — soft ceiling on asking rent; 167 units permitted in Hinds County in 2024 (0 in 5+ unit buildings).
Forward outlook
- Local home prices are declining (-3.0%/yr); year-one equity from $933 of loan paydown is wiped out by about $4k of value loss. Plan a longer hold.
- Hinds County population projected to shrink 6% by 2050 — rents likely to lag national; underwrite the cash flow, not the appreciation.
- At projected returns (-3.0% appreciation + 7.9% rent growth), your $38k cash investment doubles in ~8 years — after that, you're playing with house money.
Negotiation context
- It's been on market 20 days — a 2% lower offer ($133k) is reasonable based on typical stale-listing flexibility.
- 4 sale attempts since 21y ago with the ask held roughly flat each time — persistent listings suggest the price (not the market) is what's stuck; bring a comps-based counter.
Risks & watch-outs
- Climate carrying-cost: severe wind risk, 80% chance of damaging wind over 30y; extreme-heat days projected 7→20/yr by 2055 (HVAC capex compounding) — expect insurance premiums to compound above CPI over the hold.
Questions for the listing agent
- Built in 1960 — when were the roof, HVAC, electrical panel, plumbing, and water heater last replaced?
- Is there a deadline driving the sale (1031 exchange, divorce, estate, relocation)? That informs how much negotiation room exists.
- Schools are F-rated, which usually means shorter tenancies and higher turnover. Who's the typical renter profile here, and what's been the actual vacancy rate?
- What's the average days-on-market for RENTAL listings here right now (not sales)? A rising rental-DOM trend means longer vacancies and softer asking-rent achievability than the comps imply.
- What's the recent tenant-quality profile in this submarket — average credit score on applications, eviction rate, late-payment / NSF rate, and stable-employment percentage? A property-management company in the area should have these aggregated.
- How much new for-sale + rental construction is in the pipeline within 1–3 miles? Heavy new supply typically softens prices + rents 12–24 months out; constrained supply supports both.
Investment metrics
- 1% rule
- 1.17% ✓
- Cap rate
- 8.95%
- Cash-on-cash
- 9.48%
- DSCR
- 1.42
- GRM
- 7.1
CMA / ARV
- ARV (on-the-fly)
- $108,576
- Comps found
- 7
Show comp detail 7 sales within ~0.75 mi
| Address | Dist | Beds/Ba | Sqft | Sold | Price | $/sf | Match |
|---|---|---|---|---|---|---|---|
| 1237 Springdale Dr | 0.09mi | 3/2.0 | 1,408 (+13%) | 2mo | $103,500 | $74 | 73 |
| 1249 Springdale Dr | 0.08mi | 3/2.0 | 1,353 (+8%) | 15mo | $159,900 | $118 | 70 |
| 1510 Springridge Dr | 0.40mi | 3/2.0 | 1,347 (+8%) | 5mo | $106,000 | $79 | 64 |
| 316 Colonial Cir | 0.20mi | 3/1.0 | 1,407 (+13%) | 4mo | $165,000 | $117 | 62 |
| 1348 Winterview Dr | 0.29mi | 3/2.0 | 1,410 (+13%) | 12mo | $175,000 | $124 | 55 |
| 811 Fairfax Cir | 0.38mi | 3/2.0 | 1,421 (+14%) | 8mo | $115,000 | $81 | 52 |
| 214 Colonial Cir | 0.51mi | 3/2.0 | 1,375 (+10%) | 22mo | $120,000 | $87 | 41 |
Match score weights: distance 35% · size 25% · config 20% · recency 20%. Top-matched comps best support the ARV.
Projected returns pro-forma
-3.0% appreciation · 7.9% rent growth · sell at horizon
- IRR
- 3.5%
- Equity multiple
- 1.14×
- Total profit
- $5,329
- Equity at exit
- $20,114
- IRR
- 17.2%
- Equity multiple
- 2.75×
- Total profit
- $66,263
- Equity at exit
- $11,664
Cash invested: $37,772 (down + closing). Projections, not guarantees.
Landlord ↔ Tenant lean methodology
- Overall (STATE)
- 90 Strongly Landlord-Friendly
- State Mississippi
- 90 Strongly Landlord-Friendly · R+11
- County
- — inherits STATE
- City
- — inherits STATE
ZIP-level market 39211
- Rents YoY
- 7.9%
- Active inventory
- 221
- Price-to-rent
- 7.1×
Monthly cashflow live
- Estimated rent
- $1,575 high interval (Pro) →
- Mortgage (P&I)
- −$707
- Tax from tax record
- −$183 /mo · $2,190/yr
- Insurance
- −$56
- HOA
- −$0
- Vacancy / Maint / Mgmt
- −$331
- Net cashflow
- $298
Break-even live
UW: 25.0% down · 7.5% · 30yr · 1.5% tax · 5.0% vac · 8.0% maint · 8.0% mgmt
Financing live
Cash to close
- Down payment
- $33,725
- Closing costs
- $4,047
- Reserves months
- —
- Total cash needed
- —
Loan-product check · same deal, 3 products live
Conventional
25% down · 7.5% · 30yr
- Down + closing
- —
- Monthly P&I
- —
- Monthly cashflow
- —
- DSCR
- —
- Eligible?
- —
Personal DTI + credit; lowest rate.
DSCR
20% down · 8.5% · 30yr
- Down + closing
- —
- Monthly P&I
- —
- Monthly cashflow
- —
- DSCR
- —
- Eligible?
- —
No personal income docs; deal must DSCR.
Hard money
10% down · 12.0% · 12mo
- Down + closing
- —
- Monthly P&I
- —
- Monthly cashflow
- —
- DSCR
- —
- Eligible?
- —
Short-term bridge; refi at stabilization.
Rent comps 15 comps
| Address | Beds | Baths | Sqft | Rent | $/sqft | DOM | Units | Dist |
|---|---|---|---|---|---|---|---|---|
| 5845 Ridgewood Rd Jackson, MS | 2.0 | 1.0 | 850 | $899 | $1.06 | 43d | 1 | 0.60mi |
| 120 Parkway Dr Jackson, MS | 1.0–3.0 | 1.0–2.0 | 1076 | $2,255 | $2.10 | 13d | 15 | 0.65mi |
| 3001 Jamestown Way Jackson, MS | 2.0 | 1.5 | 1200 | $1,100 | $0.92 | 23d | 1 | 0.82mi |
| 1702 Jamestown Way Unit 1702 Jackson, MS | 3.0 | 2.0 | 1465 | $1,495 | $1.02 | 43d | 1 | 0.83mi |
| 119 S Canton Club Cir Jackson, MS | 3.0 | 2.0 | 1444 | $1,595 | $1.10 | 23d | 1 | 0.89mi |
| 5301 Ridgewood Rd Jackson, MS | 3.0 | 2.0 | 1482 | $1,850 | $1.25 | 43d | 1 | 1.01mi |
| 492 E Beasley Rd Jackson, MS | 1.0–3.0 | 1.0–2.0 | 1133 | $1,440 | $1.27 | 13d | 8 | 1.08mi |
| 1523 E County Line Rd Jackson, MS | 2.0 | 2.0 | 989 | $1,235 | $1.25 | 43d | 1 | 1.08mi |
| 5155 Wayneland Dr Jackson, MS | 1.0–2.0 | 1.0–2.0 | 905 | $1,500 | $1.66 | 23d | 1 | 1.22mi |
| 601 Northpointe Pkwy Jackson, MS | 1.0–2.0 | 1.0–2.0 | 910 | $1,054 | $1.16 | 13d | 2 | 1.27mi |
| 5000 Ridgewood Rd Jackson, MS | 2.0 | 2.0 | 1093 | $1,279 | $1.17 | 44d | 1 | 1.32mi |
| 1620 E County Line Rd Ridgeland, MS | 1.0–3.0 | 1.0–2.5 | 1126 | $1,595 | $1.42 | 13d | 7 | 1.38mi |
| 51 Northtown Dr Unit 003D Jackson, MS | 2.0 | 2.0 | 1025 | $1,199 | $1.17 | 43d | 1 | 1.46mi |
| 51 Northtown Dr Unit 001G Jackson, MS | 3.0 | 2.0 | 1260 | $1,449 | $1.15 | 13d | 1 | 1.46mi |
| 50 Northtown Dr Jackson, MS | 1.0–2.0 | 1.0–2.0 | 871 | $1,200 | $1.38 | 13d | 15 | 1.48mi |
Listing history 17 events
-
2026-06-18days on market $134,900 Active 20 DOM
-
2026-06-17days on market $134,900 Active 19 DOM
-
2026-06-16days on market $134,900 Active 18 DOM
-
2026-06-15days on market $134,900 Active 17 DOM
-
2026-06-14days on market $134,900 Active 15 DOM
-
2026-06-13days on market $134,900 Active 14 DOM
-
2026-06-10days on market $134,900 Active 12 DOM
-
2026-06-09days on market $134,900 Active 11 DOM
-
2026-06-08days on market $134,900 Active 10 DOM
-
2026-06-07days on market $134,900 Active 9 DOM
-
2026-06-05days on market $134,900 Active 6 DOM
-
2026-06-03days on market $134,900 Active 5 DOM
-
2026-06-02days on market $134,900 Active 4 DOM
-
2026-06-01days on market $134,900 Active 3 DOM
-
2026-05-31days on market $134,900 Active 2 DOM
-
2026-05-30remarks 699-char remark
-
2026-05-30$134,900 Active 1 DOM
ⓘ Source: listings_history table (triggers on properties + properties_extension) + one-shot
backfill from property_details.listing_events for pre-trigger history.
Tax reassessment forecast MS · Resets to sale price
- Current annual tax
- $2,190 · $183/mo
- Projected year-2 tax
- $2,190 · $183/mo
- Expected delta
- $0/yr ($0/mo · 0.0%)
ⓘ Screening estimate from a state-policy table — verify with the county assessor before closing.
Climate risk First Street
- Flood 1/10 Low FEMA zone X (unshaded) · 0% chance over 30 yrs
- Wildfire 1/10 Low
- Heat 7/10 Severe 7 d/yr ≥108°F today · 20 d/yr by 30 yrs out
- Wind 8/10 Severe 80% chance of damaging wind over 30 yrs
- Air quality 2/10 Low 0 unhealthy d/yr today · 1 by 30 yrs out
Nearby sold comps map
Loading sold comps map…
Walkable amenities ~0.75 mi
Loading nearby amenities…
Taxation est. · year 1
- Rental income
- $18,904
- − Mortgage interest
- −$7,556
- − Property taxes
- −$2,190
- − Insurance
- −$674
- − Repairs & maintenance
- −$1,512
- − Management
- −$1,512
- − Depreciation
- −$3,924
- Taxable income
- $1,534
- Est. tax owed @ 24.0%
- −$368
- After-tax cash flow
- $3,213/yr
For passive investors: Depreciation is non-cash, so a rental often shows a tax loss while cash-flowing — sheltering income. Rental losses are passive: they offset passive income freely, and up to $25,000/yr can offset ordinary (W-2) income if you actively participate and your MAGI is under $100k (phasing out to $0 by $150k); unused losses carry forward. On sale, claimed depreciation is recaptured at up to 25%, and gains may owe capital-gains tax (a 1031 exchange can defer both). Figures are a year-1 estimate at your 24.0% rate — not tax advice; consult a CPA.
Schools (NCES district)
- District
- Jackson Public School District
- NCES district ID
- 2802190
- Math proficiency
- 9% ▼ -14.00%
- Reading proficiency
- 18% ▼ -7.00%
- Median HH income
- $33,234
- Composite
- 10.89/100
- National rank
- #9755
- State rank
- #112 of 130 in MS
Livability — Jackson
- Score
- 68/100
- State rank
- #66
- US rank
- #9695
Category grades
Schools grade is shown separately in the Schools card above.
Census & demographics
- Census place
- Jackson, MS
- County
- Hinds County · 167,040 people
- City population
- 140,204
- Metro
- Jackson, MS
- Population (ZIP)
- 23,838
- Household income
- $69,426
- Rent vs Own
- Severe rent burden
- 736.0
Population outlook (Hinds County) Hauer SSP2
- Today (2025)
- 242,528 people
- By 2030
- 241,113 · -0.6%
- By 2040
- 235,557 · -2.9%
- By 2050
- 226,946 · -6.4%
- By 2075
- 199,995 · -17.5%
- By 2100
- 164,165 · -32.3%
Race, ethnicity, and origin ACS 2023
- Neighborhood character
- Majority Black (59%)
- Race & ethnicity
- Black 59% White 36% Hispanic / Latino 3% Two or more races 2%
- Common ancestry
- Serbian 2% Italian 2% Slovak 1%
- Foreign-born
- 2% · Canada, China
- Languages at home
- 96% English-only · Spanish 3% Chinese 1%
Political lean MEDSL · Hinds
- 2024 margin
- Solid D (+46.1) · D 72.4% · R 26.3% · Other 1.4%
- 2008→2024 swing
- +7.1pp toward D · 2008: 39.0pp · 2024: 46.1pp
- All cycles
- 2024: D+46.1 2020: D+48.3 2016: D+43.7 2012: D+45.1 2008: D+39.0
Not yet ingested
- Civics
- —
Market trends
- HPI YoY
- ▼ -135.99%
- Current HPI
- 145.5192
- Rent YoY
- ▲ 7.90%
- Metro
- Jackson, MS
- State GDP YoY
- —
- F500 in state
- 0
Price history
+55.1% since first listed13 events — show timeline
- 2026-05-29 Listed $134,900 MLSU
- 2022-05-31 Sold (MLS) — MLSU
- 2022-05-23 Pending — MLSU
- 2022-05-04 Listed $110,000 MLSU
- 2019-12-03 Sold (Public Records) — Public Records
- 2018-11-05 Sold (Public Records) — Public Records
- 2018-05-25 Sold (MLS) — MLSU
- 2017-11-07 Listed $70,000 MLSU
- 2005-09-12 Listing Removed — MLSU
- 2005-07-15 Listed $87,000 MLSU
- 2001-05-31 Sold (Public Records) — Public Records
- 1999-03-05 Sold (Public Records) — Public Records
- 1971-02-23 Sold (Public Records) — Public Records
Property tax history
+1.5%/yrLatest (2025): $2,190 · +1.7% YoY. Source: county tax records.
Cash-flow waterfall
monthlySold comps — $/sqft
last 12 mo · ≤1 miLoading sold comps…