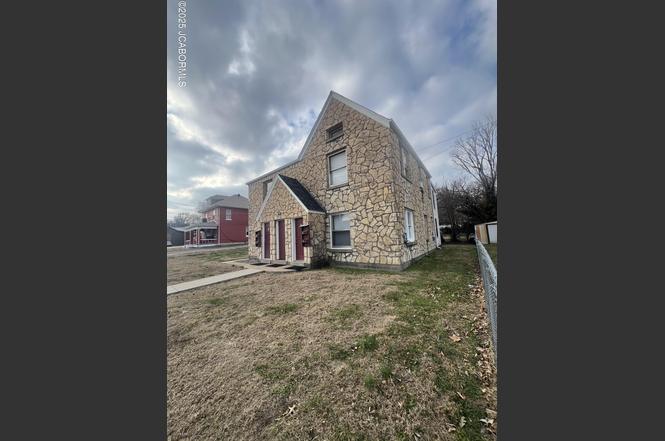
 Fourplex
606 Washington St · Jefferson City, MO
Flood risk 1/10 · Minimal
- FEMA flood zone
- X (unshaded)
- Chance of flooding over 30 yrs
- 0.0%
- Est. flood insurance / yr
- $507 – $1,088
Fire risk 1/10 · Minimal
- Est. fire insurance / yr
- $1,054 – $1,958
Heat risk 5/10 · Moderate
- Hot days now (above 106°F)
- 7 days/yr
- Hot days in 30 yrs
- 19 days/yr
Wind risk 2/10 · Minimal
- Chance of severe wind over 30 yrs
- —
Air-quality risk 2/10 · Minimal
- Unhealthy air days now
- 0 days/yr
- Unhealthy air days in 30 yrs
- 1 days/yr
Risk factors via First Street. Map © Google.
Why this score? — see what drove the B grade
The composite is a weighted blend of 9 inputs, each scored 0–100. Each bar is that input's sub-score; the figure is the points it added to the 100-point composite (weight × sub-score).
- Cash flow +30.0/30.0
- 1% rule +10.0/10.0
- DSCR +10.0/10.0
- ARV discount +7.5/15.0
- Livability +4.2/5.0
- Schools +3.5/10.0
- Rent growth +2.5/5.0
- Condition / age +2.5/5.0
- Appreciation +0.0/10.0
$278,500
🖨 Deal sheet 📄 Offer letter ✓ Due diligence
Multi-family units
County records classify this as Multi-Family (2-4 Unit). Listing-text estimate: 4 units. confirmed
Listing remarks
Add this income-producing 4-plex to your investment portfolio. The property generates $2,925 in monthly rental income. Recently updated units are move in ready. All apartments could be utilized as one or two-bedroom units, offering added rental flexibility. Located in a desirable downtown area with excellent walkability and close proximity to shopping, dining, and local amenities, this property presents a strong opportunity to enhance your investment portfolio.
Key facts
- 3,920 sq ft lot
- 2 garage spots
- Built 1930
Property features AI
Finance
- Other: Approximately 2,830 total building area
- Financial info: Property operates as multi-unit residential income with multiple 1-bedroom rental units and listed rents for units
Exterior
- Parking: 2-car garage; Off-street parking and on-street parking available
- Security: No security features specified
- Utilities: Public water; Public sewer
- Home design: Residential income property
- Construction: Constructed with stone and vinyl siding
- Exterior features: Stone and vinyl siding exterior; C-2 zoning
Interior
- Kitchen: No kitchen appliance details provided
- Bedrooms: Multiple 1-bedroom units (each unit is 1 bedroom)
- Flooring: No flooring details provided
- Bathrooms: Four full bathrooms (total for property)
- Heating & cooling: Forced air heating (natural gas); Window air conditioning units
- Interior features: Updated/remodeled units; Basement with walk-up access; No fireplaces
- Laundry & utility: No laundry features specified
Neighborhood map
What this means for you Summary
Snapshot
- This is a 4 × 4-bed/4.0-bath units multifamily listed at $278k.
Deal economics
- At list price, monthly cash flow is $2k ($26k/yr) — positive. Per door: $541/mo.
- The deal already cash-flows at list — no discount required.
- Meets the 1% rule at list price ($5k rent vs $278k).
- Recommended offer: $245k (12.0% below list) — sets the bar for market timing.
- Cap rate 15.6% vs local median 3.7% in Jefferson City — top-decile yield for the area; either an underpriced asset or a hidden risk that comps aren't pricing in. Stress-test before assuming the spread holds.
Location & tenants
- Location reads 83/100 on livability (#7 in MO, #838 nationally) — a professional / high-income tenant draw. Strengths: cost of living A+, housing A+, health & safety A+; Watch: crime C-.
- Jefferson City (urban): math 34% / reading 48% proficiency, ranked #121 of 324 in MO (top 37%) — families likely to look elsewhere, expect single-tenant / working-renter base with shorter leases.
- Market conditions: 189 active listings in the ZIP; 173 units permitted in Cole County in 2024 (0 in 5+ unit buildings).
Forward outlook
- Local home prices are declining (-3.0%/yr); year-one equity from $2k of loan paydown is wiped out by about $8k of value loss. Plan a longer hold.
- Cole County population projected to shrink 5% by 2050 — rents likely to lag national; underwrite the cash flow, not the appreciation.
- At projected returns (-3.0% appreciation + 3.0% rent growth), your $78k cash investment doubles in ~4 years — after that, you're playing with house money.
Negotiation context
- It's been on market 170 days — a 12% lower offer ($245k) is reasonable based on typical stale-listing flexibility.
- 5 sale attempts since 13y ago; this cycle's ask has dropped $16k (6%) from the opening price — seller is motivated, your offer sets the floor, not the list.
Risks & watch-outs
- Watch-outs: built in 1930 — expect roof / HVAC / electrical / plumbing capex.
- Climate carrying-cost: extreme-heat days projected 7→19/yr by 2055 (HVAC capex compounding) — expect insurance premiums to compound above CPI over the hold.
Questions for the listing agent
- It's been on market 170 days. Have you received any prior offers? Is the seller open to a 12% concession, seller financing, or rate buy-down credit?
- Can we see the unit-by-unit rent roll, current vacancy, and any below-market leases? What's the average tenancy length?
- What capital expenditures (roof, boiler, parking lot, exteriors) have been made in the last 5 years, and what's planned in the next 2?
- Built in 1930 — when were the roof, HVAC, electrical panel, plumbing, and water heater last replaced?
- Why hasn't it sold? Are there any deal-killer items the seller is aware of (foundation, flood, title, zoning, code violations)?
- Is there a deadline driving the sale (1031 exchange, divorce, estate, relocation)? That informs how much negotiation room exists.
- Schools are B-rated — typically a magnet for longer-tenancy family renters. What's the average tenant stay here, and is there a school-zone premium baked into asking?
- What's the average days-on-market for RENTAL listings here right now (not sales)? A rising rental-DOM trend means longer vacancies and softer asking-rent achievability than the comps imply.
- What's the recent tenant-quality profile in this submarket — average credit score on applications, eviction rate, late-payment / NSF rate, and stable-employment percentage? A property-management company in the area should have these aggregated.
- How much new apartment / multifamily construction is in the pipeline within 1–3 miles? Heavy new supply (>2% of stock underway) typically softens rents 12–24 months out; light construction supports rent growth.
Investment metrics
- 1% rule
- 1.74% ✓
- Cap rate
- 15.62%
- Cash-on-cash
- 33.31%
- DSCR
- 2.48
- GRM
- 4.8
CMA / ARV
No comps found within radius.
Projected returns pro-forma
-3.0% appreciation · 3.0% rent growth · sell at horizon
- IRR
- 28.5%
- Equity multiple
- 2.19×
- Total profit
- $92,647
- Equity at exit
- $41,525
- IRR
- 35.9%
- Equity multiple
- 4.31×
- Total profit
- $257,850
- Equity at exit
- $24,080
Cash invested: $77,980 (down + closing). Projections, not guarantees.
Landlord ↔ Tenant lean methodology
- Overall (STATE)
- 81 Strongly Landlord-Friendly
- State Missouri
- 81 Strongly Landlord-Friendly · R+10
- County
- — inherits STATE
- City
- — inherits STATE
ZIP-level market 65101
- Home prices YoY
- -29.1%
- Active inventory
- 189
- Price-to-rent
- 19.1×
Monthly cashflow live
- Estimated rent
- $4,852 medium interval (Pro) →
- Mortgage (P&I)
- −$1,460
- Tax from tax record
- −$92 /mo · $1,104/yr
- Insurance
- −$116
- HOA
- −$0
- Vacancy / Maint / Mgmt
- −$1,019
- Net cashflow
- $2,165
Break-even live
4-unit breakdown (identical units grouped — click to expand)
| Units | Beds | Baths | Est. rent |
|---|---|---|---|
| 4× units | 4 | 4 | $4,852 |
| #1 | 4 | 4 | $1,213 |
| #2 | 4 | 4 | $1,213 |
| #3 | 4 | 4 | $1,213 |
| #4 | 4 | 4 | $1,213 |
| Total (4 units) | $4,852 | ||
UW: 25.0% down · 7.5% · 30yr · 1.5% tax · 5.0% vac · 8.0% maint · 8.0% mgmt
Financing live
Cash to close
- Down payment
- $69,625
- Closing costs
- $8,355
- Reserves months
- —
- Total cash needed
- —
Loan-product check · same deal, 3 products live
Conventional
25% down · 7.5% · 30yr
- Down + closing
- —
- Monthly P&I
- —
- Monthly cashflow
- —
- DSCR
- —
- Eligible?
- —
Personal DTI + credit; lowest rate.
DSCR
20% down · 8.5% · 30yr
- Down + closing
- —
- Monthly P&I
- —
- Monthly cashflow
- —
- DSCR
- —
- Eligible?
- —
No personal income docs; deal must DSCR.
Hard money
10% down · 12.0% · 12mo
- Down + closing
- —
- Monthly P&I
- —
- Monthly cashflow
- —
- DSCR
- —
- Eligible?
- —
Short-term bridge; refi at stabilization.
Listing history 35 events
-
2026-06-19days on market $278,500 Active 170 DOM
-
2026-06-18days on market $278,500 Active 169 DOM
-
2026-06-17days on market $278,500 Active 168 DOM
-
2026-06-16days on market $278,500 Active 167 DOM
-
2026-06-15days on market $278,500 Active 166 DOM
-
2026-06-14days on market $278,500 Active 164 DOM
-
2026-06-13days on market $278,500 Active 163 DOM
-
2026-06-10days on market $278,500 Active 161 DOM
-
2026-06-09days on market $278,500 Active 160 DOM
-
2026-06-08days on market $278,500 Active 159 DOM
-
2026-06-07days on market $278,500 Active 158 DOM
-
2026-06-05days on market $278,500 Active 155 DOM
-
2026-06-03days on market $278,500 Active 154 DOM
-
2026-06-02days on market $278,500 Active 153 DOM
-
2026-06-01days on market $278,500 Active 152 DOM
-
2026-05-31days on market $278,500 Active 151 DOM
-
2026-05-30days on market $278,500 Active 150 DOM
-
2026-04-29price $278,500
-
2026-01-22price $285,000
-
2025-12-29$295,000 Active
-
2024-07-19soldstatus Closed
-
2024-07-19soldstatus
-
2024-06-25historical
-
2024-06-22$260,000
-
2023-04-26price $229,900
-
2023-03-09price $234,900
-
2022-02-16price $595
-
2021-12-07soldstatus
-
2021-12-07soldstatus
-
2021-12-07soldstatus
-
2021-11-03$164,900
-
2015-12-08soldstatus
-
2015-09-07$69,900
-
2014-01-24soldstatus
-
2013-03-01$95,000
ⓘ Source: listings_history table (triggers on properties + properties_extension) + one-shot
backfill from property_details.listing_events for pre-trigger history.
Tax reassessment forecast MO · Resets to sale price
- Current annual tax
- $1,104 · $92/mo
- Projected year-2 tax
- $2,701 · $225/mo
- Expected delta
- +$1,597/yr (+$133/mo · 144.6%)
ⓘ Screening estimate from a state-policy table — verify with the county assessor before closing.
Climate risk First Street
- Flood 1/10 Low FEMA zone X (unshaded) · 0% chance over 30 yrs
- Wildfire 1/10 Low
- Heat 5/10 Major 7 d/yr ≥106°F today · 19 d/yr by 30 yrs out
- Wind 2/10 Low
- Air quality 2/10 Low 0 unhealthy d/yr today · 1 by 30 yrs out
Nearby sold comps map
Loading sold comps map…
Walkable amenities ~0.75 mi
Loading nearby amenities…
Taxation est. · year 1
- Rental income
- $58,224
- − Mortgage interest
- −$15,600
- − Property taxes
- −$1,104
- − Insurance
- −$1,392
- − Repairs & maintenance
- −$4,658
- − Management
- −$4,658
- − Depreciation
- −$8,102
- Taxable income
- $22,709
- Est. tax owed @ 24.0%
- −$5,450
- After-tax cash flow
- $20,524/yr
For passive investors: Depreciation is non-cash, so a rental often shows a tax loss while cash-flowing — sheltering income. Rental losses are passive: they offset passive income freely, and up to $25,000/yr can offset ordinary (W-2) income if you actively participate and your MAGI is under $100k (phasing out to $0 by $150k); unused losses carry forward. On sale, claimed depreciation is recaptured at up to 25%, and gains may owe capital-gains tax (a 1031 exchange can defer both). Figures are a year-1 estimate at your 24.0% rate — not tax advice; consult a CPA.
Schools (NCES district)
- District
- Jefferson City
- NCES district ID
- 2916190
- Math proficiency
- 34% ▼ -1.00%
- Reading proficiency
- 48% ▲ 5.00%
- Median HH income
- $51,903
- Composite
- 35.45/100
- National rank
- #4930
- State rank
- #121 of 324 in MO
Livability — Jefferson City
- Score
- 83/100
- State rank
- #7
- US rank
- #838
Category grades
Schools grade is shown separately in the Schools card above.
Census & demographics
- Census place
- Jefferson City, MO
- City population
- 41,145
- Population (ZIP)
- 29,777
Population outlook (Cole County) Hauer SSP2
- Today (2025)
- 78,107 people
- By 2030
- 78,089 · +-0.0%
- By 2040
- 76,814 · -1.7%
- By 2050
- 74,515 · -4.6%
- By 2075
- 67,687 · -13.3%
- By 2100
- 55,023 · -29.6%
Race, ethnicity, and origin ACS 2023
- Neighborhood character
- Predominantly White (73%)
- Race & ethnicity
- White 73% Black 19% Two or more races 5% Hispanic / Latino 3%
- Common ancestry
- Slovak 2% Lithuanian 2% Italian 1%
- Foreign-born
- 3% · Canada
- Languages at home
- 96% English-only · Spanish 2%
Political lean MEDSL · Cole
- 2024 margin
- Solid R (+34.4) · D 32.1% · R 66.5% · Other 1.4%
- 2008→2024 swing
- -7.5pp toward R · 2008: -26.9pp · 2024: -34.4pp
- All cycles
- 2024: R+34.4 2020: R+33.9 2016: R+36.8 2012: R+33.7 2008: R+26.9
Not yet ingested
- Civics
- —
Market trends
- HPI YoY
- ▼ -86.16%
- Current HPI
- 209.3832
- Rent YoY
- —
- Metro
- —
- State GDP YoY
- ▲ 1.84%
- F500 in state
- 20
Industry mix (Fortune 500 HQ in MO)
| Industry | F500 HQs | Revenue |
|---|---|---|
| Healthcare | 1 | $163B |
|
||
| Insurance | 1 | $21B |
|
||
| Industrial Technology | 1 | $17B |
|
||
| Retail | 1 | $16B |
|
||
| Industrial Distribution | 1 | $10B |
|
||
| Utilities | 1 | $9B |
|
||
Price history
+193.2% since first listed18 events — show timeline
- 2026-04-29 Price Changed $278,500 JCMLS
- 2026-01-22 Price Changed $285,000 JCMLS
- 2025-12-29 Listed $295,000 JCMLS
- 2024-07-19 Sold (Public Records) — Public Records
- 2024-07-19 Sold (MLS) — JCMLS
- 2024-06-25 Delisted — JCMLS
- 2024-06-22 Listed $260,000 JCMLS
- 2023-04-26 Price Changed $229,900 JCMLS
- 2023-03-09 Price Changed $234,900 JCMLS
- 2022-02-16 Price Changed $595 RENT.
- 2021-12-07 Sold (Public Records) — Public Records
- 2021-12-07 Sold (MLS) — JCMLS
- 2021-12-07 Sold (MLS) — CBORMLS
- 2021-11-03 Listed $164,900 JCMLS
- 2015-12-08 Sold (MLS) — JCMLS
- 2015-09-07 Listed $69,900 JCMLS
- 2014-01-24 Sold (MLS) — JCMLS
- 2013-03-01 Listed $95,000 JCMLS
Property tax history
+1.4%/yrLatest (2025): $1,104 · +4.8% YoY. Source: county tax records.
Cash-flow waterfall
monthlySold comps — $/sqft
last 12 mo · ≤1 miLoading sold comps…