 🏷️ Likely Rental
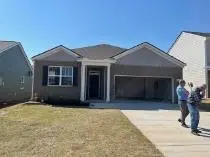
5433 Conifer Ln · Cookeville, TN
Flood risk No data
- FEMA flood zone
- —
- Chance of flooding over 30 yrs
- —
- Est. flood insurance / yr
- —
Fire risk No data
- Est. fire insurance / yr
- —
Heat risk No data
- Hot days now (above threshold)
- —
- Hot days in 30 yrs
- —
Wind risk No data
- Chance of severe wind over 30 yrs
- —
Air-quality risk No data
- Unhealthy air days now
- —
- Unhealthy air days in 30 yrs
- —
Risk factors via First Street. Map © Google.
Why this score? — see what drove the D grade
The composite is a weighted blend of 9 inputs, each scored 0–100. Each bar is that input's sub-score; the figure is the points it added to the 100-point composite (weight × sub-score).
- Cash flow +15.0/30.0
- ARV discount +7.5/15.0
- 1% rule +5.0/10.0
- DSCR +5.0/10.0
- Livability +3.8/5.0
- Schools +2.6/10.0
- Rent growth +2.5/5.0
- Condition / age +2.5/5.0
- Appreciation +0.0/10.0
$2,100
🖨 Deal sheet 📄 Offer letter ✓ Due diligence
Listing remarks
NEVER OCCUPIED 3 BEDROOM 2 BATH HOME IN COOKEVILLE!! This Home Features Laminate Floors, Stainless Steel Appliances, Quartz Counters. Located in the new community of Timberwalk located just off SR 111 and just South of I-40. Excellent location to all shopping, restaurants and Tennessee Tech University. Home has an open patio and a 2 car garage. Home has natural gas for the Stove and Heat. Washer and Dryer included. Public Utilities and a COMMUNITY POOL!!!! This home is ready for immediate occupancy.
Key facts
- Quartz counters
- Laminate floors
- Open patio
Tags
Neighborhood map
What this means for you Summary
Snapshot
- This is a 3-bed/2.0-bath single-family listed at $2k.
Deal economics
- At list price, monthly cash flow is $1k ($16k/yr) — positive.
- The deal already cash-flows at list — no discount required.
- Meets the 1% rule at list price ($2k rent vs $2k).
- Recommended offer: $2k (3.0% below list) — sets the bar for market timing.
- Cap rate 780.9% vs local median 3.1% in Cookeville — top-decile yield for the area; either an underpriced asset or a hidden risk that comps aren't pricing in. Stress-test before assuming the spread holds.
Location & tenants
- Location reads 76/100 on livability (#11 in TN, #3,551 nationally) — a middle-class / working-renter tenant base. Strengths: amenities A+, cost of living A+, health & safety A+; Watch: schools D-, commute F, employment F.
- Putnam County (town): math 32% / reading 31% proficiency, ranked #49 of 139 in TN (top 35%) — families likely to look elsewhere, expect single-tenant / working-renter base with shorter leases.
- Market conditions: 323 active listings in the ZIP; 700 units permitted in Putnam County in 2024 (48 in 5+ unit buildings).
Forward outlook
- Local home prices are declining (-3.0%/yr); year-one equity from $15 of loan paydown is wiped out by about $63 of value loss. Plan a longer hold.
- Putnam County population projected at +16% by 2050 — long-run rental-demand tailwind backs the buy-and-hold thesis.
- At projected returns (-3.0% appreciation + 3.0% rent growth), your $588 cash investment doubles in ~1 year — after that, you're playing with house money.
Negotiation context
- It's been on market 31 days — a 3% lower offer ($2k) is reasonable based on typical stale-listing flexibility.
Questions for the listing agent
- It's been on market 31 days. Have you received any prior offers? Is the seller open to a 3% concession, seller financing, or rate buy-down credit?
- Is there a deadline driving the sale (1031 exchange, divorce, estate, relocation)? That informs how much negotiation room exists.
- Schools are D-rated, which usually means shorter tenancies and higher turnover. Who's the typical renter profile here, and what's been the actual vacancy rate?
- The area grade is low — what's the realistic commute time and amenity access for the typical tenant pool here? Any planned neighborhood developments (good or bad) we should know about?
- What's the average days-on-market for RENTAL listings here right now (not sales)? A rising rental-DOM trend means longer vacancies and softer asking-rent achievability than the comps imply.
- What's the recent tenant-quality profile in this submarket — average credit score on applications, eviction rate, late-payment / NSF rate, and stable-employment percentage? A property-management company in the area should have these aggregated.
- How much new for-sale + rental construction is in the pipeline within 1–3 miles? Heavy new supply typically softens prices + rents 12–24 months out; constrained supply supports both.
Investment metrics
- 1% rule
- 82.58% ✓
- Cap rate
- 780.85%
- Cash-on-cash
- 2766.29%
- DSCR
- 124.08
- GRM
- 0.1
CMA / ARV
- ARV (median comp)
- $359,616
- List price
- $2,100
- Delta
- -99.42%
- Verdict
- UNDERPRICED
- Comps
- 20 within 1.0 mi
Show comp detail 12 sales within ~0.75 mi
| Address | Dist | Beds/Ba | Sqft | Sold | Price | $/sf | Match |
|---|---|---|---|---|---|---|---|
| 5447 Mason Way | 0.14mi | 4/2.5 (+1) | 2,267 (-5%) | 7mo | $339,990 | $150 | 72 |
| 5446 Briley Ln | 0.18mi | 4/2.5 (+1) | 2,431 (+2%) | 12mo | $391,000 | $161 | 71 |
| 5449 SW Briley Ln | 0.18mi | 4/2.5 (+1) | 2,431 (+2%) | 13mo | $415,000 | $171 | 71 |
| 5421 E Mason Way | 0.14mi | 4/2.5 (+1) | 2,431 (+2%) | 16mo | $399,990 | $165 | 70 |
| 5434 Briley Ln | 0.11mi | 4/2.5 (+1) | 2,250 (-6%) | 12mo | $425,890 | $189 | 68 |
| 250 S Lovelady Dr | 0.14mi | 3/2.0 | 2,069 (-13%) | 6mo | $380,000 | $184 | 66 |
| 5430 SW Mason Way | 0.14mi | 4/2.5 (+1) | 2,267 (-5%) | 14mo | $389,990 | $172 | 66 |
| 5448 Briley Ln | 0.18mi | 4/2.5 (+1) | 2,267 (-5%) | 13mo | $393,880 | $174 | 65 |
| 5450 Briley Ln | 0.18mi | 4/2.5 (+1) | 2,250 (-6%) | 13mo | $409,000 | $182 | 64 |
| 5440 Briley Ln | 0.18mi | 4/2.5 (+1) | 2,250 (-6%) | 13mo | $399,990 | $178 | 64 |
| 5462 SW Briley Ln | 0.18mi | 4/2.5 (+1) | 2,250 (-6%) | 14mo | $418,990 | $186 | 63 |
| 626 Blue Water Dr | 0.50mi | 4/2.5 (+1) | 2,460 (+3%) | 5mo | $535,000 | $217 | 60 |
Match score weights: distance 35% · size 25% · config 20% · recency 20%. Top-matched comps best support the ARV.
Projected returns pro-forma
-3.0% appreciation · 3.0% rent growth · sell at horizon
- IRR
- —
- Equity multiple
- 147.29×
- Total profit
- $86,017
- Equity at exit
- $313
- IRR
- —
- Equity multiple
- 317.62×
- Total profit
- $186,174
- Equity at exit
- $182
Cash invested: $588 (down + closing). Projections, not guarantees.
Landlord ↔ Tenant lean methodology
- Overall (STATE)
- 87 Strongly Landlord-Friendly
- State Tennessee
- 87 Strongly Landlord-Friendly · R+13
- County
- — inherits STATE
- City
- — inherits STATE
ZIP-level market 38506
- Home prices YoY
- -20.1%
- Active inventory
- 323
- Price-to-rent
- 0.1×
Monthly cashflow live
- Estimated rent
- $1,734 medium interval (Pro) →
- Mortgage (P&I)
- −$11
- Tax est. 1.5%
- −$3 /mo · $32/yr
- Insurance
- −$1
- HOA
- −$0
- Vacancy / Maint / Mgmt
- −$364
- Net cashflow
- $1,355
Break-even live
UW: 25.0% down · 7.5% · 30yr · 1.5% tax · 5.0% vac · 8.0% maint · 8.0% mgmt
Financing live
Cash to close
- Down payment
- $525
- Closing costs
- $63
- Reserves months
- —
- Total cash needed
- —
Loan-product check · same deal, 3 products live
Conventional
25% down · 7.5% · 30yr
- Down + closing
- —
- Monthly P&I
- —
- Monthly cashflow
- —
- DSCR
- —
- Eligible?
- —
Personal DTI + credit; lowest rate.
DSCR
20% down · 8.5% · 30yr
- Down + closing
- —
- Monthly P&I
- —
- Monthly cashflow
- —
- DSCR
- —
- Eligible?
- —
No personal income docs; deal must DSCR.
Hard money
10% down · 12.0% · 12mo
- Down + closing
- —
- Monthly P&I
- —
- Monthly cashflow
- —
- DSCR
- —
- Eligible?
- —
Short-term bridge; refi at stabilization.
Listing history 14 events
-
2026-06-13days on market $2,100 Active 31 DOM
-
2026-06-10days on market $2,100 Active 29 DOM
-
2026-06-09days on market $2,100 Active 28 DOM
-
2026-06-08days on market $2,100 Active 27 DOM
-
2026-06-07days on market $2,100 Active 26 DOM
-
2026-06-05days on market $2,100 Active 23 DOM
-
2026-06-02days on market $2,100 Active 21 DOM
-
2026-06-01days on market $2,100 Active 20 DOM
-
2026-05-31days on market $2,100 Active 19 DOM
-
2026-05-30days on market $2,100 Active 18 DOM
-
2026-05-15historical $2,100
-
2026-05-12$2,100 Active 507-char remark
-
2026-05-05price $2,100
-
2026-04-17$2,075
ⓘ Source: listings_history table (triggers on properties + properties_extension) + one-shot
backfill from property_details.listing_events for pre-trigger history.
Nearby sold comps map
Loading sold comps map…
Walkable amenities ~0.75 mi
Loading nearby amenities…
Taxation est. · year 1
- Rental income
- $20,810
- − Mortgage interest
- −$118
- − Property taxes
- −$32
- − Insurance
- −$10
- − Repairs & maintenance
- −$1,665
- − Management
- −$1,665
- − Depreciation
- −$61
- Taxable income
- $17,260
- Est. tax owed @ 24.0%
- −$4,142
- After-tax cash flow
- $12,123/yr
For passive investors: Depreciation is non-cash, so a rental often shows a tax loss while cash-flowing — sheltering income. Rental losses are passive: they offset passive income freely, and up to $25,000/yr can offset ordinary (W-2) income if you actively participate and your MAGI is under $100k (phasing out to $0 by $150k); unused losses carry forward. On sale, claimed depreciation is recaptured at up to 25%, and gains may owe capital-gains tax (a 1031 exchange can defer both). Figures are a year-1 estimate at your 24.0% rate — not tax advice; consult a CPA.
Schools (NCES district)
- District
- Putnam County
- NCES district ID
- 4703480
- Math proficiency
- 32% ▼ -6.00%
- Reading proficiency
- 31% ▼ -5.00%
- Median HH income
- $35,738
- Composite
- 26.09/100
- National rank
- #7291
- State rank
- #49 of 139 in TN
Livability — Cookeville
- Score
- 76/100
- State rank
- #11
- US rank
- #3551
Category grades
Schools grade is shown separately in the Schools card above.
Census & demographics
- Census place
- Cookeville, TN
- County
- Putnam County · 72,571 people
- City population
- 72,571
- Metro
- Cookeville, TN
- Population (ZIP)
- 30,100
- Household income
- $70,279
- Rent vs Own
- Severe rent burden
- 415.0
Population outlook (Putnam County) Hauer SSP2
- Today (2025)
- 80,122 people
- By 2030
- 82,798 · +3.3%
- By 2040
- 87,913 · +9.7%
- By 2050
- 92,659 · +15.6%
- By 2075
- 104,965 · +31.0%
- By 2100
- 113,256 · +41.4%
Race, ethnicity, and origin ACS 2023
- Neighborhood character
- Predominantly White (92%)
- Race & ethnicity
- White 92% Hispanic / Latino 5% Two or more races 4%
- Hispanic origin (detail)
- Mexican 1%
- Common ancestry
- Lithuanian 3% Slovak 3% Serbian 2%
- Foreign-born
- 4% · Canada
- Languages at home
- 96% English-only · Spanish 2%
Political lean MEDSL · Putnam
- 2024 margin
- Solid R (+47.4) · D 25.7% · R 73.1% · Other 1.1%
- 2008→2024 swing
- -20.5pp toward R · 2008: -26.9pp · 2024: -47.4pp
- All cycles
- 2024: R+47.4 2020: R+43.4 2016: R+45.0 2012: R+37.1 2008: R+26.9
Not yet ingested
- Civics
- —
Market trends
- HPI YoY
- ▼ -72.51%
- Current HPI
- 288.5877
- Rent YoY
- —
- Metro
- Cookeville, TN
- State GDP YoY
- ▲ 2.78%
- F500 in state
- 22
Industry mix (Fortune 500 HQ in TN)
| Industry | F500 HQs | Revenue |
|---|---|---|
| Healthcare | 3 | $91B |
|
||
| Retail | 3 | $72B |
|
||
| Transportation / Logistics | 1 | $88B |
|
||
| Paper / Packaging | 1 | $19B |
|
||
| Insurance | 1 | $13B |
|
||
| Energy | 1 | $12B |
|
||
Price history
+1.2% since first listed3 events — show timeline
- 2026-05-15 Rental Removed $2,100 BUILDIUM
- 2026-05-05 Price Changed $2,100 BUILDIUM
- 2026-04-17 Listed for Rent $2,075 BUILDIUM
Cash-flow waterfall
monthlySold comps — $/sqft
last 12 mo · ≤1 miLoading sold comps…