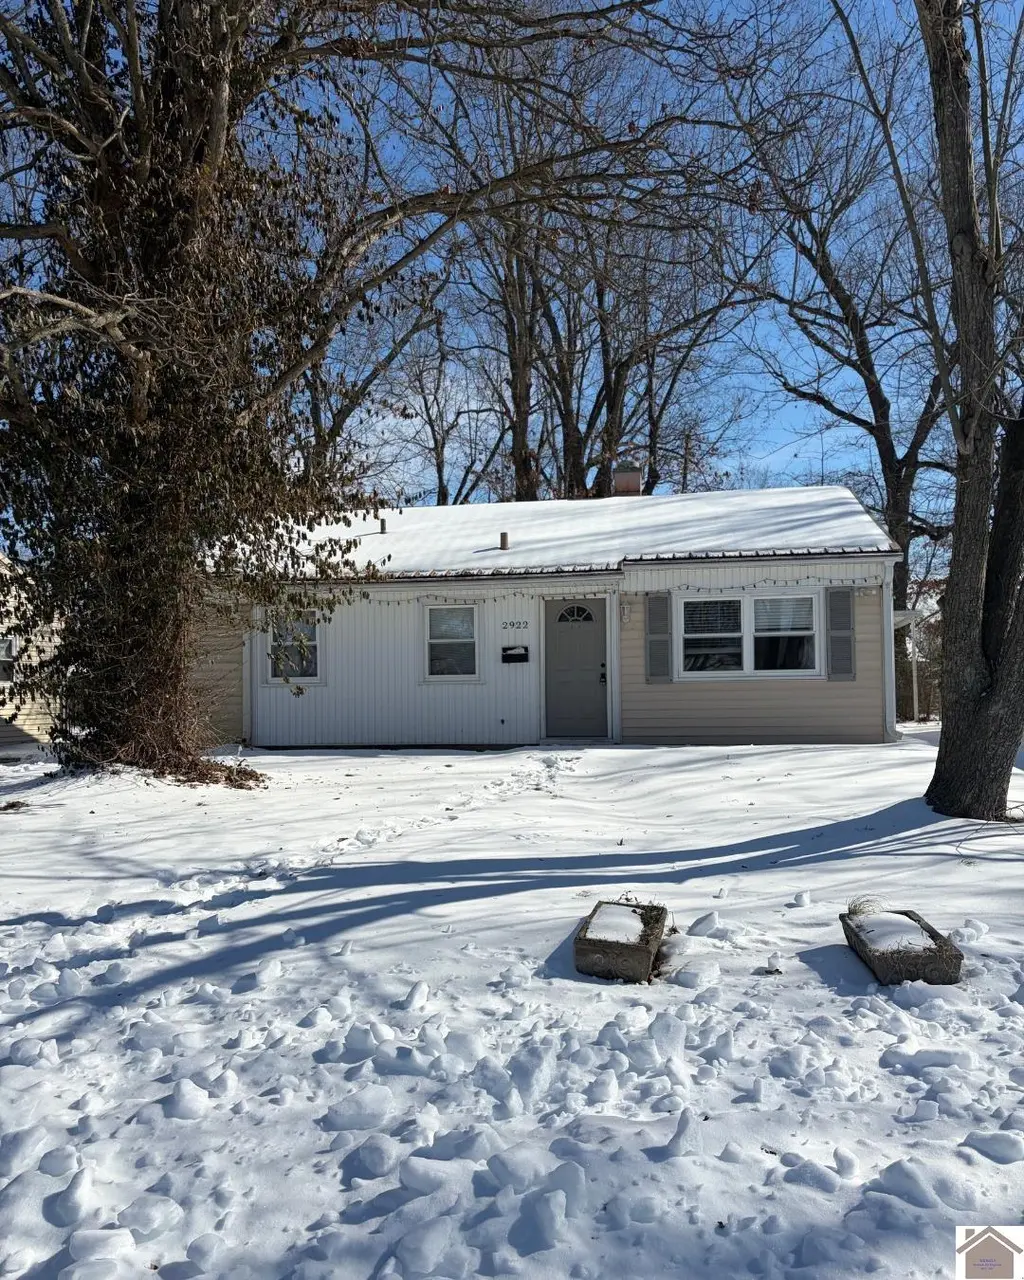
2922 Georgia St · Paducah, KY
Flood risk 1/10 · Minimal
- FEMA flood zone
- X
- Chance of flooding over 30 yrs
- 0.0%
- Est. flood insurance / yr
- $507 – $1,088
Fire risk 3/10 · Minor
- Est. fire insurance / yr
- $839 – $1,559
Heat risk 6/10 · Moderate
- Hot days now (above 108°F)
- 7 days/yr
- Hot days in 30 yrs
- 20 days/yr
Wind risk 3/10 · Minor
- Chance of severe wind over 30 yrs
- 7.0%
Air-quality risk 3/10 · Minor
- Unhealthy air days now
- 1 days/yr
- Unhealthy air days in 30 yrs
- 4 days/yr
Risk factors via First Street. Map © Google.
Why this score? — see what drove the C+ grade
The composite is a weighted blend of 9 inputs, each scored 0–100. Each bar is that input's sub-score; the figure is the points it added to the 100-point composite (weight × sub-score).
- Cash flow +27.9/30.0
- DSCR +9.9/10.0
- ARV discount +8.7/15.0
- 1% rule +6.5/10.0
- Livability +3.4/5.0
- Rent growth +2.5/5.0
- Condition / age +2.5/5.0
- Schools +2.3/10.0
- Appreciation +0.0/10.0
$105,000
🖨 Deal sheet 📄 Offer letter ✓ Due diligence
Listing remarks MLS
Opportunity Awaits! This 3-bedroom, 1-bath home offers just over 1,000 square feet of living space and is located minutes from Morgan Elementary. Featuring a backyard and carport, the property has a functional layout with room to personalize. With its convenient location and value-add potential, this home could be a great option for both owner-occupants and investors alike.
Key facts
- Value-add potential
- Backyard
- Carport
Tags
Neighborhood map
What this means for you Summary
Snapshot
- This is a 3-bed/1.0-bath single-family listed at $105k.
Deal economics
- At list price, monthly cash flow is $324 ($4k/yr) — positive.
- The deal already cash-flows at list — no discount required.
- Meets the 1% rule at list price ($1k rent vs $105k).
- Recommended offer: $92k (12.0% below list) — sets the bar for market timing.
- Cap rate 10.0% vs local median 4.5% in Paducah — top-decile yield for the area; either an underpriced asset or a hidden risk that comps aren't pricing in. Stress-test before assuming the spread holds.
Location & tenants
- Location reads 68/100 on livability (#197 in KY) — a middle-class / working-renter tenant base. Strengths: cost of living A+, housing A+, health & safety A+; Watch: crime C-, schools D+, employment D.
- Paducah Independent (town): math 22% / reading 36% proficiency, ranked #122 of 165 in KY (top 74%) — low school quality limits family demand, transient renter base, plan for 1-2y turnover; 69% free/reduced lunch — lower-income household profile, screen leases tightly.
- Market conditions: 268 active listings in the ZIP; 3 comparable units currently listed for rent nearby; rentals lingering (median 44d on market — plan ~5-8 weeks vacancy on turnover, expect pricing pressure); 100% of comp listings sitting > 30 days — soft ceiling on asking rent; 187 units permitted in McCracken County in 2024 (104 in 5+ unit buildings).
Forward outlook
- Local home prices are declining (-3.0%/yr); year-one equity from $726 of loan paydown is wiped out by about $3k of value loss. Plan a longer hold.
- McCracken County population projected to shrink 9% by 2050 — rents likely to lag national; underwrite the cash flow, not the appreciation.
- At projected returns (-3.0% appreciation + 3.0% rent growth), your $29k cash investment doubles in ~9 years — after that, you're playing with house money.
Negotiation context
- It's been on market 136 days — a 12% lower offer ($92k) is reasonable based on typical stale-listing flexibility.
- 2 sale attempts since 5y ago; this cycle's ask has dropped $10k (9%) from the opening price — seller is motivated, your offer sets the floor, not the list.
Risks & watch-outs
- Watch-outs: built in 1952 — expect roof / HVAC / electrical / plumbing capex.
- Climate carrying-cost: extreme-heat days projected 7→20/yr by 2055 (HVAC capex compounding) — expect insurance premiums to compound above CPI over the hold.
Questions for the listing agent
- It's been on market 136 days. Have you received any prior offers? Is the seller open to a 12% concession, seller financing, or rate buy-down credit?
- Built in 1952 — when were the roof, HVAC, electrical panel, plumbing, and water heater last replaced?
- Why hasn't it sold? Are there any deal-killer items the seller is aware of (foundation, flood, title, zoning, code violations)?
- Is there a deadline driving the sale (1031 exchange, divorce, estate, relocation)? That informs how much negotiation room exists.
- Schools are D-rated, which usually means shorter tenancies and higher turnover. Who's the typical renter profile here, and what's been the actual vacancy rate?
- What's the average days-on-market for RENTAL listings here right now (not sales)? A rising rental-DOM trend means longer vacancies and softer asking-rent achievability than the comps imply.
- What's the recent tenant-quality profile in this submarket — average credit score on applications, eviction rate, late-payment / NSF rate, and stable-employment percentage? A property-management company in the area should have these aggregated.
- How much new for-sale + rental construction is in the pipeline within 1–3 miles? Heavy new supply typically softens prices + rents 12–24 months out; constrained supply supports both.
Investment metrics
- 1% rule
- 1.15% ✓
- Cap rate
- 10.00%
- Cash-on-cash
- 13.22%
- DSCR
- 1.59
- GRM
- 7.2
CMA / ARV
- ARV (median comp)
- $107,789
- List price
- $105,000
- Delta
- -2.59%
- Verdict
- FAIR
- Comps
- 20 within 1.0 mi
Show comp detail 12 sales within ~0.75 mi
| Address | Dist | Beds/Ba | Sqft | Sold | Price | $/sf | Match |
|---|---|---|---|---|---|---|---|
| 2827 Cornell St | 0.08mi | 2/1.0 (-1) | 994 (-2%) | 0mo | $144,500 | $145 | 87 |
| 2936 Cornell St | 0.07mi | 3/1.0 | 1,080 (+6%) | 5mo | $94,000 | $87 | 83 |
| 2328 Center St | 0.27mi | 3/1.0 | 960 (-6%) | 4mo | $158,000 | $165 | 75 |
| 2332 Center St | 0.27mi | 3/1.0 | 960 (-6%) | 6mo | $128,400 | $134 | 72 |
| 2905 Old Mayfield Rd | 0.16mi | 3/2.0 | 1,130 (+11%) | 2mo | $165,000 | $146 | 69 |
| 3019 Mississippi St | 0.20mi | 2/1.0 (-1) | 918 (-10%) | 3mo | $150,000 | $163 | 67 |
| 3017 Georgia St | 0.09mi | 2/1.0 (-1) | 888 (-13%) | 4mo | $70,000 | $79 | 66 |
| 2801 Cornell St | 0.11mi | 4/1.0 (+1) | 1,152 (+13%) | 4mo | $72,000 | $63 | 65 |
| 1116 Starke Ave | 0.45mi | 3/1.0 | 1,112 (+9%) | 4mo | $135,000 | $121 | 60 |
| 2811 Bradley St | 0.41mi | 3/1.0 | 912 (-10%) | 5mo | $45,000 | $49 | 60 |
| 2832 Goodman St | 0.28mi | 2/1.0 (-1) | 890 (-13%) | 2mo | $35,000 | $39 | 59 |
| 926 S 21st St | 0.67mi | 2/1.0 (-1) | 1,102 (+8%) | 4mo | $79,000 | $72 | 46 |
Match score weights: distance 35% · size 25% · config 20% · recency 20%. Top-matched comps best support the ARV.
Projected returns pro-forma
-3.0% appreciation · 3.0% rent growth · sell at horizon
- IRR
- 3.2%
- Equity multiple
- 1.12×
- Total profit
- $3,580
- Equity at exit
- $15,656
- IRR
- 12.7%
- Equity multiple
- 2.00×
- Total profit
- $29,530
- Equity at exit
- $9,078
Cash invested: $29,400 (down + closing). Projections, not guarantees.
Landlord ↔ Tenant lean methodology
- Overall (STATE)
- 83 Strongly Landlord-Friendly
- State Kentucky
- 83 Strongly Landlord-Friendly · R+16
- County
- — inherits STATE
- City
- — inherits STATE
ZIP-level market 42003
- Home prices YoY
- -19.8%
- Active inventory
- 268
- Price-to-rent
- 7.2×
Monthly cashflow live
- Estimated rent
- $1,213 medium interval (Pro) →
- Mortgage (P&I)
- −$551
- Tax from tax record
- −$40 /mo · $476/yr
- Insurance
- −$44
- HOA
- −$0
- Vacancy / Maint / Mgmt
- −$255
- Net cashflow
- $324
Break-even live
UW: 25.0% down · 7.5% · 30yr · 1.5% tax · 5.0% vac · 8.0% maint · 8.0% mgmt
Financing live
Cash to close
- Down payment
- $26,250
- Closing costs
- $3,150
- Reserves months
- —
- Total cash needed
- —
Loan-product check · same deal, 3 products live
Conventional
25% down · 7.5% · 30yr
- Down + closing
- —
- Monthly P&I
- —
- Monthly cashflow
- —
- DSCR
- —
- Eligible?
- —
Personal DTI + credit; lowest rate.
DSCR
20% down · 8.5% · 30yr
- Down + closing
- —
- Monthly P&I
- —
- Monthly cashflow
- —
- DSCR
- —
- Eligible?
- —
No personal income docs; deal must DSCR.
Hard money
10% down · 12.0% · 12mo
- Down + closing
- —
- Monthly P&I
- —
- Monthly cashflow
- —
- DSCR
- —
- Eligible?
- —
Short-term bridge; refi at stabilization.
Rent comps 3 comps
| Address | Beds | Baths | Sqft | Rent | $/sqft | DOM | Units | Dist |
|---|---|---|---|---|---|---|---|---|
| 1900 Jefferson St Paducah, KY | 2.0 | 1.0 | 800 | $1,400 | $1.75 | 43d | 1 | 1.22mi |
| 1643 Monroe St Apt A Paducah, KY | 2.0 | 1.0 | 1127 | $1,250 | $1.11 | 43d | 1 | 1.41mi |
| 2967 Harrison St Paducah, KY | 1.0–2.0 | 1.0 | 725 | $915 | $1.26 | 43d | 1 | 1.47mi |
Listing history 21 events
-
2026-06-19days on market $105,000 Active 136 DOM
-
2026-06-18days on market $105,000 Active 135 DOM
-
2026-06-17days on market $105,000 Active 134 DOM
-
2026-06-16days on market $105,000 Active 133 DOM
-
2026-06-15days on market $105,000 Active 132 DOM
-
2026-06-14days on market $105,000 Active 130 DOM
-
2026-06-12days on market $105,000 Active 129 DOM
-
2026-06-09days on market $105,000 Active 126 DOM
-
2026-06-08days on market $105,000 Active 125 DOM
-
2026-06-07days on market $105,000 Active 124 DOM
-
2026-06-03days on market $105,000 Active 120 DOM
-
2026-06-02days on market $105,000 Active 119 DOM
-
2026-06-01days on market $105,000 Active 118 DOM
-
2026-05-31days on market $105,000 Active 117 DOM
-
2026-05-30days on market $105,000 Active 116 DOM
-
2026-03-02price $105,000 376-char remark
Show marketing remark (376 chars)
Opportunity Awaits! This 3-bedroom, 1-bath home offers just over 1,000 square feet of living space and is located minutes from Morgan Elementary. Featuring a backyard and carport, the property has a functional layout with room to personalize. With its convenient location and value-add potential, this home could be a great option for both owner-occupants and investors alike.
-
2026-02-03$115,000 Active 376-char remark
Show marketing remark (376 chars)
Opportunity Awaits! This 3-bedroom, 1-bath home offers just over 1,000 square feet of living space and is located minutes from Morgan Elementary. Featuring a backyard and carport, the property has a functional layout with room to personalize. With its convenient location and value-add potential, this home could be a great option for both owner-occupants and investors alike.
-
2022-02-10soldstatus $133,000
-
2022-02-09soldstatus $133,000 192-char remark
Show marketing remark (192 chars)
Completely remodeled 3br 1ba home on a nice quiet street. All new flooring, paint, stainless appliances, including new gas stove. Additional amenities include carport & storage building.
-
2021-12-28$134,900 192-char remark
Show marketing remark (192 chars)
Completely remodeled 3br 1ba home on a nice quiet street. All new flooring, paint, stainless appliances, including new gas stove. Additional amenities include carport & storage building.
-
2021-03-11soldstatus $55,550
ⓘ Source: listings_history table (triggers on properties + properties_extension) + one-shot
backfill from property_details.listing_events for pre-trigger history.
Tax reassessment forecast KY · Resets to sale price
- Current annual tax
- $476 · $40/mo
- Projected year-2 tax
- $903 · $75/mo
- Expected delta
- +$427/yr (+$36/mo · 89.7%)
ⓘ Screening estimate from a state-policy table — verify with the county assessor before closing.
Climate risk First Street
- Flood 1/10 Low FEMA zone X · 0% chance over 30 yrs
- Wildfire 3/10 Moderate
- Heat 6/10 Major 7 d/yr ≥108°F today · 20 d/yr by 30 yrs out
- Wind 3/10 Moderate 7% chance of damaging wind over 30 yrs
- Air quality 3/10 Moderate 1 unhealthy d/yr today · 4 by 30 yrs out
Nearby sold comps map
Loading sold comps map…
Walkable amenities ~0.75 mi
Loading nearby amenities…
Taxation est. · year 1
- Rental income
- $14,552
- − Mortgage interest
- −$5,882
- − Property taxes
- −$476
- − Insurance
- −$525
- − Repairs & maintenance
- −$1,164
- − Management
- −$1,164
- − Depreciation
- −$3,055
- Taxable income
- $2,286
- Est. tax owed @ 24.0%
- −$549
- After-tax cash flow
- $3,339/yr
For passive investors: Depreciation is non-cash, so a rental often shows a tax loss while cash-flowing — sheltering income. Rental losses are passive: they offset passive income freely, and up to $25,000/yr can offset ordinary (W-2) income if you actively participate and your MAGI is under $100k (phasing out to $0 by $150k); unused losses carry forward. On sale, claimed depreciation is recaptured at up to 25%, and gains may owe capital-gains tax (a 1031 exchange can defer both). Figures are a year-1 estimate at your 24.0% rate — not tax advice; consult a CPA.
Schools (NCES district)
- District
- Paducah Independent
- NCES district ID
- 2104650
- Math proficiency
- 22% ▼ -14.00%
- Reading proficiency
- 36% ▼ -17.00%
- Median HH income
- $30,067
- Composite
- 23.41/100
- National rank
- #7896
- State rank
- #122 of 165 in KY
Livability — Paducah
- Score
- 68/100
- State rank
- #197
- US rank
- #9780
Category grades
Schools grade is shown separately in the Schools card above.
Census & demographics
- Census place
- Paducah, KY
- City population
- 30,856
- Population (ZIP)
- 29,384
Population outlook (McCracken County) Hauer SSP2
- Today (2025)
- 64,237 people
- By 2030
- 63,468 · -1.2%
- By 2040
- 61,221 · -4.7%
- By 2050
- 58,432 · -9.0%
- By 2075
- 52,668 · -18.0%
- By 2100
- 44,517 · -30.7%
Race, ethnicity, and origin ACS 2023
- Neighborhood character
- Predominantly White (83%)
- Race & ethnicity
- White 83% Black 9% Two or more races 5% Hispanic / Latino 4%
- Common ancestry
- Slovak 2% Lithuanian 1% Serbian 1%
- Foreign-born
- 2% · Canada
- Languages at home
- 97% English-only · Spanish 1% Other Asian/Pacific 1%
Political lean MEDSL · McCracken
- 2024 margin
- Solid R (+34.9) · D 31.9% · R 66.8% · Other 1.2%
- 2008→2024 swing
- -9.7pp toward R · 2008: -25.2pp · 2024: -34.9pp
- All cycles
- 2024: R+34.9 2020: R+31.7 2016: R+37.2 2012: R+32.5 2008: R+25.2
Not yet ingested
- Civics
- —
Market trends
- HPI YoY
- ▼ -58.31%
- Current HPI
- 236.3013
- Rent YoY
- —
- Metro
- —
- State GDP YoY
- ▲ 1.81%
- F500 in state
- 4
Industry mix (Fortune 500 HQ in KY)
| Industry | F500 HQs | Revenue |
|---|---|---|
| Healthcare | 1 | $118B |
|
||
| Food / Beverage | 1 | $7B |
|
||
Price history
+89.0% since first listed6 events — show timeline
- 2026-03-02 Price Changed $105,000 WKRMLS
- 2026-02-03 Listed $115,000 WKRMLS
- 2022-02-10 Sold (Public Records) $133,000 Public Records
- 2022-02-09 Sold (MLS) $133,000 WKRMLS
- 2021-12-28 Listed $134,900 WKRMLS
- 2021-03-11 Sold (Public Records) $55,550 Public Records
Property tax history
-4.8%/yrLatest (2025): $476 · -0.8% YoY. Source: county tax records.
Cash-flow waterfall
monthlySold comps — $/sqft
last 12 mo · ≤1 miLoading sold comps…