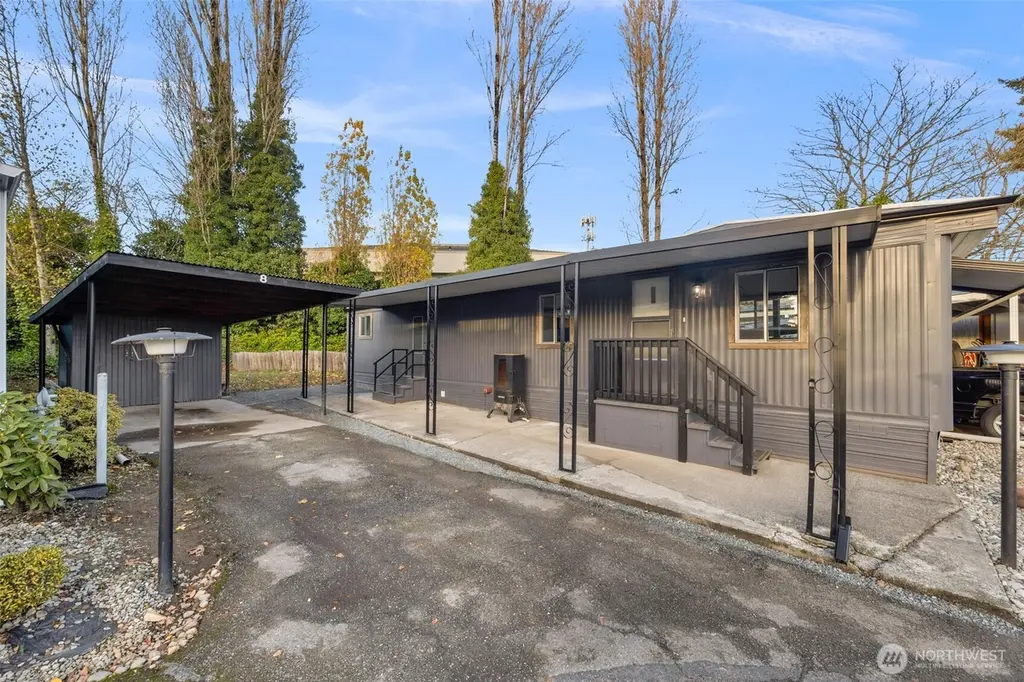
14322 Admiralty Way #8 · Lake Stickney, WA
Flood risk No data
- FEMA flood zone
- —
- Chance of flooding over 30 yrs
- —
- Est. flood insurance / yr
- —
Fire risk No data
- Est. fire insurance / yr
- —
Heat risk No data
- Hot days now (above threshold)
- —
- Hot days in 30 yrs
- —
Wind risk No data
- Chance of severe wind over 30 yrs
- —
Air-quality risk No data
- Unhealthy air days now
- —
- Unhealthy air days in 30 yrs
- —
Risk factors via First Street. Map © Google.
Why this score? — see what drove the B+ grade
The composite is a weighted blend of 9 inputs, each scored 0–100. Each bar is that input's sub-score; the figure is the points it added to the 100-point composite (weight × sub-score).
- Cash flow +30.0/30.0
- ARV discount +13.2/15.0
- 1% rule +10.0/10.0
- DSCR +10.0/10.0
- Schools +4.8/10.0
- Livability +3.7/5.0
- Rent growth +2.8/5.0
- Condition / age +2.5/5.0
- Appreciation +0.0/10.0
$82,999
🖨 Deal sheet 📄 Offer letter ✓ Due diligence
Listing remarks
Beautifully remodeled 2-bedroom, 1-bath home offering fresh, modern living throughout. Enjoy an open and bright layout with new flooring, updated lighting, and large windows that fill the space with natural light. The stunning kitchen features white cabinets, butcher block counters, stainless steel appliances, and a warm mosaic tile backsplash. Updated bath with stylish finishes plus a new stackable washer/dryer for added convenience. Both bedrooms offer clean lines and built-in storage. Exterior highlights include covered parking, a spacious covered porch, and low-maintenance landscaping. Truly move-in ready!
Key facts
- Large windows
- New flooring
- Open layout
Tags
Neighborhood map
What this means for you Summary
Snapshot
- This is a 2-bed/1.0-bath manufactured listed at $83k.
Deal economics
- At list price, monthly cash flow is $1k ($13k/yr) — positive.
- The deal already cash-flows at list — no discount required.
- Meets the 1% rule at list price ($2k rent vs $83k).
- Recommended offer: $73k (12.0% below list) — sets the bar for market timing.
- Cap rate 21.4% vs local median 2.4% in Lake Stickney — top-decile yield for the area; either an underpriced asset or a hidden risk that comps aren't pricing in. Stress-test before assuming the spread holds.
Location & tenants
- Location reads 73/100 on livability (#192 in WA) — a middle-class / working-renter tenant base. Strengths: commute A+, employment A, health & safety A; Watch: schools D, amenities D-, cost of living F.
- Mukilteo School District (suburban): math 47% / reading 59% proficiency, ranked #111 of 291 in WA (top 38%) — acceptable for families but not a draw, mixed tenant base, ~2y average lease.
- Market conditions: Rents rising (+1.2%/yr); 232 active listings in the ZIP; 19 comparable units currently listed for rent nearby; rentals leasing fast (median 2d on market — plan ~1-2 weeks tenant-placement turnaround); solid renter incomes; 3,982 units permitted in Snohomish County in 2024 (1,492 in 5+ unit buildings).
Forward outlook
- Local home prices are declining (-3.0%/yr); year-one equity from $574 of loan paydown is wiped out by about $2k of value loss. Plan a longer hold.
- Snohomish County population projected at +30% by 2050 — long-run rental-demand tailwind backs the buy-and-hold thesis.
- At projected returns (-3.0% appreciation + 1.2% rent growth), your $23k cash investment doubles in ~3 years — after that, you're playing with house money.
Negotiation context
- It's been on market 191 days — a 12% lower offer ($73k) is reasonable based on typical stale-listing flexibility.
Questions for the listing agent
- It's been on market 191 days. Have you received any prior offers? Is the seller open to a 12% concession, seller financing, or rate buy-down credit?
- Built in 1969 — when were the roof, HVAC, electrical panel, plumbing, and water heater last replaced?
- Why hasn't it sold? Are there any deal-killer items the seller is aware of (foundation, flood, title, zoning, code violations)?
- Is there a deadline driving the sale (1031 exchange, divorce, estate, relocation)? That informs how much negotiation room exists.
- Schools are D-rated, which usually means shorter tenancies and higher turnover. Who's the typical renter profile here, and what's been the actual vacancy rate?
- What's the average days-on-market for RENTAL listings here right now (not sales)? A rising rental-DOM trend means longer vacancies and softer asking-rent achievability than the comps imply.
- What's the recent tenant-quality profile in this submarket — average credit score on applications, eviction rate, late-payment / NSF rate, and stable-employment percentage? A property-management company in the area should have these aggregated.
- How much new for-sale + rental construction is in the pipeline within 1–3 miles? Heavy new supply typically softens prices + rents 12–24 months out; constrained supply supports both.
Investment metrics
- 1% rule
- 2.47% ✓
- Cap rate
- 21.38%
- Cash-on-cash
- 53.88%
- DSCR
- 3.40
- GRM
- 3.4
CMA / ARV
- ARV (median comp)
- $95,000
- List price
- $82,999
- Delta
- -12.63%
- Verdict
- UNDERPRICED
- Comps
- 3 within 1.0 mi
Show comp detail 1 sale within ~0.75 mi
| Address | Dist | Beds/Ba | Sqft | Sold | Price | $/sf | Match |
|---|---|---|---|---|---|---|---|
| 13320 Highway 99 #43 | 0.51mi | 2/1.0 | 648 (+12%) | 24mo | $60,000 | $93 | 35 |
Match score weights: distance 35% · size 25% · config 20% · recency 20%. Top-matched comps best support the ARV.
Projected returns pro-forma
-3.0% appreciation · 1.22% rent growth · sell at horizon
- IRR
- 50.0%
- Equity multiple
- 3.13×
- Total profit
- $49,442
- Equity at exit
- $12,375
- IRR
- 54.7%
- Equity multiple
- 5.93×
- Total profit
- $114,497
- Equity at exit
- $7,176
Cash invested: $23,240 (down + closing). Projections, not guarantees.
Landlord ↔ Tenant lean methodology
- Overall (STATE)
- 28 Tenant-Leaning
- State Washington
- 28 Tenant-Leaning · D+8
- County
- — inherits STATE
- City
- — inherits STATE
ZIP-level market 98087
- Rents YoY
- 1.2%
- Active inventory
- 232
- Price-to-rent
- 3.4×
Monthly cashflow live
- Estimated rent
- $2,047 high interval (Pro) →
- Mortgage (P&I)
- −$435
- Tax est. 1.5%
- −$104 /mo · $1,245/yr
- Insurance
- −$35
- HOA
- −$0
- Vacancy / Maint / Mgmt
- −$430
- Net cashflow
- $1,044
Break-even live
UW: 25.0% down · 7.5% · 30yr · 1.5% tax · 5.0% vac · 8.0% maint · 8.0% mgmt
Financing live
Cash to close
- Down payment
- $20,750
- Closing costs
- $2,490
- Reserves months
- —
- Total cash needed
- —
Loan-product check · same deal, 3 products live
Conventional
25% down · 7.5% · 30yr
- Down + closing
- —
- Monthly P&I
- —
- Monthly cashflow
- —
- DSCR
- —
- Eligible?
- —
Personal DTI + credit; lowest rate.
DSCR
20% down · 8.5% · 30yr
- Down + closing
- —
- Monthly P&I
- —
- Monthly cashflow
- —
- DSCR
- —
- Eligible?
- —
No personal income docs; deal must DSCR.
Hard money
10% down · 12.0% · 12mo
- Down + closing
- —
- Monthly P&I
- —
- Monthly cashflow
- —
- DSCR
- —
- Eligible?
- —
Short-term bridge; refi at stabilization.
Rent comps 19 comps
| Address | Beds | Baths | Sqft | Rent | $/sqft | DOM | Units | Dist |
|---|---|---|---|---|---|---|---|---|
| 14014 Admiralty Way Lynnwood, WA | 1.0–2.0 | 1.0–2.0 | 768 | $1,975 | $2.57 | 4d | 6 | 0.08mi |
| 15001 35th Ave W Lynnwood, WA | 1.0–3.0 | 1.0–2.0 | 885 | $2,010 | $2.27 | 4d | 15 | 0.60mi |
| 15305 Highway 99 Lynnwood, WA | 1.0 | 1.0 | 375 | $1,400 | $3.73 | 4d | 1 | 0.90mi |
| 13000 Admiralty Way Unit K103 Everett, WA | 1.0 | 1.0 | 609 | $1,700 | $2.79 | 43d | 1 | 1.00mi |
| 2510 164th St SW Lynnwood, WA | 3.0 | 1.0–2.0 | 998 | $2,670 | $2.68 | 1d | 1 | 1.08mi |
| 15631 Ash Way Lynnwood, WA | 2.0 | 1.0–2.0 | 786 | $2,401 | $3.05 | 2d | 18 | 1.26mi |
| 12907 E Gibson Rd Everett, WA | 1.0–2.0 | 1.0–2.0 | 775 | $2,081 | $2.69 | 1d | 5 | 1.29mi |
| 4902 148th St SW Edmonds, WA | 1.0–2.0 | 1.0–2.0 | 801 | $2,221 | $2.77 | 1d | 10 | 1.36mi |
| 15700 44th Ave W Lynnwood, WA | 1.0–3.0 | 1.0–2.0 | 940 | $1,979 | $2.11 | 2d | 1 | 1.37mi |
| 16104 36th Ave W Lynnwood, WA | 1.0–2.0 | 1.0 | 761 | $2,099 | $2.76 | 2d | 6 | 1.37mi |
| 3711 164th St SW Lynnwood, WA | 1.0–2.0 | 1.0–2.0 | 845 | $2,533 | $3.00 | 1d | 7 | 1.37mi |
| 1007 130th St SW Everett, WA | 1.0–2.0 | 1.0–2.0 | 796 | $1,800 | $2.26 | 1d | 9 | 1.38mi |
| 12121 Highway 99 Everett, WA | 1.0–2.0 | 1.0 | 638 | $1,637 | $2.56 | 4d | 14 | 1.38mi |
| 16200 Admiralty Way Lynnwood, WA | 2.0 | 1.0–2.0 | 783 | $3,019 | $3.86 | 1d | 33 | 1.38mi |
| 909 132nd St SW Everett, WA | 1.0 | 1.0 | 520 | $1,495 | $2.88 | 1d | 2 | 1.40mi |
| 3805 164th St SW Lynnwood, WA | 1.0–2.0 | 1.0–2.0 | 843 | $2,295 | $2.72 | 1d | 5 | 1.41mi |
| 12118 Highway 99 Everett, WA | 1.0–5.0 | 1.0–3.0 | 1117 | $1,941 | $1.74 | 1d | 5 | 1.42mi |
| 15914 44th Ave W Lynnwood, WA | 1.0–2.0 | 1.0–2.0 | 932 | $2,159 | $2.32 | 1d | 10 | 1.45mi |
| 12402 Admiralty Way Everett, WA | 1.0–3.0 | 1.0–2.0 | 842 | $1,922 | $2.28 | 1d | 16 | 1.46mi |
Listing history 16 events
-
2026-06-18days on market $82,999 Active 191 DOM
-
2026-06-17days on market $82,999 Active 190 DOM
-
2026-06-16days on market $82,999 Active 189 DOM
-
2026-06-15days on market $82,999 Active 188 DOM
-
2026-06-13days on market $82,999 Active 186 DOM
-
2026-06-09days on market $82,999 Active 182 DOM
-
2026-06-08days on market $82,999 Active 181 DOM
-
2026-06-07days on market $82,999 Active 180 DOM
-
2026-06-04days on market $82,999 Active 177 DOM
-
2026-06-03days on market $82,999 Active 176 DOM
-
2026-06-02days on market $82,999 Active 175 DOM
-
2026-06-01days on market $82,999 Active 174 DOM
-
2026-05-31days on market $82,999 Active 173 DOM
-
2026-04-24price $82,999
-
2026-02-09price $84,500
-
2025-12-09$85,000 Active
ⓘ Source: listings_history table (triggers on properties + properties_extension) + one-shot
backfill from property_details.listing_events for pre-trigger history.
Nearby sold comps map
Loading sold comps map…
Walkable amenities ~0.75 mi
Loading nearby amenities…
Taxation est. · year 1
- Rental income
- $24,564
- − Mortgage interest
- −$4,649
- − Property taxes
- −$1,245
- − Insurance
- −$415
- − Repairs & maintenance
- −$1,965
- − Management
- −$1,965
- − Depreciation
- −$2,415
- Taxable income
- $11,910
- Est. tax owed @ 24.0%
- −$2,858
- After-tax cash flow
- $9,664/yr
For passive investors: Depreciation is non-cash, so a rental often shows a tax loss while cash-flowing — sheltering income. Rental losses are passive: they offset passive income freely, and up to $25,000/yr can offset ordinary (W-2) income if you actively participate and your MAGI is under $100k (phasing out to $0 by $150k); unused losses carry forward. On sale, claimed depreciation is recaptured at up to 25%, and gains may owe capital-gains tax (a 1031 exchange can defer both). Figures are a year-1 estimate at your 24.0% rate — not tax advice; consult a CPA.
Schools (NCES district)
- District
- Mukilteo School District
- NCES district ID
- 5305430
- Math proficiency
- 47% ▼ -2.00%
- Reading proficiency
- 59% ▬ 0.00%
- Median HH income
- $60,807
- Composite
- 48.17/100
- National rank
- #4733
- State rank
- #111 of 291 in WA
Livability — Lake Stickney
- Score
- 73/100
- State rank
- #192
- US rank
- #5224
Category grades
Schools grade is shown separately in the Schools card above.
Census & demographics
- Census place
- Lake Stickney, WA
- County
- Snohomish County · 786,756 people
- Metro
- Seattle-Tacoma-Bellevue, WA
- Population (ZIP)
- 41,796
- Household income
- $106,693
- Rent vs Own
- Severe rent burden
- 2303.0
Population outlook (Snohomish County) Hauer SSP2
- Today (2025)
- 899,800 people
- By 2030
- 960,975 · +6.8%
- By 2040
- 1,074,447 · +19.4%
- By 2050
- 1,171,954 · +30.2%
- By 2075
- 1,384,849 · +53.9%
- By 2100
- 1,497,296 · +66.4%
Race, ethnicity, and origin ACS 2023
- Neighborhood character
- Highly diverse neighborhood (Simpson 0.71)
- Race & ethnicity
- White 48% Asian 20% Two or more races 13% Hispanic / Latino 12% Black 8% Pacific Islander 2%
- Hispanic origin (detail)
- Mexican 8%
- Common ancestry
- Portuguese 3% Slovak 3% Italian 3%
- Foreign-born
- 29% · Canada, South Korea, Vietnam
- Languages at home
- 64% English-only · Spanish 6% Russian/Polish/Slavic 5% Other Indo-European 5%
Political lean MEDSL · Snohomish
- 2024 margin
- D (+19.0) · D 57.8% · R 38.9% · Other 3.3%
- 2008→2024 swing
- +0.1pp no change · 2008: 18.9pp · 2024: 19.0pp
- All cycles
- 2024: D+19.0 2020: D+20.6 2016: D+16.6 2012: D+16.2 2008: D+18.9
Not yet ingested
- Civics
- —
Market trends
- HPI YoY
- ▼ -723.54%
- Current HPI
- 320.6888
- Rent YoY
- ▲ 1.22%
- Metro
- Seattle-Tacoma-Bellevue, WA
- State GDP YoY
- ▲ 4.65%
- F500 in state
- 22
Industry mix (Fortune 500 HQ in WA)
| Industry | F500 HQs | Revenue |
|---|---|---|
| Retail | 2 | $269B |
|
||
| Technology / Retail | 1 | $638B |
|
||
| Technology | 1 | $245B |
|
||
| Telecommunications | 1 | $38B |
|
||
| Food / Beverage | 1 | $36B |
|
||
| Automotive / Trucks | 1 | $34B |
|
||
Price history
-2.4% since first listed3 events — show timeline
- 2026-04-24 Price Changed $82,999 NWMLS as Distributed by MLS Grid
- 2026-02-09 Price Changed $84,500 NWMLS as Distributed by MLS Grid
- 2025-12-09 Listed $85,000 NWMLS as Distributed by MLS Grid
Property tax history
+4.1%/yrLatest (2026): $121 · +27.8% YoY. Source: county tax records.
Cash-flow waterfall
monthlySold comps — $/sqft
last 12 mo · ≤1 miLoading sold comps…