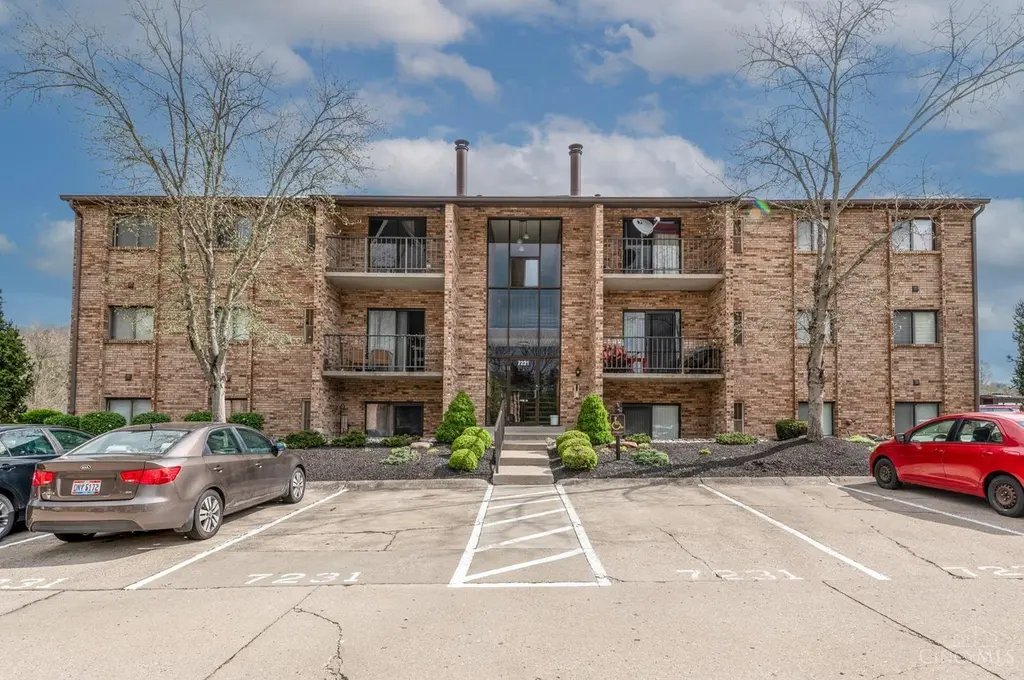
7231 Creekview Dr #9 · Taylor Creek, OH
Flood risk 1/10 · Minimal
- FEMA flood zone
- X (unshaded)
- Chance of flooding over 30 yrs
- 0.0%
- Est. flood insurance / yr
- $507 – $1,088
Fire risk 1/10 · Minimal
- Est. fire insurance / yr
- $713 – $1,323
Heat risk 4/10 · Minor
- Hot days now (above 102°F)
- 7 days/yr
- Hot days in 30 yrs
- 20 days/yr
Wind risk 2/10 · Minimal
- Chance of severe wind over 30 yrs
- 1.0%
Air-quality risk 3/10 · Minor
- Unhealthy air days now
- 2 days/yr
- Unhealthy air days in 30 yrs
- 4 days/yr
Risk factors via First Street. Map © Google.
Why this score? — see what drove the B- grade
The composite is a weighted blend of 9 inputs, each scored 0–100. Each bar is that input's sub-score; the figure is the points it added to the 100-point composite (weight × sub-score).
- Cash flow +30.0/30.0
- 1% rule +10.0/10.0
- DSCR +10.0/10.0
- ARV discount +7.5/15.0
- Schools +3.7/10.0
- Livability +3.2/5.0
- Rent growth +2.5/5.0
- Condition / age +2.2/5.0
- Appreciation +0.0/10.0
$100,000
🖨 Deal sheet 📄 Offer letter ✓ Due diligence
Listing remarks MLS
Own instead of rent or add to your portfolio, with this condo conveniently located in Taylor Creek. Add your own touches in this 3rd floor condo featuring vaulted ceilings, balcony, new HVAC in 2023, a wood fireplace, 2 bedrooms and 1.5 bathrooms. Enjoy the community pool and clubhouse. Set up your showing today.
Key facts
- Added privacy
- New hvac
- Natural light
Tags
Property features AI
Finance
- Other: Residential zoning; Lot approximately 1.8226 acres (shared/condo context)
- HOA & community: HOA managed by Rentz Management; Monthly association fee of $270; HOA covers sewer, snow removal, trash, association dues, clubhouse, and landscaping
Exterior
- Parking: Common parking (details not provided)
- Utilities: Public water; Public sewer; Natural gas available
- Home design: Traditional style; One-level unit (unit entry level 3); Unit located in a 3-level building
- Construction: Brick construction; Poured foundation
- Exterior features: Aluminum windows; Pets allowed; Townhouse-style condo; Shingle roof
Interior
- Kitchen: Tile floor; Wood cabinets; Oven/Range; Dishwasher; Refrigerator
- Bedrooms: 2 bedrooms total; Primary bedroom on level 1 (14 x 12); Second bedroom on level 1 (11 x 9)
- Flooring: Tile in kitchen; Wall-to-wall carpet in living and dining areas
- Bathrooms: 1 full bathroom on level 1; 1 half bathroom on level 1
- Heating & cooling: Heat pump and electric heating; Central air conditioning; Gas water heating
- Interior features: Common hallway entry; Laundry in unit; Walkout from living room; Wall-to-wall carpet in living and dining areas; Tile floor and wood cabinets in kitchen; Fireplace with wood fuel
- Laundry & utility: Washer and dryer in unit
Neighborhood map
What this means for you Summary
Snapshot
- This is a 2-bed/1.5-bath townhouse listed at $100k. Condition is rated fair.
Deal economics
- At list price, monthly cash flow is $389 ($5k/yr) — positive.
- The deal already cash-flows at list — no discount required.
- Meets the 1% rule at list price ($2k rent vs $100k).
- Recommended offer: $94k (6.0% below list) — sets the bar for market timing.
Location & tenants
- Location reads 64/100 on livability (#794 in OH) — a middle-class / working-renter tenant base. Strengths: crime A+, employment A+, housing A+; Watch: schools D-, amenities F, commute F.
- Northwest Local (suburban): math 38% / reading 46% proficiency, ranked #508 of 656 in OH (top 77%) — families likely to look elsewhere, expect single-tenant / working-renter base with shorter leases.
- Market conditions: 51 active listings in the ZIP; solid renter incomes; 801 units permitted in Hamilton County in 2024 (190 in 5+ unit buildings).
Forward outlook
- Local home prices are declining (-3.0%/yr); year-one equity from $691 of loan paydown is wiped out by about $3k of value loss. Plan a longer hold.
- At projected returns (-3.0% appreciation + 3.0% rent growth), your $28k cash investment doubles in ~8 years — after that, you're playing with house money.
Negotiation context
- It's been on market 71 days — a 6% lower offer ($94k) is reasonable based on typical stale-listing flexibility.
- 2 sale attempts; this cycle's ask has dropped $15k (13%) from the opening price — seller is motivated, your offer sets the floor, not the list.
Questions for the listing agent
- It's been on market 71 days. Have you received any prior offers? Is the seller open to a 6% concession, seller financing, or rate buy-down credit?
- Have any recent inspections been done? Can we get a copy of the seller's disclosures and any deferred-maintenance estimates?
- What does the HOA fee cover, when was the last increase, and are there any pending special assessments or reserve-fund shortfalls?
- Why hasn't it sold? Are there any deal-killer items the seller is aware of (foundation, flood, title, zoning, code violations)?
- Is there a deadline driving the sale (1031 exchange, divorce, estate, relocation)? That informs how much negotiation room exists.
- Schools are D-rated, which usually means shorter tenancies and higher turnover. Who's the typical renter profile here, and what's been the actual vacancy rate?
- What's the average days-on-market for RENTAL listings here right now (not sales)? A rising rental-DOM trend means longer vacancies and softer asking-rent achievability than the comps imply.
- What's the recent tenant-quality profile in this submarket — average credit score on applications, eviction rate, late-payment / NSF rate, and stable-employment percentage? A property-management company in the area should have these aggregated.
- How much new for-sale + rental construction is in the pipeline within 1–3 miles? Heavy new supply typically softens prices + rents 12–24 months out; constrained supply supports both.
Investment metrics
- 1% rule
- 1.71% ✓
- Cap rate
- 10.96%
- Cash-on-cash
- 16.65%
- DSCR
- 1.74
- GRM
- 4.9
CMA / ARV
No comps found within radius.
Projected returns pro-forma
-3.0% appreciation · 3.0% rent growth · sell at horizon
- IRR
- 8.0%
- Equity multiple
- 1.31×
- Total profit
- $8,738
- Equity at exit
- $14,910
- IRR
- 17.3%
- Equity multiple
- 2.44×
- Total profit
- $40,259
- Equity at exit
- $8,646
Cash invested: $28,000 (down + closing). Projections, not guarantees.
Landlord ↔ Tenant lean methodology
- Overall (STATE)
- 73 Landlord-Friendly
- State Ohio
- 73 Landlord-Friendly · R+6
- County
- — inherits STATE
- City
- — inherits STATE
ZIP-level market 45247
- Active inventory
- 51
- Price-to-rent
- 4.9×
Monthly cashflow live
- Estimated rent
- $1,708 medium interval (Pro) →
- Mortgage (P&I)
- −$524
- Tax est. 1.5%
- −$125 /mo · $1,500/yr
- Insurance
- −$42
- HOA
- −$270
- Vacancy / Maint / Mgmt
- −$359
- Net cashflow
- $389
Break-even live
UW: 25.0% down · 7.5% · 30yr · 1.5% tax · 5.0% vac · 8.0% maint · 8.0% mgmt
Financing live
Cash to close
- Down payment
- $25,000
- Closing costs
- $3,000
- Reserves months
- —
- Total cash needed
- —
Loan-product check · same deal, 3 products live
Conventional
25% down · 7.5% · 30yr
- Down + closing
- —
- Monthly P&I
- —
- Monthly cashflow
- —
- DSCR
- —
- Eligible?
- —
Personal DTI + credit; lowest rate.
DSCR
20% down · 8.5% · 30yr
- Down + closing
- —
- Monthly P&I
- —
- Monthly cashflow
- —
- DSCR
- —
- Eligible?
- —
No personal income docs; deal must DSCR.
Hard money
10% down · 12.0% · 12mo
- Down + closing
- —
- Monthly P&I
- —
- Monthly cashflow
- —
- DSCR
- —
- Eligible?
- —
Short-term bridge; refi at stabilization.
HOA detail
- Monthly dues
- $270 · $3,240/yr
- Likely covers
- pool
Listing history 20 events
-
2026-06-18days on market $100,000 Active 71 DOM
-
2026-06-17days on market $100,000 Active 70 DOM
-
2026-06-16days on market $100,000 Active 69 DOM
-
2026-06-15days on market $100,000 Active 68 DOM
-
2026-06-13days on market $100,000 Active 66 DOM
-
2026-06-12days on market $100,000 Active 65 DOM
-
2026-06-09days on market $100,000 Active 62 DOM
-
2026-06-08days on market $100,000 Active 61 DOM
-
2026-06-08days on market $100,000 Active 60 DOM
-
2026-06-07pricedays on market $100,000 Active 59 DOM
-
2026-06-04days on market $105,000 Active 56 DOM
-
2026-06-02days on market $105,000 Active 55 DOM
-
2026-06-01days on market $105,000 Active 54 DOM
-
2026-05-31days on market $105,000 Active 53 DOM
-
2026-05-10price $105,000
-
2026-04-24price $110,000
-
2026-04-08$115,000 Active
-
2025-04-25soldstatus $110,000 Sold 314-char remark
Show marketing remark (314 chars)
Own instead of rent or add to your portfolio, with this condo conveniently located in Taylor Creek. Add your own touches in this 3rd floor condo featuring vaulted ceilings, balcony, new HVAC in 2023, a wood fireplace, 2 bedrooms and 1.5 bathrooms. Enjoy the community pool and clubhouse. Set up your showing today.
-
2025-03-25historical Contingency Pending 314-char remark
Show marketing remark (314 chars)
Own instead of rent or add to your portfolio, with this condo conveniently located in Taylor Creek. Add your own touches in this 3rd floor condo featuring vaulted ceilings, balcony, new HVAC in 2023, a wood fireplace, 2 bedrooms and 1.5 bathrooms. Enjoy the community pool and clubhouse. Set up your showing today.
-
2025-03-04$110,000 Active 314-char remark
Show marketing remark (314 chars)
Own instead of rent or add to your portfolio, with this condo conveniently located in Taylor Creek. Add your own touches in this 3rd floor condo featuring vaulted ceilings, balcony, new HVAC in 2023, a wood fireplace, 2 bedrooms and 1.5 bathrooms. Enjoy the community pool and clubhouse. Set up your showing today.
ⓘ Source: listings_history table (triggers on properties + properties_extension) + one-shot
backfill from property_details.listing_events for pre-trigger history.
Climate risk First Street
- Flood 1/10 Low FEMA zone X (unshaded) · 0% chance over 30 yrs
- Wildfire 1/10 Low
- Heat 4/10 Moderate 7 d/yr ≥102°F today · 20 d/yr by 30 yrs out
- Wind 2/10 Low 100% chance of damaging wind over 30 yrs
- Air quality 3/10 Moderate 2 unhealthy d/yr today · 4 by 30 yrs out
Nearby sold comps map
Loading sold comps map…
Walkable amenities ~0.75 mi
Loading nearby amenities…
Taxation est. · year 1
- Rental income
- $20,502
- − Mortgage interest
- −$5,602
- − Property taxes
- −$1,500
- − Insurance
- −$500
- − Repairs & maintenance
- −$1,640
- − Management
- −$1,640
- − HOA
- −$3,240
- − Depreciation
- −$2,909
- Taxable income
- $3,471
- Est. tax owed @ 24.0%
- −$833
- After-tax cash flow
- $3,830/yr
For passive investors: Depreciation is non-cash, so a rental often shows a tax loss while cash-flowing — sheltering income. Rental losses are passive: they offset passive income freely, and up to $25,000/yr can offset ordinary (W-2) income if you actively participate and your MAGI is under $100k (phasing out to $0 by $150k); unused losses carry forward. On sale, claimed depreciation is recaptured at up to 25%, and gains may owe capital-gains tax (a 1031 exchange can defer both). Figures are a year-1 estimate at your 24.0% rate — not tax advice; consult a CPA.
Condition & rehab AI · 13 photos
This 2-bedroom, 1.5-bathroom condo at Taylor Creek Condominiums requires moderate repairs and maintenance, particularly in the exterior and landscaping areas. With some updates, it has the potential to significantly increase its value for resale or rental.
Repairs flagged
- Minor Exterior paint — Some discoloration and minor cracking on the brick facade.
- Minor Landscaping — Shrubs and trees appear somewhat sparse and in need of trimming.
Value-add opportunities
- Resale Paint interior walls — Fresh paint can make a significant difference in the home's appearance and appeal to potential buyers.
- Resale Replace carpet in living areas — New carpet can improve the home's overall look and feel, making it more appealing to potential buyers.
- Both Trim and maintain landscaping — Well-maintained landscaping can enhance curb appeal and add value to both resale and rental properties.
Renovation cost estimate screening
| Repair item | Severity | Est. cost |
|---|---|---|
| Exterior paint · Some discoloration and minor cracking on the brick facade. | Minor | $500–3,000 |
| Landscaping · Shrubs and trees appear somewhat sparse and in need of trimming. | Minor | $500–3,000 |
| Total estimated repair cost · 2 items | $1,000–6,000 |
Value-add ROI direction
- Resale Paint interior walls — Fresh paint can make a significant difference in the home's appearance and appeal to potential buyers. ↑
- Resale Replace carpet in living areas — New carpet can improve the home's overall look and feel, making it more appealing to potential buyers. ↑
- Both Trim and maintain landscaping — Well-maintained landscaping can enhance curb appeal and add value to both resale and rental properties. ↑
ⓘ Cost ranges are severity-bucket heuristics (US national rule-of-thumb). Get contractor quotes + a written scope before underwriting a rehab budget.
Schools (NCES district)
- District
- Northwest Local
- NCES district ID
- 3904736
- Math proficiency
- 38% ▼ -18.00%
- Reading proficiency
- 46% ▼ -10.00%
- Median HH income
- $58,765
- Composite
- 36.97/100
- National rank
- #4528
- State rank
- #508 of 656 in OH
Livability — Taylor Creek
- Score
- 64/100
- State rank
- #794
- US rank
- #14500
Category grades
Schools grade is shown separately in the Schools card above.
Census & demographics
- Census place
- Taylor Creek, OH
- County
- Hamilton · 838,887 people
- City population
- 23,588
- Metro
- Cincinnati, OH-KY-IN
- Population (ZIP)
- 23,588
- Household income
- $95,810
- Rent vs Own
- Severe rent burden
- 10.7
Population outlook (Hamilton County) Hauer SSP2
- Today (2025)
- 826,054 people
- By 2030
- 830,947 · +0.6%
- By 2040
- 832,319 · +0.8%
- By 2050
- 822,428 · -0.4%
- By 2075
- 788,688 · -4.5%
- By 2100
- 710,674 · -14.0%
Race, ethnicity, and origin ACS 2023
- Neighborhood character
- Predominantly White (87%)
- Race & ethnicity
- White 87% Black 7% Two or more races 4%
- Common ancestry
- Romanian 3% Lithuanian 2% Italian 2%
- Foreign-born
- 3% · China
- Languages at home
- 96% English-only · Arabic 1% Russian/Polish/Slavic 1% Spanish 1%
Political lean MEDSL · Hamilton
- 2024 margin
- D (+14.9) · D 57.0% · R 42.1%
- 2008→2024 swing
- +7.9pp toward D · 2008: 7.0pp · 2024: 14.9pp
- All cycles
- 2024: D+14.9 2020: D+15.9 2016: D+9.5 2012: D+4.9 2008: D+7.0
Not yet ingested
- Civics
- —
Market trends
- HPI YoY
- ▼ -126.31%
- Current HPI
- 204.334
- Rent YoY
- —
- Metro
- —
- State GDP YoY
- ▲ 1.98%
- F500 in state
- 48
Industry mix (Fortune 500 HQ in OH)
| Industry | F500 HQs | Revenue |
|---|---|---|
| Insurance | 3 | $145B |
|
||
| Industrial Machinery | 3 | $49B |
|
||
| Financial Services | 3 | $24B |
|
||
| Consumer Goods | 2 | $93B |
|
||
| Aerospace / Defense | 2 | $47B |
|
||
| Utilities | 2 | $33B |
|
||
Price history
-4.5% since first listed6 events — show timeline
- 2026-05-10 Price Changed $105,000 Cincy MLS
- 2026-04-24 Price Changed $110,000 Cincy MLS
- 2026-04-08 Listed $115,000 Cincy MLS
- 2025-04-25 Sold (MLS) $110,000 Cincy MLS
- 2025-03-25 Contingent — Cincy MLS
- 2025-03-04 Listed $110,000 Cincy MLS
Cash-flow waterfall
monthlySold comps — $/sqft
last 12 mo · ≤1 miLoading sold comps…